Z/Ce@hemin enzymes with enhanced peroxidase activity for monitoring and screening the oxidative stress models of Parkinson’s disease
Introduction
Parkinson’s disease (PD) ranks as the world’s second most prevalent neurodegenerative disorder, following Alzheimer’s disease1,2. Its main symptoms include movement disorders, such as bradykinesia, rigidity, and tremors. Patients with PD also show non-motor symptoms, including sensory impairment and cognitive dysfunction3,4. Currently, the number of patients with PD in China has reached 2 million, accounting for approximately 50% of the global PD population5. Against the backdrop of China’s increasingly aging population, PD has become a significant threat to the physical and mental health of the elderly. The most significant pathological changes in PD include the deterioration and loss of dopaminergic neurons within the substantia nigra of the midbrain6,7. Additionally, typical features of PD involve the formation of Lewy bodies and the buildup of α-synuclein in remaining neurons8,9. Despite extensive research, the cause of PD is still not fully understood. Genetic factors, environmental toxins, aging, and various other influences have been linked to the onset of PD10,11. To study PD pathogenesis and explore new clinical treatment methods, it is important to prepare and monitor effective models of PD.
PD models are generally classified into two types: neurotoxin models and gene editing models. There are also a few hybrid models that integrate aspects of both, though neurotoxin models are the most commonly employed. Commonly utilized neurotoxins in these models include 6-hydroxydopamine (6-OHDA), 1-methyl-4-phenyl-1,2,3,6-tetrahydropyridine (MPTP), and rotenone (ROT)12. These neurotoxins produce an elevated level of hydrogen peroxide (H2O2) in the dopaminergic neurons. An excessive level of H2O2 is associated with oxidative stress and significant cell damage, resulting in PD13,14. Thus, there is a need for a method that enables rapid, sensitive, and specific analysis of H2O2 to accurately evaluate neurotoxin-induced PD models. Numerous techniques, such as chromatography15, chemiluminescence16, electrochemistry17, and spectral analysis18, have been employed for H2O2 detection. However, these techniques often require advanced equipment, intricate sample processing, or complicated material preparation, which restricts their broader use. In contrast, spectrophotometry, particularly colorimetric analysis, has gained significant attention due to its ease of use, high sensitivity, selectivity, and the diverse range of available sensing materials and systems, including enzyme-driven chromogenic reactions19.
Recently, due to the challenges associated with natural enzymes, such as complex extraction processes, purification difficulties, and easy inactivation, artificial enzymes have gained significant attention for their ability to be mass-produced, withstand harsh conditions, and maintain stability20,21,22,23. A notable area of interest in this field is the study of peroxidase mimics, which can be classified into two categories: inorganic and biomimetic nanozymes24,25,26,27,28,29,30. Hemin, functioning as the active center of natural peroxidase, has been modified or integrated onto various materials with extensive surface areas to boost its catalytic efficiency and stability, making it a focal point of research in biomimetic peroxidases31,32,33. Peroxidase mimics can be synthesized using inorganic nanomaterials and peptides. Among these, capped ceria nanoparticles (CeO2 NPs) are particularly notable for their high catalytic capabilities34. In physiological conditions, CeO2 NPs can either release oxygen or accept electrons, owing to their fluorite lattice structure, which leads to oxygen vacancies and reduced valence states. This electron transfer between Ce(III) and Ce(IV) imparts strong catalytic properties to these nanoparticles35. However, their catalytic performance is often hindered by particle aggregation. Modifying these particles with zeolitic imidazolate framework-8 (ZIF-8) helps to prevent this issue, enhancing their catalytic activity under biological conditions36,37. Drawing inspiration from the structure of natural enzymes, where the active center is shielded by a polypeptide chain within a hydrophobic cavity, Z/CeO2 NPs have also been employed to develop biomimetic enzymes. Additionally, their high porosity, extensive surface area, and structured pores make them ideal carriers for hemin, creating a more versatile platform for the construction of biomimetic enzymes.
In this study, an artificial enzyme, Z/Ce@hemin, was developed by anchoring hemin onto Z/CeO2 nanoparticles to enhance its catalytic performance, as depicted in Fig. 1. This innovative approach addresses the limitations of both CeO2 NPs and hemin, providing several benefits: (i) The Z/CeO2 NP framework prevents hemin from dimerizing, thereby improving its loading efficiency and activity. (ii) ZIF-8’s surface functions as a peroxidase, helping maintain antioxidant activity even under high levels of H2O2 or other reactive oxidants by breaking the O-O bond to neutralize H2O2. (iii) Upon ZIF-8 decomposition, active elements are released, which work synergistically to boost the catalytic efficiency of both CeO2 and hemin. Further analysis demonstrated that this material binds with H2O2 substrates more rapidly, forming active intermediates that accelerate the overall catalytic reaction. Consequently, a straightforward and sensitive colorimetric technique for H2O2 detection was devised, integrating a peroxidase-catalyzed chromogenic system. This method has been successfully applied to measure H2O2 levels in models involving 6-OHDA, MPTP, and ROT-induced PD cells, as well as Caenorhabditis elegans (C. elegans).
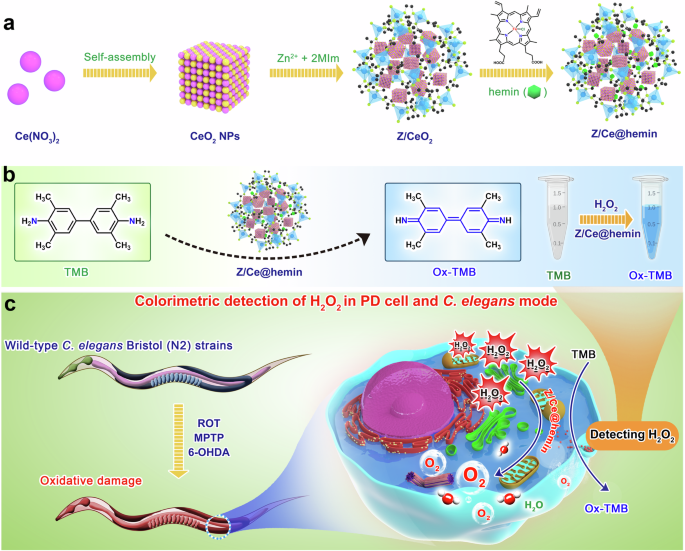
a Schematic illustration for in situ synthetic approach of hemin loaded Z@CeO2 enzyme. b Design and principle of the colorimetric sensor based on Z/Ce@hemin enzyme and TMB. c Schematic representation of the prepared colorimetric sensing platform for H2O2 detection in PD cell and C. elegans modes.
Methods
Materials
Zn(NO3)2·6H2O and 2-methylimidazole were purchased from Macklin (Shanghai, China). Ce(NO3)2·6H2O and polyvinylpyrrolidone (PVP) were purchased from Aladdin (Shanghai, China). 3,3 ‘ 5,5 ‘ -tetramethylbenzidine (TMB), 30% H2O2, and heme were purchased from Sinopharm Chemical Reagent Co. Penicillin streptavidin and L-glutamine were purchased from Beijing Solebo Company, DMEM was purchased from Gibco Company, USA, FBS was purchased from Biological Industries, USA, 6-hydroxydopamine (6-OHDA) was purchased from Aladdin Company, Shanghai, China, 1methyl-4-phenyl-1,2,3,6-tetrahydropyridine (MPTP) was purchased from Shanghai Biyuntian Biotechnology Co. Biotechnology Co. Ltd, and rotenone (ROT) was purchased from sigma, U.S.A. Unless otherwise stated, all chemicals used were of analytical quality and did not require further purification before use. The entire study was performed with milliq water.
Instrumentation and characterization
UV–vis absorption spectra were collected using Cary 60 Agilent Technologies. Kinetic curves were obtained using an Epoch2 microplate spectrophotometer from Agilent Bio Tek, USA. Fluorescence spectra were measured on an Agilent Technologies Cary Eclipse fluorescence spectrophotometer (Santa Clara, CA, USA). Transmission electron microscopy (TEM) images of Z/CeO2 and hemin functionalized Z/CeO2 were obtained using a Tecnai G2F30 Fourier transform Elmer spectrometer at an accelerating voltage of 200 kV.
Synthesis of Z/CeO2 composites and Z/Ce@hemin enzymes
To synthesize CeO2 nanopolyhedra, a solution of 0.05 M Ce(NO3)2·6H2O and NaOH was prepared in 40 mL of deionized water, followed by magnetic stirring to ensure complete dissolution. The resulting mixture was placed in a round-bottom flask with a magnetic stir bar, then transferred to a polytetrafluoroethylene container. This setup was sealed in a stainless steel autoclave and subjected to heat treatment at 180 °C for 24 h. After this period, the product was collected, centrifuged with deionized water at 12,000 rpm for 20 min, washed three times, and finally vacuum-dried to obtain the CeO2 nanopolyhedra.
Next, 3.5 mg of the dried CeO2 nanopolyhedra and 100 mg of polyvinylpyrrolidone (PVP) were dissolved in 5 mL of methanol and placed in a round-bottom flask. Magnetic stir bars were added, and the mixture was stirred for 24 h. The resulting solution was washed three times with water, centrifuged at 8000 rpm for 20 min, and dried. The PVP-CeO2 composite was stored in 100 µL of methanol solution. Then, 3.5 mg of the PVP-CeO2 composite was added to 5 mL of 2-methylimidazole (25.6 mM) dissolved in methanol and stirred for 15 min. Subsequently, 5 mL of a 25.2 mM Zn(NO3)2·6H2O methanol solution was added, and the mixture was stirred at room temperature for 20 min. The product was centrifuged at 12,000 rpm for 10 min, washed three times with methanol, and vacuum-dried to obtain Z/CeO2 nanomaterials.
To synthesize Z/Ce@hemin enzymes, different weights of hemin were dissolved in 10 mL of methanol and added to a 50 mL round-bottom flask. The solution was mixed with 8 mg of Z/CeO2, sonicated for 24 h at room temperature, and centrifuged at 12,000 rpm for 20 min. The resulting precipitate was dispersed in 10 mM Tris-HCl buffer (pH 7.0) and sonicated for 30 min at room temperature. Finally, the mixture was centrifuged at 4000 rpm for 10 min to obtain the supernatant containing Z/Ce@hemin in the Tris-HCl buffer (10 mM, pH = 7.0).
Peroxidase-like activity of the Z/Ce@hemin enzymes
First, 60 μL of phosphate buffer solution (PB buffer, pH = 5, 0.25 M) was added to a 1.5 mL centrifuge tube, followed by 40 μL of H2O2 (1 M) solution, 12 μL of 30 mM TMB solution, and 8 μL (500 μg/mL) of Z/CeO2 composites, hemin, or Z/Ce@hemin enzyme solution. The reaction was performed for 5 min, and the absorbance change was measured at 652 nm using an enzyme-labeling instrument at 652 nm.
Optimization of the reaction condition
For the absorbance assay of Z/Ce@hemin enzymes treated with different TMB concentrations, 60 μL of PB buffer (pH = 5, 0.25 M) was first added to a 1.5 mL centrifuge tube, followed by 40 μL of 1 M H2O2 solution, different concentrations of TMB solution (1.0, 1.5, 2.0, 2.5, 3.0, 3.5, 4.0, 5.0, 6.0, and 7.0 mM), and 8 μL (100 μg/ mL) of the Z/Ce@hemin nano-enzyme solution. The absorbance change was measured at 652 nm using an enzyme marker after 4 min of the reaction.
For the absorbance assay of Z/Ce@hemin enzymes treated for different times, 60 μL of PB buffer (pH = 5, 0.25 M) was first added to a 1.5 mL centrifuge tube, followed by 40 μL of 1 M H2O2 solution, 12 μL of 30 mM TMB solution, and 100 μg/mL of Z/Ce@hemin enzyme solution. The reaction was performed at 1, 3, 5, 7, 10, 15, 17, 20, 25, and 30 min. The absorbance change was measured at 652 nm using an enzyme marker.
For the absorbance assay of Z/Ce@hemin enzymes treated at different temperatures, 60 μL of PB buffer (pH = 5, 0.25 M) was first added to a 1.5 mL centrifuge tube, followed by 40 μL of 1 M H2O2 solution, 12 μL of 30 mM TMB solution, and 100 μg/mL of Z/Ce@hemin enzyme solution. The reaction was performed at different temperatures of 20 °C, 25 °C, 30 °C, 35 °C, 40 °C, 45 °C, 50 °C, 55 °C, and 60 °C. The absorbance change was measured at 652 nm using an enzyme-labeling instrument.
For the absorbance assay of Z/Ce@hemin enzymes treated at different pH values, 60 μL of PB buffer (0.25 M) at different PH values (pH = 4.0, 4.5, 5.0, 5.5, 6.0, 6.5, 7.0, 7.5, 8.0, 8.5) was first added to a 1.5 mL centrifuge tube, followed by 40 μL of 1 M H2O2 solution, 12 μL of 30 mM TMB solution, and 100 μg/mL of Z/Ce@hemin nanoenzyme solution. The absorbance change was measured using a UV photometer.
Steady kinetic analysis of the Z/Ce@hemin enzymes
To explore the mechanism underlying the peroxidase-like activity of Z/Ce@hemin enzymes, steady–state kinetic analyses were conducted at room temperature. A mixture containing 600 µL of Z/Ce@hemin enzymes (100 µg/mL) and 1.8 mL of phosphate buffer (pH = 5.0) was prepared. In the first set of experiments, 300 µL of 1 M H2O2 solution was combined with varying TMB concentrations (ranging from 0.4 to 6.0 mM). The second set involved 300 µL of a 4 mM TMB solution mixed with different H2O2 concentrations (from 25 to 750 mM). The Michaelis–Menten constant was determined using the Lineweaver–Burk double reciprocal plot, applying the equation: 1/ν = Km/νm (1/[S] + 1/Km), where ν represents the initial velocity, Km denotes the Michaelis constant, νm is the maximum rate of reaction, and [S] is the substrate concentration38.
Colorimetric detection of H2O2
For the colorimetric analysis of H2O2, a mixture containing 600 µL of Z/Ce@hemin enzymes (100 µg/mL), 300 µL of 4 mM TMB, and varying concentrations of H2O2 was combined with 1.8 mL of 0.1 M phosphate buffer (pH = 5.0). The mixture was incubated at 35 °C for 10 min, and the absorbance was subsequently recorded at 652 nm using a UV–vis spectrophotometer to create the standard curve for H2O2 detection. The limit of detection (LOD) for H2O2 was estimated following standard protocols using the formula LOD = 3S/M, where S represents the standard deviation of the blank measurements and M denotes the slope of the calibration curve plotting absorbance at 652 nm against H2O2 concentration. Eleven blank samples were prepared by mixing 600 µL of Z/Ce@hemin enzyme (100 µg/mL), 300 µL of TMB (4 mM), and 300 µL of H2O2 (in place of H2O) with 1.8 mL of 0.1 M phosphate buffer (pH = 5.0). These samples were incubated at 35 °C for 10 min, and their absorbance values at 652 nm were used to determine the S value.
Cell culture and preparation of cell lysate
For cell culture: Rat pheochromocytoma (PC12) cells were purchased from the Cell Bank of Chinese Academy of Science (Shanghai, China). The cells were grown and maintained in Dulbecco’s Modified Eagle medium (DMEM) containing 10% fetal bovine serum (FBS) and 1% antibiotics (penicillin and streptomycin) in a cell culture incubator at 37 °C with an atmosphere of 5% CO2.
For the preparation of cell lysate: PC12 cells in the logarithmic growth phase were inoculated in 10 cm dishes, and when the cells in the dishes were confluent to 80%-90% of the bottom of the dishes, one dish was left as a normal control group, and the rest of the PC12 cells were treated with 200 μM of 6-OHDA, 2.5 mM of MPTP, and 80 μM of rotenone, and incubated for 24 h. After 24 h, the culture medium was discarded and washed twice with pre-cooled PBS to collect the cells, and then washed twice with pre-cooled PBS. After 24 h, the culture medium was discarded, the cells were washed twice with pre-cooled PBS, and the cells were collected by digestion and centrifugation at 1000 rpm for 5 min, and then washed twice with pre-cooled PBS. After 24 h, the cells were washed twice with pre-cooled PBS, digested by centrifugation at 1000 rpm for 5 min, and washed twice with pre-cooled PBS. 200 μL of protein lysate (RIPA: PMSF: Phosphatase Inhibitor = 100 : 1) was added to each group, and the cells were sonicated at 120 W for 10 s. The lysates were lysed for 20 min on ice.
H2O2 changes in cells with different treatments
To detect H2O2 changes in H2O2, 6-OHDA, MPTP, or ROT-stimulated Rat PC12 Phaeochromocytoma (PC12) cells, 60 μL of PB buffer (pH = 5, 0.25 M) was added to a 96-well plate. Then, 40 μL of PC12 cell protein supernatant treated with H2O2 (1 mM), 6-OHDA (200 μM), MPTP (2.5 mM), or ROT (80 μM), 12 μL of 30 mM TMB solution, and 8 μL of Z/Ce@hemin enzyme solution (100 µg/mL) were added sequentially. The reaction was performed for 5 min. The absorbance change was measured at 652 nm using a microplate reader.
Intracellular ROS imaging
PC12 cells with 6.5 ×10⁴ cells/well were inoculated into 24-well plates, and after the cells had grown to 80–90%, 6-OHDA (200 μM), MPTP (2.5 mM), Rot (80 μM), and H2O2 (1 mM) were added for modeling, and the cells were incubated in a 5% CO2 incubator at 37 °C for 24 h. The cells were incubated with 200 μL of DCFH-DA (10 μM) for 30 min at 37 °C. Changes in ROS were detected using inverted fluorescence microscope.
C. elegans methods
For C. elegans culture: Wild-type C. elegans Bristol (N2) strains were procured from the Caenorhabditis Genetics Center (University of Minnesota, Saint Paul, MN, USA). Nematodes were raised and handled in accordance with the designated protocol. According to established procedures, all worms were cultivated on nematode growth medium (NGM) agar plates without being overcrowded and seeded with strain OP50 of Escherichia coli at 20 °C.
For the preparation of nematode lysate: N2 worms with or without H2O2, 6-OHDA, MPTP, and ROT treatment were washed off the culture plate with M9 physiological saline, transferred to 15 mL centrifuge tubes, and centrifuged at 3000 rpm for 2 min. All worms were washed until the supernatant was clear, and then centrifuged to collect the pellet, and as much of the supernatant as possible was aspirated. Two times the volume of worm lysate was added, the lysate was prepared by adding 200 μL of NaCl (1 M), 50 μL of Tris-HCl (1 M), 20 μL of PMSF (100 mM), 200 μL of Na3VO4 (10 mM), 2 μg of Pepstain-A, 200 μL of NaF, 20 μL of Cocktail tables, 1060 μL of 0.5% NP-40, and 250 μL of EDTA. Magnetic beads were added, and the worms were broken by a tissue homogenizer (condition 10000 rpm, 10 min), the complete breakage was achieved by freezing the mixture for 30 min; After 30 min, the mixture was centrifuged at 4 °C at 12,000 rpm for 20 min, a new 1.5 mL centrifuge tube was used to collect the supernatant, and it was stored at −80 °C for later use.
H2O2 changes in C. elegans with different treatments
To examine H2O2 levels in PD nematode models induced by H2O2 (1 mM), 6-OHDA (50 mM), MPTP (20 mM) or ROT (8 μM), 60 μL of PB (pH = 5) buffer was added to a 96-well plate, and then 40 μL of nematode protein supernatant, 12 μL of TMB (30 mM) solution and 8 μL of Z/Ce@hemin enzymes (100 µg/mL) were added sequentially, and the reaction was carried out under the wavelength of 652 nm. After 5 min, the change in absorbance was measured at 652 nm using a microplate reader.
ROS imaging in C. elegans
Collect the contemporaneous N2 nematodes, centrifuge them at 3000 rpm for 1 min, wash them twice with M9, spread them onto NGM plates containing OP50, and collect them in five parts after 24 h. The Control and modeling concentrations were 6-OHDA (50 mM), MPTP (20 mM), Rotenone (8 μM) and H2O2 (1 mM). The nematodes of control and model groups were cleaned by centrifugation at 3000 rpm for 1 min with M9 buffer after 2 h. The nematodes of control and model groups were mixed a little in the incubator at 20 °C for 10 min until there was no color in the model group, and finally, the cleaned nematodes were spread onto the NGM plates. Then, the nematodes were fed with OP50 bacterial solution containing 150 μM DCFH-DA probe for 2 h, and the ROS within the nematode was observed under the inverted fluorescence microscope.
Results
Synthesis and characterization of Z/Ce@hemin enzymes
In this study, we strategically developed hemin-loaded ZIF-8-coated CeO2 nanoparticles (Z/Ce@hemin enzymes; Fig. 1a) to improve their catalytic performance. The process begins with the synthesis of CeO2 nanoparticles through a solvothermal method, which involves heating cerium(III) nitrate hexahydrate (Ce(NO3)3·6H2O) in a suitable solvent to facilitate the nucleation and growth of CeO2. The resulting CeO2 particles were approximately 21 ± 3 nm in size (Fig. 2a), with a zeta potential of approximately 29.5 mV (Fig. 2b). The ZIF-8 structure was then grown on the CeO2 surface through assembly using the ZIF-8 precursors zinc nitrate hexahydrate (Zn(NO3)2·6H2O) and 2-methylimidazole. The resulting Z/CeO2 composite materials were highly uniform, with a diameter of approximately 118.5 nm, as indicated by dynamic light scattering measurements (Fig. 2c). Additionally, the Z/CeO2 composites presented a characteristic UV‒visible absorption peak identical to that of pure CeO2, confirming the presence of CeO2 in the ZIF-8 framework (Fig. 2d and Supplementary Fig. 1). Finally, molecular hemin was loaded on the organic layer of the Z/CeO2 composites (with Z/Ce@hemin enzymes) via van der Waals forces and strong ligand binding between the ceria and carboxyl groups. Following modification, the Z/CeO2 composite dispersion shifted from transparent to a light brown color (Fig. 2e). The detection of a hemin absorption peak in the Z/Ce@hemin enzyme confirmed its successful incorporation into the Z/CeO2 composites (Fig. 2f). Transmission electron microscopy (TEM) images (Fig. 2a) revealed that the Z/Ce@hemin enzymes in hexamethylene were consistent in shape, appearing as nearly spherical particles with an average diameter of 60.2 ± 0.5 nm. With ZIF-8 modification and hemin loading, the zeta potentials of the material were approximately –29.2 and –25.4 eV, respectively (Fig. 2d). These results confirmed that hemin was successfully loaded onto the Z/CeO2 composites and that Z/Ce@hemin enzymes were obtained as expected.
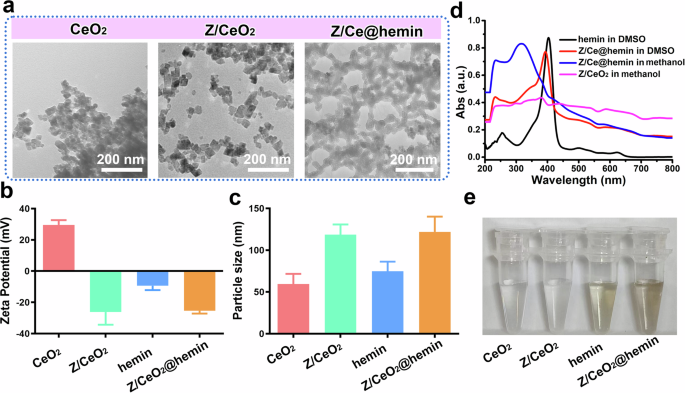
a TEM image of CeO2 NPs, Z/CeO2, and Z/Ce@hemin. Zeta potential (b) and hydrodynamic diameter (c) of CeO2 NPs, Z/CeO2, hemin and Z/Ce@hemin. d The UV–vis spectrum of the hemin, Z/CeO2 and Z/Ce@hemin. e Typical photographs of CeO2 NPs, Z/CeO2, hemin and Z/Ce@hemin dissolved in the aqueous solution or methanol (from left to right).
To optimize the loading efficiency of hemin onto the Z/CeO2 composites, different hemin-to-Z/CeO2 mass ratios, including 1:2, 1:1, 2:1, and 3:1, were evaluated. UV‒vis absorption spectra were used to calculate the hemin loading efficiencies (Supplementary Figs. 2 and 3), revealing a positive correlation between LEs and the feeding ratio of hemin-to-Z/CeO2 composites, thereby indicating that LEs ranging from 20.0 to 23.7% (Supplementary Table 1) were possible. The Z/Ce@hemin enzymes were synthesized at a feeding ratio of 2:1.
The stability of nanozymes plays a vital role in maintaining their activity. Following a seven-day incubation at pH 7.4 in DMEM (with and without 10% FBS), water, and phosphate-buffered saline (PBS), no precipitation was observed for the Z/Ce@hemin enzymes (Supplementary Fig. 4a, b). Additionally, Supplementary Fig. 4c–e show negligible changes in the hydrodynamic diameter and polydispersity index (PDI) of Z/Ce@hemin, indicating enhanced solubility and stability under physiological conditions. These findings suggest the potential suitability of Z/Ce@hemin for use in blood circulation and in vivo applications.
Peroxidase-like activity of the Z/Ce@hemin enzymes
The peroxidase-like catalytic function of Z/Ce@hemin enzymes was evaluated using the TMB-H2O2 reaction system39,40. In this system, peroxidase facilitates the oxidation of TMB in the presence of H2O2, generating a blue product with peak absorption at 652 nm41. The initial catalytic activity of the Z/Ce@hemin enzymes was assessed by their ability to oxidize TMB substrates in the presence of H2O2. This reaction results in a distinctive blue color that intensifies over time, showing maximum absorbance at both 369 and 652 nm (Fig. 3a and Supplementary Fig. 5). Notably, no oxidation occurred when only H2O2 or Z/CeO2 composites were introduced into the TMB solution, even at 652 nm (Fig. 3b). These observations strongly indicate that Z/Ce@hemin enzymes possess inherent peroxidase-like activity, and similar to horseradish peroxidase, both H2O2 and Z/Ce@hemin enzymes are essential for catalyzing the reaction.
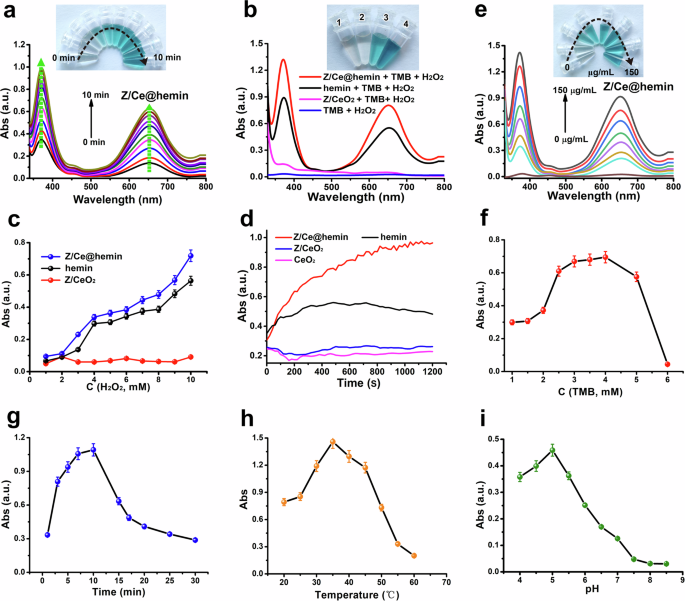
a Time-dependent UV–vis spectra illustrating the changes in the TMB-H2O2 system catalyzed by Z/Ce@hemin, with the inset displaying color variations of the solution over a 10-minute period. The H2O2 concentration used was 0.8 mM. b UV–vis absorption spectra for the TMB- H2O2 reaction in the presence of different catalysts over a duration of 10 min, accompanied by photographic images of the resulting colored products. c Comparison of the catalytic activities of hemin, Z/CeO2, and Z/Ce@hemin at various H2O2 concentrations. d Time-based absorbance measurements at 652 nm for reaction systems involving distinct catalysts and substrates. e Absorbance changes in a solution containing 10 mM H2O2 and 3 mM TMB at varying Z/Ce@hemin concentrations. Analysis of the influence of TMB concentration (f), reaction time (g), temperature (h), and pH (i) on the peroxidase-like activity of Z/Ce@hemin in TMB oxidation.
Tests were conducted using hemin alone or Z/CeO2 composites functionalized with hemin to evaluate the response of the TMB-H2O2 system. Hemin serves as the active site of peroxidase and shares similar catalytic properties with peroxidase itself42. As shown in Fig. 3c, both the hemin and Z/Ce@hemin enzymes demonstrated inherent peroxidase-like activity. Figure 3d further presents a comparative analysis of the catalytic kinetic behavior of the TMB-H2O2 system in the presence of either hemin or Z/CeO2 composites. The findings revealed that the Z/Ce@hemin enzymes were significantly enriched by both hemin and the Z/CeO2 composites. When identical concentrations were added, the TMB absorbance at 652 nm decreased in the sequence of Z/Ce@hemin > hemin > Z/CeO2 composites, confirming that Z/Ce@hemin exhibited the highest catalytic efficiency. The rate of the TMB-H2O2 reaction progressively increased as the Z/Ce@hemin concentration increased from 0 to 150 µg/mL (Fig. 3e), indicating a concentration-dependent reaction. In addition, the specific activity of the Z/Ce@hemin was calculated to be 1.679 U/mg via using the nanozyme activity standardization method (Supplementary Fig. 6)43. Thus, the elevated catalytic performance of the Z/Ce@hemin enzymes is attributed to the synergistic interaction between hemin and the composites. All of the above results demonstrated that the peroxidase activity of hemin was indeed enhanced after being loaded on the Z/CeO2 composites.
Optimizing the reaction condition of H2O2 and TMB catalyzed by the Z/Ce@hemin enzymes
To increase the catalytic efficiency of the Z/Ce@hemin enzymes, key factors such as the TMB concentration, reaction duration, pH, and temperature were systematically optimized. Initially, the ideal TMB concentration was found to be 4 mM (Fig. 3f). The enzyme activity was notably affected by pH and temperature, similar to that of HRP and the NP-based peroxidase analogs. Higher catalyst amounts and extended reaction times led to improved catalytic performance. After 10 min, a decrease in activity was observed following an initial increase (Fig. 3g). According to prior studies, HRP activity significantly decreases when incubated at pH values below 4.0 or temperatures above 50 °C44. In contrast, the Z/Ce@hemin enzymes maintained robust catalytic activity across a broader pH range (4.0–7.0) and temperature range (20–55 °C), indicating their adaptability to challenging conditions due to their stable structure (Fig. 3h, i)45. The optimal conditions for this experiment were a TMB concentration of 4 mM, a reaction time of 10 min, a temperature of 35 °C, and a pH of 5.0.
Steady–state kinetic study of the Z/Ce@hemin enzymes
To determine the kinetic parameters of the Z/Ce@hemin enzymes, steady–state kinetics experiments were conducted by varying the H2O2 and TMB concentrations while keeping the enzyme concentration constant. The initial reaction rate (V0) was derived from the absorbance-time plots using the Beer–Lambert law, with the molar absorption coefficient of ox-TMB being 39,000 M−1•cm−143,46. From the Michaelis–Menten equation and Lineweaver–Burk analysis presented in Fig. 4a–d and Supplementary Fig. 7, key catalytic parameters, including Vmax and Km, were ascertained47. As depicted in Supplementary Table 2, the Z/Ce@hemin enzyme exhibited a lower Km value (2.3 mM) for TMB than hemin did, indicating a stronger affinity for the substrate. Furthermore, the turnover number (Kcat), which was calculated from the Vmax and enzyme concentration, was higher for Z/Ce@hemin than for hemin. The Kcat/Km ratio serves as an indicator of catalytic efficiency toward specific substrates48. Compared with free hemin, Z/Ce@hemin displayed a significantly higher Kcat/Km value of 270 M−1•S−1, which was 2.78 times greater than that of free hemin. These findings suggest that Z/CeO2 composites, which act as immobilization supports, significantly increase the catalytic efficiency of hemin for TMB oxidation by increasing its substrate affinity. Moreover, the Z/CeO2 composites prevent hemin dimerization, anchoring the hemin monomers onto the surface, thereby providing numerous active binding sites for TMB.
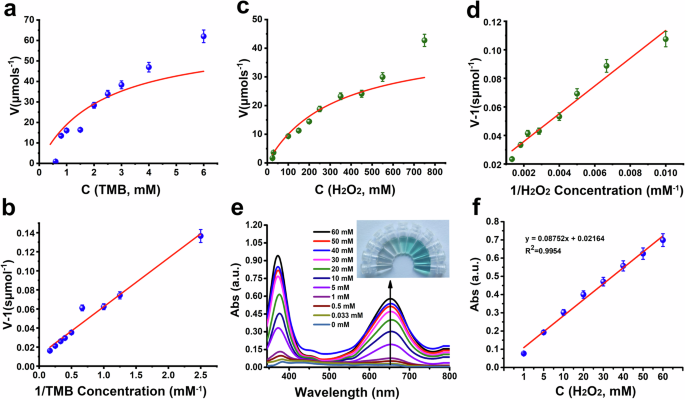
a Lineweaver–Burk plots for Z/Ce@hemin at a fixed concentration of 4 mM TMB versus varying concentrations of H2O2. b Lineweaver–Burk plots for Z/Ce@hemin at a fixed concentration of 1 M H2O2 versus varying concentrations of TMB. c, d Michaelis–Menten curves. e UV–vis spectra of TMB oxidation in the presence of a variable amount of H2O2. f Linear calibration plot for H2O2 detection.
H2O2 detection
The sensitivity of the suggested label-free colorimetric technique for H2O2 detection was assessed under the aforementioned optimum conditions. After various H2O2 concentrations were examined, a typical H2O2-concentration-dependent curve for the change in absorbance at 652 nm was obtained, as shown in Fig. 4e. The absorbance increased with increasing H2O2 concentration. Figure 4f shows a strong linear correlation between the H2O2 concentration from 1 to 60 mM and absorption intensity. Three times the standard deviation correlating with the detection limit of the blank samples yielded an estimated detection limit of 1.3 μM. The sensitivity of the proposed label-free colorimetric method for H2O2 detection was evaluated under the previously determined optimal conditions. After different H2O2 concentrations were tested, a typical concentration-dependent absorbance curve at 652 nm was obtained, as shown in Fig. 4e, revealing that the absorbance increased proportionally with increasing H2O2 concentration. Figure 4f clearly shows a linear relationship between the H2O2 concentration and absorbance intensity within the range of 1–60 mM. Using three times the standard deviation of the blank samples, the detection limit was estimated to be 1.3 μM.
H2O2 determination in the PD cell model
Neurotoxin models, including 6-OHDA, MPTP, and ROT, have been widely used to establish animal models of PD. 6-OHDA, a hydroxylated derivative of dopamine, plays an important role in preclinical studies of PD. The unilateral injectable rotation model, which was codeveloped by Ungerstedt and Arbuthnott in 1970, has become one of the most widely used animal models of PD. When 6-OHDA enters neurons, it is catalyzed by monoamine oxidase-A (MAO-A) to form H2O2, resulting in oxidative stress and neuronal damage49,50. MPTP can easily cross the blood‒brain barrier to enter the central nervous system, inhibiting the activity of mitochondrial respiratory chain complex I, thereby blocking the electron transfer chain, reducing ATP production, and promoting H2O2 production51,52. ROT, a high-affinity inhibitor of complex I of the mitochondrial electron transfer chain that induces ROS generation in vitro, is an inductive agent that regulates H2O2 concentrations in cells53,54. The common feature of these molecules is the promotion of H2O2 production, which ultimately causes neuronal damage. Therefore, the development of a sensitive and rapid method to detect H2O2 is needed to accurately evaluate the effects of the PD model.
Compared with those in the PBS group, when the 6-OHDA-treated lysates were incubated with the Z/Ce@hemin enzyme-based system, the solution immediately transitioned to dark blue during the TMB colorimetric reaction. Similarly, cell lysates treated with MPTP and ROT reacted with the Z/Ce@hemin enzymes to generate a blue solution (Fig. 5a). Further quantitative detection using a microplate reader revealed that 6-OHDA, MPTP, and ROT induced different levels of H2O2 production in the cells, and the trend was 6-OHDA (200 μM) > MPTP (2.5 mM) > ROT (80 μM) > H2O2 (1 mM) (Fig. 5b). These results suggest that 6-OHDA increases H2O2 production in PD cell models. To validate our results, a widely used commercial ROS fluorescent probe, DCFH-DA, was used to measure H2O2 levels in different PD cell models. DCFH-DA itself is not fluorescent, and intracellular ROS can oxidize it to fluorescent DCF55. As expected, the DCFH-DA results revealed strong green fluorescence of ROS in H2O2, 6-OHDA, MPTP, and ROT (Fig. 5c). However, the quantitative results revealed that the strongest fluorescence intensity was observed in the 6-OHDA group (Fig. 5d), indicating that H2O2 increased significantly after 6-OHDA treatment, which is consistent with the results of our method.
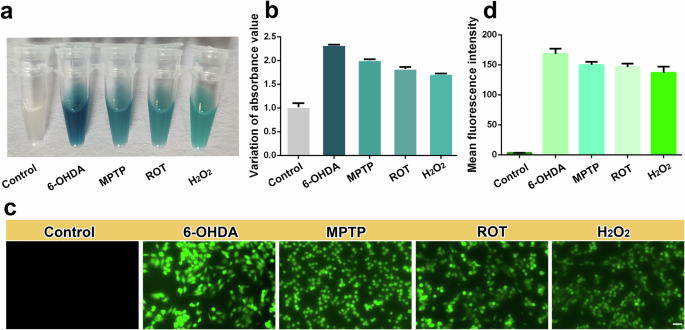
a Typical photographs of PC12 cell lysate with different treatment in Z/Ce@hemin sensing system. b The absorbance of the Z/Ce@hemin sensing system is shown in response to the PC12 cells with different treatment. c ROS was labeled by DCFH-DA and ROS levels were detected by immunofluorescence. Scale bar: 100 μm. d Fluorescence intensity was quantified.
H2O2 determination in the PD nematode model
C. elegans contains 302 neurons with well-mapped electron micrographs that have been widely used in the study of neurodegenerative diseases, including PD, because of the following characteristics: (i) The life cycle of nematodes is short, and they develop rapidly from eggs to adults in a short time. (ii) The nematode’s body is transparent, making it easy to observe under a microscope. (iii) Nematodes are small, with a body length of 1 mm, which is suitable for mass culture and operation under laboratory conditions56. In this study, Z/Ce@hemin enzymes combined with a TMB colorimetric reaction were used to monitor the H2O2 production level induced by 6-OHDA, MPTP, or ROT in nematodes. As shown in Fig. 6a, 6-OHDA, MPTP, or ROT caused the color of the solution containing Z/Ce@hemin enzymes and TMB to turn blue, and the 6-OHDA group presented the greatest absorbance. These results are consistent with those of the cell experiments, which revealed that the H2O2 concentration was highest in the 6-OHDA-induced PD model (Fig. 6b). Additionally, the highest H2O2 production level was detected in the 6-OHDA nematodes using the DCFH-DA probe (Fig. 6c).
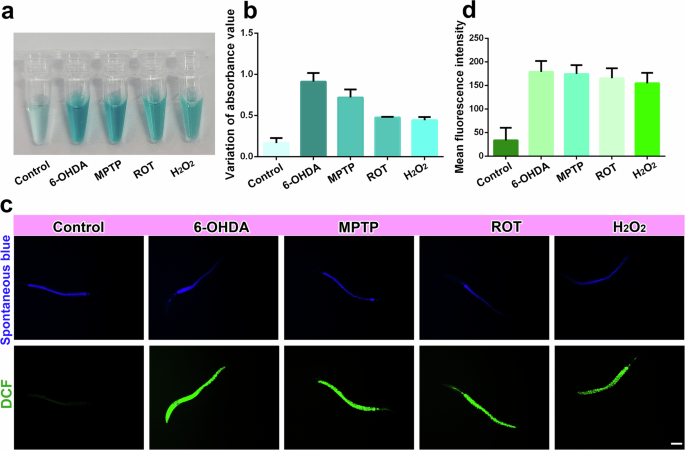
a Typical photographs of Bristol N2 nematodes lysate with different treatment in Z/Ce@hemin sensing system. b The absorbance of the Z/Ce@hemin sensing system is shown in response to the Bristol N2 nematodes with different treatment. c Fluorescence images of ROS in different-treated Bristol N2 nematodes, and stained with DCFH-DA, scale bar = 200 nm. d Fluorescence intensity was quantified.
Discussion
In summary, an artificial enzyme using Ce/hemin composites was developed by loading hemin onto ZIF-8-modified CeO2 nanoparticles through hydrophobic and electrostatic interactions. The Z/Ce@hemin enzymes demonstrated improved peroxidase-like activity, which was attributed to the prevention of hemin dimerization by the Z/CeO2 carriers, as well as enhanced substrate affinity and mass transfer. Additionally, these enzymes exhibited remarkable stability. Using these properties, a colorimetric assay for H2O2 detection was created by integrating Z/Ce@hemin with the TMB-H2O2 chromogenic system. The assay displayed a linear detection range of 1–60 mM and a LOD of 1.3 μM. Owing to its high sensitivity and selectivity, this method was successfully employed to detect H2O2 in 6-OHDA-, MPTP-, and ROT-induced PD cell and C. elegans models, which showed excellent biocompatibility. This approach offers researchers a valuable tool for developing and evaluating oxidative stress models for PD.
Responses