Preclinical and clinical study on type 3 metabotropic glutamate receptors in Parkinson’s disease
Introduction
Metabotropic glutamate (mGlu) receptors, which are glutamate receptors coupled to G proteins, have been consistently linked to the pathophysiology of Parkinson’s disease (PD). For example, genetic deletion/pharmacological blockade of mGlu5 receptors, or pharmacological activation of mGlu4 receptors show protective activity in the 1-methyl-4-phenyl-1,2,3,6-tetrahydropyridine (MPTP) model of parkinsonism1,2,3,4,5. In addition, selective negative allosteric modulators of mGlu5 receptors have been clinically developed for the treatment of L-DOPA-induced dyskinesias (LIDs), with contrasting results6. There are only a few studies on mGlu3 receptors in preclinical models of parkinsonism, and no studies on genetic variants of GRM3 (the gene encoding mGlu3 receptor) in patients affected by PD. GRM3 variants have been consistently associated with schizophrenia and bipolar disorder7,8.
What makes the mGlu3 receptors an attractive therapeutic target is its pleiotropic action at the tetrapartite synapse. The mGlu3 receptor belongs to group-II mGlu receptors, which also includes the mGlu2 receptor. Both receptor subtypes are coupled to Gi/o proteins, and their activation restrains glutamate release from axon terminals9. The mGlu3 receptor is also localized in post-synaptic elements, where it functionally associates with the mGlu5 receptor, boosting mGlu5 receptor signalling10. This form of receptor-receptor interaction is involved in mechanisms of activity-dependent synaptic plasticity11,12. In astrocytes, activation of mGlu3 receptors enhances the production of transforming-growth factor-β (TGF-β) and glial cell line derived neurotrophic factor (GDNF)13,14, two neurotrophic factors that act in concert to protect nigro-striatal dopaminergic neurons against MPTP toxicity15. mGlu3 receptors are also expressed in microglia, and their activation drives microglial cells towards an anti-inflammatory phenotype in an animal model of perinatal brain injury16. This function, if confirmed, might be relevant to the treatment of PD because microglia-mediated neuroinflammation plays a key role in the pathophysiology of PD and MPTP-induced parkinsonism17,18,19,20,21.
The current treatment of PD is suboptimal, and there are no drugs that slow the progression of the disease, and correct maladaptive changes in synaptic plasticity observed in PD and underlying long-term complications of L-DOPA treatment22,23,24. Thus, the identification of new therapeutic targets in PD is an urgent medical need.
The multifaceted role of mGlu3 receptors in mechanisms of neurodegeneration/neuroprotection and in the regulation of synaptic plasticity suggested to perform a genetic study in mice challenged with MPTP and in a large cohort of patients affected by PD compared to healthy controls. Using the MPTP model of toxicological parkinsonism, we examined whether genetic deletion of mGlu3 receptors affects neurodegeneration and associated reactive gliosis and neuroinflammation. We also examined a large cohort of 723 PD patients compared to 826 healthy controls to establish whether genetic variants of GRM3 are associated with PD and with motor and non-motor signs of the disease. Finally, we examined whether excitability and plasticity of cortical motor areas were abnormal in a sub-cohort of patients selected on the basis of GRM3 gene variants.
Results
Genetic deletion of mGlu3 receptors amplifies nigro-striatal damage and neuroinflammation in the MPTP model of parkinsonism in mice
To examine whether endogenous activation of mGlu3 receptors could shape the vulnerability of the nigro-striatal system, we challenged mGlu3 receptor knockout (mGlu3−/−) and mGlu2 receptor knockout (mGlu2−/−) mice, or their wild-type counterparts, with the parkinsonian toxin, MPTP. We used a model based on repeated administrations of low doses of MPTP, which causes a progressive degeneration of nigro-striatal dopaminergic neurons. To set up the model we first injected mice with 20 mg/kg MPTP every other day for 1 month, expecting <20% loss of neurons in the Substantia Nigra pars compacta (SNpc), and a more substantial reduction of dopamine (DA) levels in the striatum25. However, under our experimental conditions, this treatment caused a severe damage of the nigro-striatal system and the mortality of 40% of the animals. We therefore lowered the dose and exposure time, treating mice with 10 mg/kg every other day for 8 days, followed by 2 days of withdrawal. The experimental protocol is illustrated in Fig. 1A. In wild-type mice, MPTP treatment caused a 60–65% reduction of DA and approximately 50% reduction of 3,4-dihydroxyphenylacetic acid (DOPAC) levels in the striatum (Fig. 1B, C), and a 22 and 30% loss in the absolute number of tyrosine hydroxylase-positive (TH+) and Nissl-stained neurons in the SNpc, respectively, as shown by stereological cell counting (Fig. 1D, F). MPTP-induced nigro-striatal damage was amplified in mGlu3−/− mice and attenuated in mGlu2−/− mice (Fig. 1B–F). Treatment with MPTP increased the density of cells expressing CD11b (a surface marker of macrophages and activated microglia) in the SNpc of wild-type mice (Fig. 2A, B). The increased was amplified in mGlu3−/− mice challenged with MPTP. Genetic deletion of mGlu3 receptors also enhanced reactive gliosis (i.e., the density of GFAP-expressing cells bearing a stellate morphology) in the striatum of MPTP-treated mice (Supplementary Fig. 1). Using our experimental conditions, we did not observe a significant impairment in spontaneous motor behavior (open field test), motor function and coordination (pole and rotarod tests), muscle strength (paw grip endurance—PaGE—test), and cognitive function (Novel Object Recognition—NOR—test) in response to MPTP in wild-type and mGlu3−/− mice. In the pole test, mGlu3−/− mice showed a significant reduction in the time to climb down at 5 days after the last injection of either saline or MPTP (Supplementary Fig. 2).
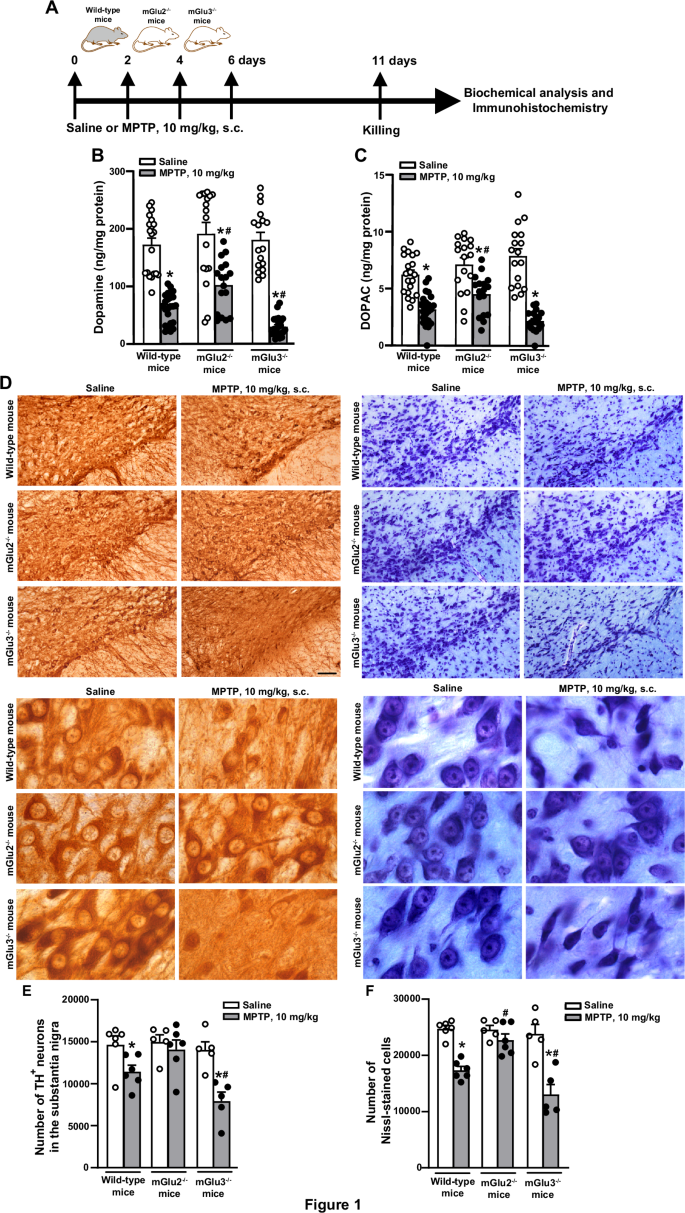
An illustration of the experimental protocol is shown in (A); DA and DOPAC levels in the striatum of wild-type, mGlu2−/− or mGlu3−/− treated with saline or MPTP (10 mg/kg, s.c., every other day) is shown in (B) and (C), respectively. Values are means + S.E.M. Number of mice per group: wild-type saline = 20 for DA and DOPAC; wild-type MPTP = 24 for DA and DOPAC; mGlu2−/− saline or MPTP = 17 for DA and DOPAC; mGlu3−/− saline = 17 for DA and DOPAC; mGlu3−/− MPTP = 22 for DA and 19 for DOPAC. Significant difference vs. the respective groups treated with saline (*) or vs. wild-type mice treated with MPTP (#). Two-way ANOVA + Fisher LSD). DA levels: genotype, F2,111 = 7.333; p = 0.001; treatment, F1,111 = 176; p = <0.001; interaction, F2,111 = 4.083; p = 0.019. Wild-type, MPTP vs. saline, p < 0.001; mGlu2−/−, MPTP vs. saline, p < 0.001; mGlu3−/−, MPTP vs. mGlu3−/− saline, p < 0.001; mGlu2−/− MPTP vs. wild-type MPTP, p = 0.01; mGlu3−/− MPTP vs. wild-type MPTP, p = 0.019; mGlu2−/− MPTP vs. mGlu3−/− MPTP, p < 0.001; DOPAC levels: genotype, F2,108 = 3.658; p = 0.029; treatment, F1,108 = 119.2; p = <0.001; interaction, F2,108 = 7.52; p = <0.001; Wild-type, MPTP vs. saline, p < 0.001; mGlu2−/−, MPTP vs. saline, p < 0.001; mGlu3−/−, MPTP vs. saline, p < 0.001; mGlu2−/− MPTP vs. wild-type MPTP, p = 0.023; mGlu3−/− MPTP vs. wild-type MPTP, p = 0.08; mGlu2−/− MPTP vs. mGlu3−/− MPTP, p < 0.001. Representative images of TH+ and Nissl-stained cells in the SNpc at low and high magnifications are shown in (D). Stereological cell counting of TH+ and Nissl-stained neurons in the SNpc of wild-type, mGlu2−/− or mGlu3−/− treated with saline or MPTP is shown in (E) and (F), respectively, where values are means + S.E.M. Number of mice per group: wild-type saline or MPTP = 6; mGlu2−/− = 5 for saline and 6 for MPTP; mGlu3−/− saline or MPTP = 5. Significant difference vs. the respective groups treated with saline (*) or vs. wild-type mice treated with MPTP (#) (Two-way ANOVA + Fisher LSD); TH+ cells: genotype, F2,27 = 6.072; p = 0.007; treatment, F2,27 = 17.45; p < 0.001; interaction, F2,27 = 3.23; p = 0.05. Wild-type, MPTP vs. saline, p = 0.025; mGlu2−/−, MPTP vs. saline, p = 0.522; mGlu3−/−, MPTP vs. saline, p < 0.001; mGlu2−/− MPTP vs. wild-type MPTP, p = 0.062; mGlu3−/− MPTP vs. wild-type MPTP, p = 0.019; mGlu2−/− MPTP vs. mGlu3−/− MPTP, p < 0.001. Nissl-stained cells: genotype, F2,27 = 10.02; p < 0.001; treatment, F2,27 = 51.58; p < 0.001; interaction, F2,27 = 7.55; p = 0.002. Wild-type, MPTP vs. saline, p < 0.001; mGlu2−/−, MPTP vs. saline, p = 0.259; mGlu3−/−, MPTP vs. saline, p < 0.001; mGlu2−/− MPTP vs. wild-type MPTP, p = 0.002; mGlu3−/− MPTP vs. wild-type MPTP, p = 0.013; mGlu2−/− MPTP vs. mGlu3−/− MPTP, p < 0.001.
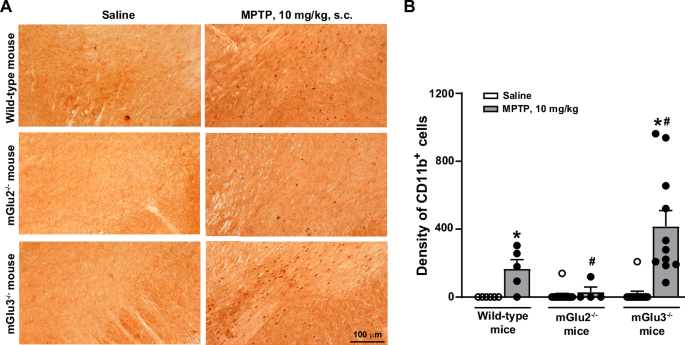
Representative images of CD11b+ cells in the SNpc of the three genotypes are shown in (A). Cell density is shown in (B) where values are means + S.E.M. Number of mice per group: wild-type saline and MPTP = 5; mGlu2−/− saline = 13; mGlu2−/− MPTP = 4; mGlu3−/− saline = 12; mGlu3−/− MPTP = 11. Significant difference vs. the respective saline (*) or vs. wild-type mice treated with MPTP (#). Two-way ANOVA + Fisher LSD; genotype, F2,44 = 6.918; p = 0.002; treatment, F1,44 = 15.334; p < 0.001; interaction, F2,44 = 6.229; p = 0.004. Wild-type, MPTP vs. saline, p = 0.102; mGlu2−/−, MPTP vs. saline, p = 0.833; mGlu3−/−, MPTP vs. saline, p < 0.001; mGlu2−/− MPTP vs. wild-type MPTP, p = 0.202; mGlu3−/− MPTP vs. wild-type MPTP, p = 0.005; mGlu2−/− MPTP vs. mGlu3−/− MPTP, p < 0.001.
Using the protocol of 10 mg/kg MPTP, we measured the transcripts encoding (i) pro- and anti-inflammatory cytokines, (ii) molecular markers of activated microglia, and (iii) neuroprotective factors in the striatum of the three genotypes. Expression of the anti-inflammatory genes, Il4, Il4ra, and Mrc1, encoding IL-4, the α subunit of IL-4 receptor, and mannose receptor C-type 1, respectively, were largely reduced in the striatum of mGlu3−/− mice challenged with MPTP, as compared to wild-type mice treated with MPTP (Il4ra, Mrc1), to mGlu3−/− mice treated with saline (Il4, Il4ra), or to mGlu2−/− mice treated with saline or MPTP (Il4, Il4ea, Mrc1). Expression of the Trem2 gene encoding the homonymous anti-inflammatory protein expressed by macrophages and microglia, and Arg1, encoding arginase 1, was reduced in mGlu3−/− mice treated with either saline or MPTP, compared to all other groups (Trem2), or to wild-type mice treated with MPTP (Arg1). Expression of the Il13 gene, encoding the homonymous anti-inflammatory protein, was reduced in mGlu3−/− mice treated with MPTP with respect to mGlu3−/− mice treated with saline, whereas expression of Socs1 and Socs3, encoding the suppressors of cytokine signaling, SOCS1 and -3, were unchanged in the striatum of mGlu3−/− mice challenged with MPTP (Fig. 3A). Treatment of mGlu2−/− mice with MPTP did not cause changes in the expression of any anti-inflammatory genes with respect to mGlu2−/− treated with saline (Fig. 3A).
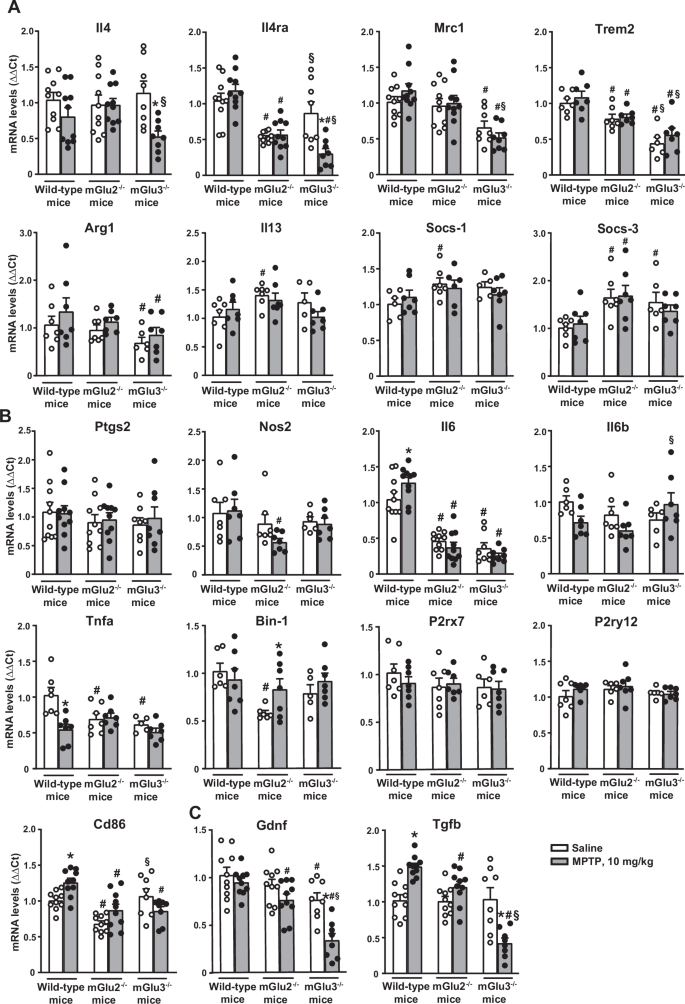
mRNA levels were normalized by levels of the housekeeping (either β-actin or GAPDH) and analysed by ΔΔCt using as reference values those obtained in wild-type mice treated with saline. Values are means + S.E.M. of 6-10 mice per group. p < 0.05 vs. the respective groups treated with saline (*), vs. the respective values of wild-type mice (#), or vs. the respective values of mGlu2−/− mice (§) (Two-way ANOVA + Fisher’s LSD). Anti-inflammatory markers (A): Il-4: genotype, F2,50 = 0.694; p < 0.504; treatment: F1,50 = 8.741; p = 0.005; interaction: F2,50 = 3.26; p = 0.046. Il4ra: genotype, F2,50 = 27.307; p < 0.001; treatment: F1,50 = 3.25; p = 0.077; interaction: F2,50 = 8.84; p = 0.01. Mrc1: genotype, F2,50 = 17.167; p < 0.001; treatment: F1,50 = 0.059; p = 0.809; interaction: F2,50 = 1.405; p = 0.255. Trem2: genotype, F2,35 = 28.88; p < 0.0001; treatment: F1,35 = 1.538; p = 0.223; interaction: F2,35 = 0.217; p = 0.806. Arg-1: genotype, F2,35 = 3.425; p = 0.0438; treatment: F1,35 = 2.215; p = 0.145; interaction: F2,35 = 0.064; p = 0.938. Il13: genotype, F2,34 = 3.431; p = 0.0439; treatment: F1,34 = 0.576; p = 0.453; interaction: F2,34 = 1.532; p = 0.231. Socs-1: genotype, F2,32 = 2.73; p = 0.0804; treatment: F1,32 = 0.102; p = 0.752; interaction: F2,32 = 0.704; p = 0502. Socs-3: genotype, F2,35 = 7.811; p = 0.0016; treatment: F1,35 = 0.0235; p = 0.879; interaction: F2,35 = 0.403; p = 0.671. Pro-inflammatory markers (B): Ptgs2: genotype, F2,50 = 0.761; p = 0.473; treatment: F1,50 = 157; p = 0.694; interaction: F2,50 = 0.12; p = 0.887. Nos2: genotype, F2,35 = 3.56; p = 0.039; treatment: F1,35 = 0.877; p = 0.355; interaction: F2,35 = 0.949; p = 0.397. Il-6: genotype, F2,50 = 87.78; p < 0.001; treatment: F1,50 = 0.042; p = 0.837; interaction: F2,50 = 3.684; p = 0.032. Il-1b: genotype, F2,34 = 1.391; p = 0.263; treatment: F1,34 = 1.325; p = 0.258; interaction: F2,34 = 3.386; p = 0.046. Tnfa: genotype, F2,34 = 4.377; p = 0.0204; treatment: F1,34 = 9.687; p = 0.0037; interaction: F2,34 = 6.599; p = 0.0038Bin 1: genotype, F2,35 = 5.323; p = 0.0096; treatment: F1,35 = 1.916; p = 0.175; interaction: F2,35 = 1.974; p = 0.154. P2rx7: genotype, F2,35 = 1.152; p = 0.3276; treatment: F1,35 = 0.2736; p = 0.604; interaction: F2,35 = 0.4779; p = 0.624. P2ry12: genotype, F2,34 = 1.413; p = 0.2572; treatment: F1,34 = 1.073; p = 0.308; interaction: F2,34 = 0.5925; p = 0.5585; Cd86: genotype, F2,50 = 16.102; p < 0.001; treatment: F1,50 = 2.136; p = 0.15; interaction: F2,50 = 6.79; p = 0.002. Trophic factors (C): Gdnf: genotype, F2,50 = 21.573; p < 0.001; treatment: F1,50 = 16.384; p < 0.001; interaction: F2,50 = 3.565; p = 0.036. Tgfb: genotype, F2,50 = 19.467; p < 0.001; treatment: F1,50 = 0.0625; p = 0.804; interaction: F2,50 = 20.95; p < 0.001.
MPTP treatment in mGlu3−/− mice did not change the levels of transcripts encoding pro-inflammatory genes (Ptgs2 encoding type-2 cyclooxygenase, Nos2 encoding inducible nitric oxide synthase, Il6, Il1b, and Tnfa encoding the pro-inflammatory cytokines IL-6, IL-1β, and TNF-α, respectively, Bin1 encoding the pro-inflammatory microglial marker, BIN1, and P2rx7 and P2ry12 encoding the microglial P2X7 and P2Y12 receptors, respectively) in the striatum. We observed only a small reduction in the expression of Cd86 gene encoding the macrophage/microglial marker, CD86, in the striatum of mGlu3−/− mice treated with MPTP compared to the same genotype treated with saline (Fig. 3B). Treatment of mGlu2−/− mice with MPTP caused a significant increase in Bin1 expression and a decrease in Nos2 expression with respect to the same genotype treated with saline, leaving all other pro-inflammatory genes unchanged (Fig. 3B).
We also measured the expression of Gdnf gene encoding GDNF and Tgfb encoding TGF-β, two neurotrophic factors that act synergistically in protecting nigro-striatal neurons against MPTP toxicity15. Interestingly, GDNF and TGF-β mRNA levels were largely reduced in the striatum of mGlu3−/− mice treated with MPTP with respect to all other groups of mice. Unexpectedly, MPTP treatment enhanced TGF-β levels in wild-type mice (Fig. 3C).
Analysis of GRM3 variants and their association with phenotypic disease traits
We found that two GRM3 gene haplotypes (see Fig. 4C) were significantly associated with PD in the whole cohort of patients (723 PD and 826 healthy controls). In the first haplotype, variants were rs1527768 (G > A), rs187993 (G > T), rs274622 (T > C), and rs724226 (G > A), while rs1989796, rs13242038, rs2228595, rs2237562, rs1468412 and rs6465084 were wild-type variants [OR 95% CI 1.87 (1.1–3.1); p-value 0.02]. In the second haplotype, variants were rs1989796 (T > C), rs187993 (G > T), rs274622 (T > C), and rs724226 (G > A), while rs1527768, rs13242038, rs2228595, rs2237562, rs1468412 and rs6465084 were wild-type variants [OR 95% CI 2.17 (1.3-3.4); p-value 0.001]. No difference was found in age and gender distribution between PD patients with and without haplotypes, and between PD patients and healthy controls. One of the PD-linked haplotypes [rs1989796 (T > C), rs187993 (G > T), rs274622 (T > C), rs724226 (G > A)] was also associated with postural instability (Movement Disorder Society-Unified Parkinson’s Disease Rating Scale—MDS-UPDRS—3.12 > 0) [OR 95% CI 1.92 (1.10-3.34); p-value 0.021] (Supplementary Table 1).
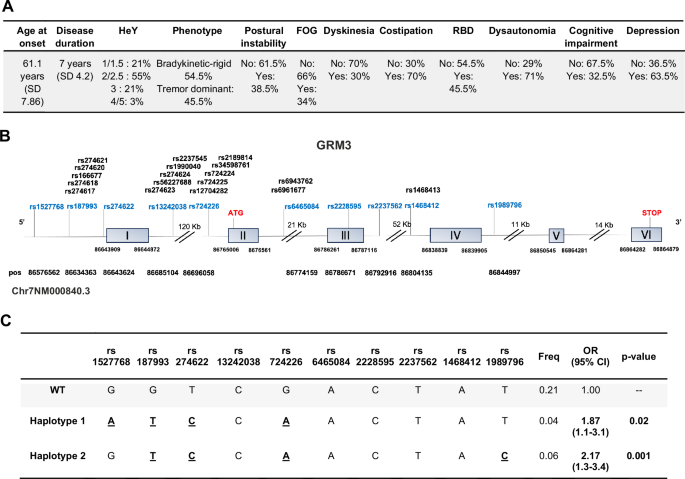
Motor and non-motor phenotypes of patients affected by PD are shown in (A); HeY = Hoehn and Yahr disease stage (from 1 to 5); RBD = rapid eye movement sleep behavioural disorder; FOG = freezing of gait. GRM3 gene structure (adapted from Ensambl) and position of polymorphic variants is shown in (B). The two haplotypes which were found to be significantly associated with PD (1 and 2) are shown in (C).
An age at onset ≥ 50 years was significantly associated with rs1527768 polymorphism [OR 95% CI 3.25 (1.16–9.09); p-value 0.008]. The tremor-like phenotype was significantly associated with rs274622 polymorphism [OR 95% CI 1.72 (1.02–2.89); p-value 0.039] (Fig. 5). There was no association between bradykinetic-rigid phenotype and GRM3 polymorphisms. Considering non-motor symptoms, rapid eye movement sleep behavioral disorder (RBD) was associated with rs1468413 polymorphism [OR 95% CI 0.31 (0.1–0.98); p-value 0.03]; a score greater than 54 of the Non-Motor Symptom Scale (NMSS) with rs6465084 polymorphism [OR 95% CI 2.05 (1.03–4.1); p-value 0.037]; cardiovascular symptoms (NMSS, domain 1) with rs13242038 [OR 95% CI 0.10 (0.01–0.73); p-value 0.001], rs6465084 [OR 95% CI 0.31 (0.12–0.81); p-value 0.0067], rs2237562 [OR 95% CI 0.38 (0.17–0.83); p-value 0.008], and rs1468412 polymorphisms [OR 95% CI 0.33 (0.15–0.76); p-value 0.0036]; sleep/fatigue (NMSS, domain 2) with rs1527768 [OR 95% CI 0.6 (0.42–0.86); p-value 0.004], and rs1468413 polymorphisms [OR 95% CI 0.21 (0.07–0.62); p-value 0.008]; attention/memory (NMSS, domain 5) with rs1989796 polymorphism [OR 95% CI 1.55 (1.07–2.26); p-value 0.02]; gastrointestinal symptoms (NMSS, domain 6) with rs1468413 polymorphism [OR 95% CI 0.32 (0.11–0.91); p-value 0.039]; urinary symptoms (NMSS, domain 7) with rs1468413 polymorphism [OR 95% CI 0.29 (0.1–0.83); p-value 0.031]; dysautonomia with rs1989796 polymorphism [OR 95% CI 0.29 (0.1–0.80); p-value 0.02] (Fig. 5). Two haplotypes reported in Supplementary Table 2, which were not linked to PD, were significantly associated with cognitive decline [assessed by Montreal Cognitive Assessment (MOCA) in patients affected by PD]. In the first haplotype the variants were rs1989796 (T > C) and rs2237562 (T > C), while rs13242038, rs1527768, rs187993, rs2228595, rs274622, rs724226, rs1468412 and rs6465084 were wild-type [OR 95% CI 2.60 (1.26–5.37); p-value 0.01]. In the second haplotype, variants were rs1989796 (T > C), while rs187993, rs274622, rs724226, rs1527768, rs13242038, rs2228595, rs2237562, rs1468412 and rs6465084 were wild-type [OR 95% CI 0.21 (0.05–0.94); p-value 0.042].
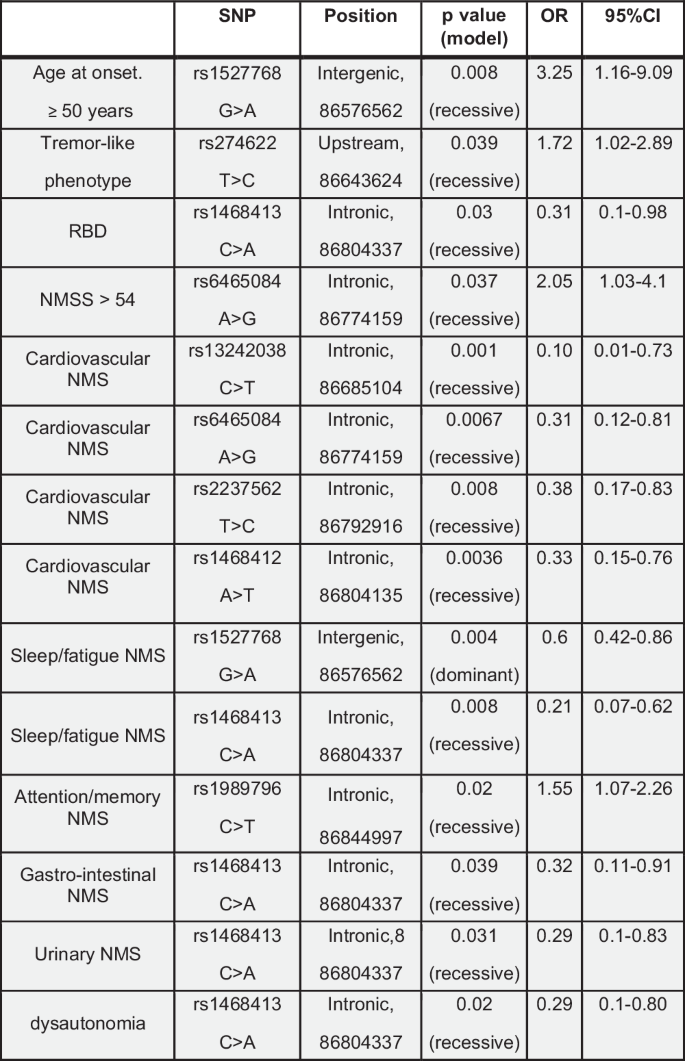
SNP single nucleotide polymorphism, RBD rapid eye movement sleep behavioural disorder, NMS non-motor symptoms, NMSS NMS scale.
PD patients with the haplotypes reported in Fig. 4C (haplotypes associated with the risk of developing PD) showed an association with NMSS [OR 95% CI 1.01 (1.001–1.02); p-value 0.02], gastrointestinal symptoms (NMSS, domain 6) [OR 95% CI 1.08 (1.02–1.15); p-value 0.006] and cognitive functions evaluated through the MOCA [OR 95% CI 0.85 (0.77–0.93); p-value 0.004] compared to PD patients without haplotypes.
In the subset of patients and healthy controls for whom whole-exome sequencing (WES) data were available, the rs166677 polymorphism was significantly associated with PD [OR 95% CI 1.54 (1.06–2.23); p-value 0.02] (Fig. 6B).
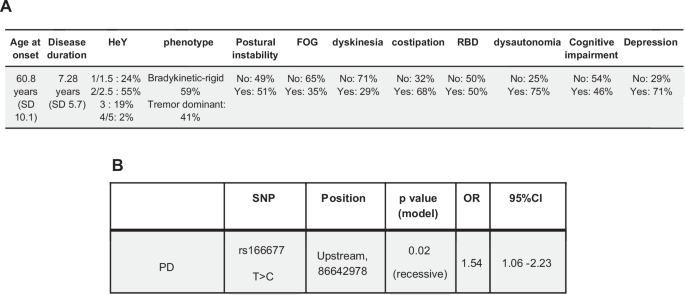
Motor and non-motor phenotypes of patients affected by PD available for WES analysis are shown in (A); HeY = Hoehn and Yahr disease stage (from 1 to 5); RBD rapid eye movement sleep behavioural disorder, FOG freezing of gait. The GRM3 variant significantly associated with PD in this cohort of patients is shown in (B).
Severity of motor symptoms with a score greater than 29 at the MDS-UPDRS III was associated with several polymorphisms in the intron region near exon 1. The most significant polymorphisms were rs274623 [OR 95% CI 1.97 (1.18–3.30); p-value 0.0091], rs274624 [OR 95% CI 1.97 (1.18–3.30); p-value 0.0091], rs1990040 [OR 95% CI 0.33 (0.14–0.77); p-value 0.005], rs724225 [OR 95% CI 1.97 (1.18–3.30); p-value 0.0091], rs2189814 [OR 95% CI 0.38 (0.16–0.91); p-value 0.019] (Fig. 7). Postural instability (MDS-UPDRS 3.12 > 0) was significantly associated with rs34598761 polymorphism [OR 95% CI 0.27 (0.11–0.66); p-value 0.0018], and dyskinesias with rs1990040 polymorphism [OR 95% CI 0.35 (0.13–0.94); p-value 0.021] (Fig. 7). Among non-motor symptoms, RBD was significantly associated with rs12704282 polymorphism [OR 95% CI 0.21 (0.04–0.98); p-value 0.024], cardiovascular symptoms (NMSS, domain 1) with rs166677 [OR 95% CI 0.48 (0.28–0.83); p-value 0.0085], sleep/fatigue (NMSS, domain 2) with rs56227688 [OR 95% CI 0.07 (0.01–0.78); p-value 0.029] and rs12704282 polymorphisms [OR 95% CI 0.15 (0.04–0.53); p-value 0.006], gastrointestinal symptoms (NMSS, domain 6) with rs6961677 [OR 95% CI 0.35 (0.14–0.87); p-value 0.0029], dysautonomia with rs6961677 [OR 95% CI 0.34 (0.14–0.84); p-value 0.023] (Fig. 7).
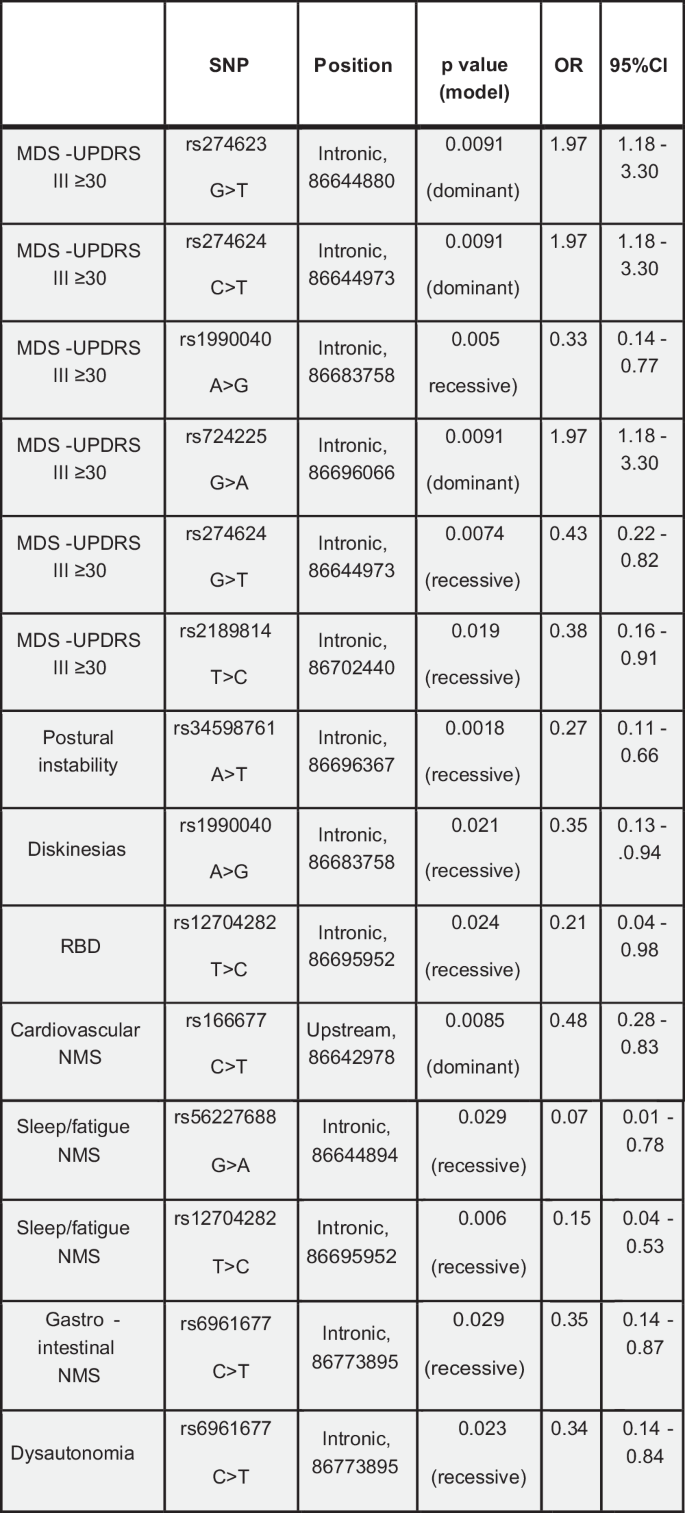
SNP single nucleotide polymorphism, MDS-UPDRS Movement Disorder Society – Unified Parkinson’s Disease Rating Scale, RBD rapid eye movement sleep behavioural disorder, NMS non-motor symptoms.
The at risk GRM3 variants in the 5’-UTR and the intronic region near exon-1, i.e., TT (rs274623), TT (rs274624), CC (rs274622), AA (rs724225), AA (rs724226), GG (rs1990040), were significantly associated with a reduced GRM3 gene expression in the human cerebellum and spinal cord (p < 0.001) (Supplementary Fig. 3). CC (rs274622) and AA (rs724226) variants were also associated with a trend to a reduction in GRM3 gene expression in the amygdala, frontal cortex BA9, hippocampus, and substantia nigra, and a trend to an increased expression in the hypothalamus, nucleus accumbens, and putamen (Supplementary Fig. 3).
Cortical excitability/plasticity in PD patients and healthy controls
No differences were found in age and sex distribution between PD patients with and without haplotypes, and between PD patients and healthy controls (p values > 0.05 in each case). Clinical evaluation showed that the disease duration (in years) in the two groups of patients was similar (7 ± 4.6 years in PD patients with haplotypes and 8 ± 4 years in PD patients without haplotypes). The mean score in the MDS-UPDRS part III scale was 32 ± 13.8 in patients with haplotypes, while the score in patients with wild-type genotype was slightly higher with a value of 38.4 ± 9, although the difference was not statistically significant (U = 32.5, p = 0.285). Additionally, no significant differences were found between the two groups in terms of MDS-UPDRS part IV, NMSS, MOCA, FAB, BDI, FSS scores (p values ranging from 0.2 to 0.95). No significant differences were detected in terms of pharmacological therapy, with comparable levels of L-DOPA equivalent daily dose (LEDD) between PD carrying the haplotypes and PD with the wild-type genotype (520 ± 367.58 mg vs 570 ± 280.57 mg; U = 36, p = 0.331).
Concerning the parameters of transcranial magnetic stimulation (TMS), motor thresholds (i.e., resting and active motor thresholds), input/output curve (M1 excitability), short-interval intracortical inhibition (SICI) and intracortical facilitation (ICF) were unchanged in PD patients with respect to healthy controls, and did not differ between the two groups of PD patients (p values > 0.05 in each case) (Supplementary Fig. 4).
In contrast, healthy controls and the two groups of PD patients differed in M1 plasticity, reflected by changes in motor evoked potentials (MEPs) induced by a paired associated stimulation (PAS) protocol. Statistical analysis with the Kruskal Wallis test (H(2) = 15.295, p = <0.001) followed by post-hoc comparisons showed that MEP amplitude was significantly reduced at T2 in PD patients with haplotypes compared to patients with the wild-type genotype (U = 14.4, p = 0.013) and healthy controls (U = −15.127, p = 0.001). MEP amplitude showed a trend to an increase in PD patients with the wild-type genotype compared to healthy controls in T0 and T2 (Fig. 8).
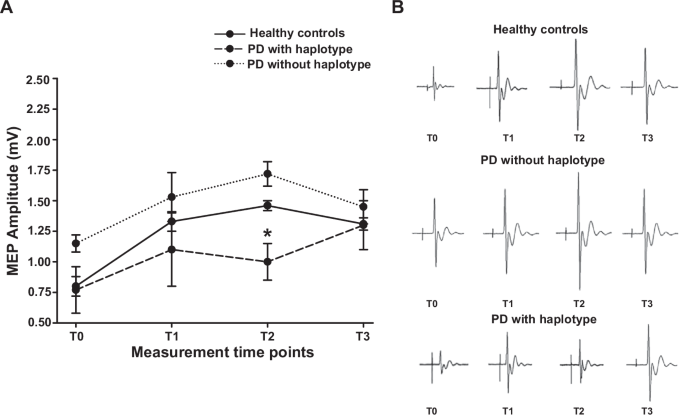
(A) Course of MEPs after the PAS protocol in the abductor pollicis brevis in PD patients without the haplotypes (dotted line); in PD patients with the haplotype (dashed line) and in healthy controls (solid line). The y-axis shows MEP amplitudes (mV). The x-axis shows measurements at the four time points: before PAS (T0) and 5 min (T1), 15 min (T2) and 30 min (T3) after PAS. A significantly reduced response after PAS was found in MEP recorded at T2 in PD carrying the haplotypes compared to PD with the wild-type genotype (U = 14.4, p = 0.013) and healthy controls (U = −15.127, p = 0.001). (B) Representative plots showing the MEP waveform in the three groups at the various time points.
Discussion
We have shown that (i) genetic deletion of mGlu3 receptors amplifies MPTP-induced nigro-striatal damage, enhances neuroinflammation, and reduces the production of neurotrophic factors in mice; (ii) genetic variants of GRM3 are associated with PD and show a significant correlation with motor and non-motor signs; and (iii) the plasticity of cortical motor areas in response to TMS is abnormal in patients carrying the GRM3 haplotype associated with PD.
Our findings suggest that mGlu3 receptors orchestrate a number of protective mechanisms that enhance the resilience of nigro-striatal neurons to environmental challenges, and that genetic variations of these receptors might contribute to the pathophysiology of PD.
The MPTP model in mice is widely used for the identification of cellular and trans-synaptic mechanisms that shape the vulnerability of nigro-striatal neurons to environmental toxins, and for the discovery of novel therapeutic targets for potential disease-modifying agents. MPTP is converted by type-B monoamine-oxidase into the active metabolite, 1-methyl-4-phenylpyridium ion (MPP+), which is taken up by the high affinity DA transporter, and kills dopaminergic neurons by inhibiting complex I of the mitochondrial respiratory chain26,27. Systemic administration of MPTP in mice results into neuroinflammation in the SNpc and dorsal striatum, which is driven by reactive astrocytes and microglia17. Mice challenged with MPTP have been extensively used for the study of neurotrophic factors, including members of the TGF-β superfamily (e.g., TGF-β1 and GDNF)17. GDNF administration via local injection or a lentiviral construct has shown robust protective activity against MPTP-induced nigro-striatal degeneration15,28,29,30,31, and the neuroprotective activity of GDNF requires the presence of TGF-β115,32. Interestingly, TGF-β and GDNF production is under the control of mGlu3 receptors13,14,33, and mediates the neuroprotective activity of mGlu3 receptors in cellular or animal models of neurodegenerative disorders4,34,35.
Using a sub-acute protocol of MPTP injection in mice, we showed here that the presence of mGlu3 receptors was necessary for the expression of genes encoding anti-inflammatory cytokines, TGF-β1, and GDNF, and that the lack of mGlu3 receptors amplified degeneration of nigro-striatal neurons, reactive gliosis, and microglial activation. Thus, mGlu3 receptors display multifaceted neuroprotection in models of parkinsonism, by restraining excitotoxicity9, enhancing the production of neurotrophic factors of the TGF-β superfamily (see above), and reducing neuroinflammation by driving microglia towards and an anti-inflammatory phenotype16. Our findings also support the hypothesis that mGlu3 and mGlu2 receptors differentially regulate mechanisms of neuroprotection36, and this cast doubts on the use of non-subtype-selective mGlu2/3 receptor ligands in models of neurodegenerative disorders. Using our paradigm of MPTP administration we could not detect a significant motor and cognitive impairment, perhaps because the extent of striatal DA loss and neuronal degeneration in the SNpc were below the threshold for behavioral impairment in both wild-type and mGlu3−/− mice.
We found that two GRM3 haplotypes significantly associated with PD, and correlated with the presence of postural instability and the severity of non-motor symptoms. In addition, we found a significant association between the PD-linked haplotypes and cognitive dysfunction evaluated by MOCA. Individual GRM3 variants were also associated with the severity of motor symptoms evaluated with MDS-UPDRS III, and non-motor symptoms including sleep disturbances, cognitive dysfunction and dysautonomic signs.
Data extracted from the GTEx portal indicated that some of the identified GRM3 polymorphisms were associated with changes in mGlu3 receptor expression in human brain or spinal cord. However, expression data were not homogenous in different brain regions, suggesting that gene variants differentially affect receptor expression depending on region-specific regulatory mechanisms. Four GRM3 gene variants present in the two haplotypes linked to PD (rs187993 G > T, rs274622 T > C, rs724226 G > A, and rs1989796 T > C) were associated with a reduced mGlu3 receptor expression in human CNS regions raising the possibility that mGlu3 receptors are down-regulated in the CNS of PD patients carrying each of the two haplotypes. GRM3 variants linked to the severity of motor signs (UPDRS part III scores > 30) (rs274623 G > T, rs274624 C > T, rs724225 G > A, rs1990040 A > G, and rs2189814 T > C) were consistently linked to a reduced mGlu3 receptor expression in the cerebellum and/or spinal cord, although rs274624 C > T was associated with an enhanced mGlu3 receptor expression in the nucleus accumbens. Some variants linked to non-motor symptoms of PD (rs166677 T > C, rs1989796 C > T) were also associated with changes in receptor expression in CNS tissue. Preclinical studies suggest a role for mGlu3 receptors in cognitive function and sleep regulation. Postsynaptic mGlu3 receptors boost mGlu5 receptor signaling and this form of receptor-receptor interaction is involved in the induction of long-term depression (LTD) of excitatory synaptic transmission in the medial prefrontal cortex10,11. mGlu3 receptor-dependent LTD underlies prefrontal cortex-dependent cognitive functions37,38, and individuals with GRM3 gene variants display a reduced performance in prefrontal cortex-dependent cognitive tasks39,40,41. Interestingly, the rs1989796 C > T variant linked to cognitive dysfunction was associated with a reduced expression of mGlu3 receptors in the frontal cortex (see Supplementary Fig. 3). Data obtained in mGlu2-lacking Han Wistar rats challenged with mGlu2/3 receptor antagonists have shown that the mGlu3 receptor is involved in the regulation of sleep and wake cortical theta and gamma oscillations42, suggesting that changes in the expression and/or function of mGlu3 receptors may account for the occurrence of sleep disturbances in PD patients carrying some of the GRM3 gene variants.
We also examined excitability and plasticity of primary motor cortex in PD patients with and without the GRM3 haplotypes and healthy controls. We did not find any difference in parameters testing cortical excitability between PD patients and healthy controls, and between PD patients carrying one of the associated GRM3 gene haplotypes and PD patients with the wild-type genotype. Despite previous study reporting increased excitability of the primary motor cortex (as tested by the I/O curve), as well as reduced ICF and SICI in PD patients43, other studies—similarly to our findings—have observed normal I/O curve, ICF and SICI in PD patients43,44.
Previous studies on M1 plasticity have shown both reduced45,46 and exaggerated PAS responses in off-medication PD patients compared to healthy controls47. These contrasting findings might reflect differences in clinical features of PD patients and variations in neurophysiological protocols43. A physiological response to PAS is characterized by an increase in MEP amplitude at T2, followed by a return to baseline levels at T3. Here, we found a trend to an increase in MEP amplitude in PD patients with a GRM3 wild-type genotype compared to healthy controls at T2. In contrast, patients carrying one of the two GRM3 haplotypes showed a significant reduction in PAS response compared to both PD patients without haplotypes and healthy controls.
The PAS paradigm induces a long-lasting enhancement of cortical excitability, which shapes cortical adaptation to convergent inputs48. Evidence from animal studies has demonstrated that DA depletion in the basal ganglia led to plasticity changes in primary motor cortex49,50. Accordingly, previous studies have repetitively found altered TMS-induced cortical plasticity in PD patients, suggesting a reduced long-term potentiation (LTP)-like plasticity24,43,51,52. Of great relevance to this study, activation of mGlu3 receptors also induces metaplastic changes, biasing afferent stimulation towards LTP of excitatory synaptic transmission12. This mechanism might contribute to explain the altered plasticity we found in response to PAS in PD patients carrying each of the two associated haplotypes. This hypothesis warrants further investigation.
Our study has the following limitations: (i) the lack of pharmacological studies in mice challenged with MPTP because selective mGlu3 receptor agonists or PAMs are lacking; (ii) the need to use brain tissue from individuals affected by PD to validate data extracted from the GTEx portal, which correlate the identified GRM3 gene variants with changes in mGlu3 receptor expression in different CNS regions; and, (iii) the relatively small number of patients recruited for TMS studies.
In conclusion, our findings strongly suggest that mGlu3 receptors are involved in the pathophysiology of PD regulating mechanisms of neurodegeneration/neuroprotection and cortical plasticity. In addition, GRM3 gene variants should be added to the list of genetic risk factors for PD, associated with specific phenotypes of the disorder. So far, translational research on mGlu receptors in PD has focused on mGlu4 and mGlu5 receptors, and mGlu5 receptor NAMs (e.g., mavoglurant and dipraglurant) or mGlu4 receptor PAMs (e.g., foliglurax) have been clinically developed for the treatment of PD or LIDs6,53 with disappointing results. Our findings encourage the development of selective mGlu3 receptor ligands as potential disease-modifying agents in PD.
Methods
Animal studies
Adult male C57/Bl6J mice (22–24 g Charles River, Calco, LC, Italy) were housed with a 12-hours light-dark cycle and food and water ad libitum. mGlu2−/− mice on a C57Bl/6 J genetic background were kindly provided by Prof. Shigetada Nakanishi (Osaka, Japan) and the colony was generated by homozygous breeding. mGlu3−/− mice were generated by GlaxoSmithKline, Verona, Italy. Mice were backcrossed up to the 17th generation on C57BL/6 J genetic background and bred in a specific pathogen-free breeding colony. Wild-type, mGlu2−/− and mGlu3−/− mice used in our experiments were generated by homozygous breeding form the colonies to limit the number of animals. All mice have been genotyped from the tail by PCR in the first 2–3 weeks after birth as shown in Supplementary Fig. 5 (see legend of Supplementary Fig. 5 for experimental details). All experimental procedures were carried out in accordance with the directives of the Italian and European Union regulations for the care and use of experimental animals and were approved by the local animal ethical committee and the Italian Ministry of Health (authorization n° 752/2022-PR).
MPTP treatment
Wild-type, mGlu2−/− and mGlu3−/− mice were injected with saline or MPTP (Sigma, Milan, Italy) according to a chronic paradigm of dopaminergic toxicity (10 mg/kg, s.c., every other day, for 10 days). MPTP-treated mice and their controls were killed 5 days after the last injection of saline or MPTP for biochemical or immunohistochemical analysis. In separate groups of mice, behavioural analysis was performed starting before injection of saline or MPTP and up to 10 days after the last injection of saline or MPTP, as reported below. The dorsal striatum was dissected out for measurements of DA and DOPAC levels.
Measurements of DA and DOPAC levels
Levels of DA and DOPAC in the dorsal striatum of wild-type, mGlu2−/−, and mGlu3−/− mice treated with either saline or 10 mg/kg MPTP were measured by HPLC as reported previously2.
Immunohistochemical analysis of TH, GFAP, and CD11b
Brains were dissected out, fixed in Carnoy’s solution (ethanol, acetic acid, and chloroform, 6:1:3), and included in paraffin. Sections (15 μm) were incubated overnight with monoclonal mouse anti-TH (1:200; Sigma, Italy, Milano, T1299), polyclonal rabbit anti-CD11b (1:100; Boster Biological Technology Co., Ltd, Pleasanton, CA, PB9140), or mouse anti-GFAP (1:200, Cell Signalling Technologies, Danvers, MA, USA, #3670) antibodies and then for 1 hour with secondary biotin-coupled anti-mouse (1:200; Vector Laboratories, Burlingame, CA, BA-2000) or anti-rabbit antibodies (1:200; Vector Laboratories, Burlingame, CA, BA-1000). 3,3-Diaminobenzidine tetrachloride (Sigma) was used for detection. For GFAP immunofluorescence, sections were incubated with AlexaFluor 546-conjugated anti-mouse secondary antibody for 1 h at room temperature. Slides were then imaged using an epifluorescent Zeiss Observer.Z1 microscope equipped with the Apotome.2 acquisition system connected to a digital camera (Zeiss, Oberkochen, Germany).
Stereological cell counting
The number of TH+ cells in the SNpc was assessed by stereological technique and optical fractionator using a Zeiss Axio Imager M1 microscope equipped with a motorized stage and focus control system (Zeta axis), and with a digital video camera. The software Image-Pro Plus 6.2 for Windows (Media Cybernetics, Inc., Bethesda, MD) equipped with a Macro was used for the analysis of digital images. The Macro was obtained by Immagine and Computer, Bareggio, Italy and the characteristics of this Macro are published54. The analysis was performed on 6 sections of 15 μm, sampled every 150 μm in a rostrocaudal extension of the substantia nigra from bregma level −2.70 to −3.80 mm posterior from bregma. In each stained section the area was identified and outlined at 2.5 X magnification. TH+ cells were counted at 100X magnification as described. For stereological analysis, we used a grid of disector (counting frame) of 40 × 40 μm; grid size 120 × 120 μm). The total number of TH-immunoreactive neurons per each rostrocaudal level was computed from the formula N = Σ(n) × 1/SSF × 1/ASF × 1/TSF, where N is the total number of neurons counted on each disector, SSF (fraction of sections sampled) is the number of regularly spaced sections used for counts divided by the total number of sections through the SNpc; ASF (area sampling frequency) is the disector area divided by the area between disectors; TSF (thickness sampling frequency) is the disector thickness divided by the section thickness. The total number of TH-immunoreactive neurons in the SNpc is the sum of the total number of TH-immunoreactive neurons per each rostro-caudal level.
Transcript analysis of pro- and anti-inflammatory molecules and trophic factors
Striatal samples were immediately frozen on liquid nitrogen and stored at −80 °C. RNA was extracted with the Nucleazol reagent and the NucleoSpin RNA Set for NucleoZol (Macherey-Nagel, Hoerdt, France) according to the manufacturer’s instruction. RNA quantity and quality were determined using the NanodropTM apparatus (Thermofisher Scientific, Walthman, MA), and 0.5 µg of total RNA was used to perform a reverse transcription (IscriptTM cDNA synthesis kit, Bio-Rad, Marnes-la-Coquette, France). The qPCR measurements were performed in triplicate using SYBR Green Super-mix (BioRad, Marnes-la-Coquette, France). The reaction conditions were as follows: 98 °C for 30 s (polymerase activation), followed by 40 cycles at 95 °C for 5 s, 60 °C for 10 s, and 72 °C for 10 s.
The following primers were designed using Primer3Plus software: Arg1: forward, GTGAAGAACCCACGGTCTGT; reverse, GCCAGAGATGCTTCCAACTG; Bin1: forward, ATCGCCAGCAACGTACAGAA; reverse, AGGCTTCGTGCATCGCTTTA; Cd86: forward, GAGCGGGATAGTAACGCTGA; reverse, GGCTCTCACTGCCTTCACTC; Gapdh; forward, TGGAAAGCTGTGGCGTGAT; reverse, GATGTCATCATACTTGGCAGGTT; Gdnf: forward, GCACCCCCGATTTTTGC; reverse, AGCTGCCAGCCCAGAGAATT; Il1b: forward, GAAGATGGAAAAACGGTTTG; reverse, GTACCAGTTGGGGAACTCTGC; Il-4: forward, TCACAGCAACGAAGAACACCA; reverse CAGGCATCGAAAAGCCCGAA; Il6: forward, CAAAGCCAGAGTCCTTCAGA; reverse, GCCACTCCTTCTGTGACTCC; Il4ra: forward, GGATAAGCAGACCCGAAGC; reverse, ACTCTGGAGAGACTTGGTTGG; Il-13 forward, GGCAGCATGGTATGGAGTGT; reverse, TTTTGGTATCGGGGAGGCTG; Mrc1: forward, CTTCGGGCCTTTGGAATAAT; reverse, TAGAAGAGCCCTTGGGTTGA; Nos2: forward, GCTCCCTATCTTGAAGCCCC ; reverse, TGGAAGCCACTGACACTTCG; P2rx7: forward, GCTTTGCTTTGGTGAGCGAT; reverse, CAAAGAATGAGTTCCCCTGCAA; P2ry12 : forward, GATTCAGCAGAACCAGGACCA; reverse, AGGACGGTGTACAGCAATGG ; Ptgs2: forward, TCATTCACCAGACAGATTGCT; reverse, AAGCGTTTGCGGTACTCATT; Socs1: forward, GAGTAGGATGGTAGCACGCA; reverse, TAATCGGAGTGGGAGCGGAA Tnfa: forward, GCCTCTTCTCATTCCTGCTT; reverse, AGGGTCTGGGCCATAGAACT; Tgfb: forward, TGATACGCCTGAGTGGCTGTCT; reverse, CACAAGAGCAGTGAGCGCTGAA; Socs3: forward, CGTTGACAGTCTTCCGACAA; reverse, TATTCTGGGGGCGAGAAGAT; Trem2: forward, CTTCAGATCCTCACTGGACCC; reverse, TTCCTGCTCCCAGGATAGGT.
Behavioural analysis
Behavioural analysis was performed in wild-type and mGlu3−/− mice treated with either saline or 10 mg/kg MPTP. Behavioural tests were performed on different days starting 1 day following the last MPTP administration to limit the interference of MPTP on motor behaviour. Animals were pre-trained on the rotarod and pole tests until ceiling performance was reached, before MPTP treatment. All tests were done between 9 am and 4 pm, on different days. The pole test (12 pm–2 pm) was performed at days 1, 5, and 7 after last injection. The rotarod test (2 pm–4 pm) was performed two days after treatment. The open field test (12 pm–2 pm) was performed five days after the last MPTP injection. The PaGE test was performed on the 6th day after last MPTP injection. The NOR test was performed from day 8 to day 10 after the last MPTP injection.
The rotarod test was carried out using the rotarod apparatus (Ugo Basile, Varese, Italy) was programmed to rotate with linearly increasing speed from 1 rpm to 30 rpm in 300 seconds. Automatic sensors captured when animals fell off the rod and the “latency to fall” was automatically calculated (sec). Animals were pre-trained for 3 days before MPTP treatment. During pre-training, mice performed 4 trials a day and rested 1 min between trials. On the post-MPTP testing day, the average of the latency to fall of 5 consecutive trials was measured. Between each trial, animals rested for 1 min55.
The pole test was carried out using an apparatus consisted of a 50 cm high wooden pole, 0.5 cm in diameter, wrapped with adhesive tape to prevent slipping, mounted on a triangular base stand. The base was positioned in the home cage, mice were placed on the top of the pole, facing upward, and were allowed to spontaneously turn around and climb down. Recording started when the animal began the turning movement. The following parameters were measured: the time needed to turn completely downward (Tturn), the time needed to climb down to the floor (Tclimbing), and the total time (Ttotal). The cut-off time was set at 15 sec. Each animal performed three consecutive trials, with a 5 min inter-trial interval. The average of the three trial was calculated for statistical analysis56,57.
The PaGE method is designed to assess the grip strength of mice and was performed as described58. Briefly, each mouse was placed on a wire lid from a conventional rodent cage; the lid was gently shacked to induce gripping and turned upside down (180°). The latency until the mouse released both hind limbs was measured in seconds. Each mouse was tested three times with a maximum of 90 s, and the latency to fall or release both hind limbs was recorded58.
On day 5 following last MPTP injection, mice were tested on the open field. Mice were tested on the open field. The apparatus consisted of a cubic box (42 × 42 × 21 cm) with its top left uncovered and transparent plastic walls. The box was connected to an Activity Monitor equipped with infrared photobeam interruption sensor and animal movements were measured and recorded by a computerised analysis system (Open Field Activity System Hardware; Med Associates, Inc., St. Albans, U.K.). On the day of the test mice were transferred to the testing room and left in their cage for about 30 min. Mice were habituated to the chamber for 10 min per day for two consecutive days. Total distance moved (cm) was automatically calculated for 5 min. The box was thoroughly wiped with 10% ethanol between each test to remove any residue.
The novel object recognition test was composed of three sessions (habituation, training and testing). Each session was conducted once a day for three consecutive days. The first day consisted of a 30-min habituation session in a white arena (40 cm × 40 cm × 24 cm). On the second day of training session, the mouse was able to freely move for 10 min after two identical objects were centred. On the third day of testing session, one object (familiar object) was replaced with a novel object. The novel object was made of the same material with different shapes and colours. The mouse was allowed to explore for 5 min. Through video recording, the exploration time for each object, the number of entries into the novel object zone (within a 3 cm radius of the object) and discrimination index were analysed. The exploration time for the familiar or novel object during the testing session was measured only when the nose pointed toward the objects at a distance of no more than 2 cm and/or touched or sniffed the object. Memory was determined by the discrimination index as shown by the following equation: [Discrimination index = (novel object exploration time/total exploration time) – (familiar object exploration time/total exploration time) x 100].
Statistical analysis of animal data
For animal studies, all values were expressed as means ± standard error of the mean (S.E.M.). Statistical analysis was performed by: two-way analysis of variance (ANOVA) (Figs. 1B, C, E, F, 2B, and Fig. 3); or two-way ANOVA for repeated measures (Supplementary Fig. 2). Fisher LSD was used as post hoc test. p values < 0.05 were considered significant.
Patients with PD and healthy controls
Genetic analysis was carried out on 723 patients affected by PD (446 males and 277 females, age: 40–92 years) and 826 age/gender-matched healthy controls (391 males and 435 females, age: 19–94 years). Blood was collected, and DNA extracted from nucleated cells was stored at −80 °C59. Patients affected by PD were recruited at IRCCS Neuromed and Policlinico Umberto I (Sapienza University of Rome). Control subjects were enrolled from the Moli-Sani project, an Italian population-based study, which samples were stored in liquid nitrogen at the Neuromed Biobank Centre60. All patients and healthy controls gave informed consent to the study, according to the Declaration of Helsinki. The study was approved by local ethical committee (IRCCS Neuromed approved study protocols: N°9/2015, N°19/2020 and N°4/2023). Retrospective data included the socio-demographic status, lifestyle, anamnesis and family history, exposure to toxic chemical and/or environmental agents and drug treatments. At the time of blood collection, all patients affected by PD have been examined using the MDS-UPDRS part III and IV and the Hoehn and Yahr (HeY) scale for the assessment of motor symptoms, the MOCA for the assessment of cognitive function, and the NMSS for the assessment of cardiovascular symptoms including falls, sleep/fatigue, mood/cognition, perceptual problems/hallucinations, attention/memory, gastro-intestinal tract symptoms, urinary function, sex, and miscellaneous.
In a subset of patients (466 PD patients, 283 males and 183 females, age: 40–88 years, and 285 healthy controls, 124 male and 161 female, age: 19–90 years) for whom WES data were available, the analysis was extended to the exonic variants as well as to the 5’ and 3’ UTR exonic variants and to intronic variants near the exons. The phenotypic characteristics of all PD patients and the sub-cohort of patients recruited for the analysis of exonic variants are shown in Figs. 4A and 6A, respectively.
GRM3 genotyping
GRM3 intronic variants known to be associated with schizophrenia8,39,40,41 were selected for the analysis (Supplementary Table 3). The structure of the GRM3 gene and the specific location of gene variants is shown in Fig. 4B. DNA extraction from 200 μl of peripheral blood was performed using the QIAsymphony automatic nucleic acid extractor (QIAGEN), with the QIAsymphony DSP DNA Mini Kit. Genotyping was performed using a primer extension chemistry followed by MALDI-ToF (Matrix Assisted Laser Desorption Ionization-Time of Flight) mass spectrometry. Briefly, locus-specific amplification and extension primers (Supplementary Table 4) were designed using the AGENA Assay design Suite V2.0 software (AGENA Biosciences, San Diego, CA). Multiplexed PCR amplification, shrimp alkaline phosphatase treatment and locus-specific primer extension were performed using the iPLEX Gold kit (AGENA Biosciences). The resulting products were desalted and analyzed by mass spectrometry using the MassArray Analyzer 4 (AGENA Biosciences). Mass spectra were analyzed and converted into genotypes by the SpectroTYPER RT 2.0 software (AGENA Biosciences). All procedures were performed according to the manufacturer’s instructions.
Single SNP analysis and haplotype analysis were performed using the SNPStats software61,62. The value of 0.05 was set as the significance threshold.
Whole-exome sequencing
Genomic DNA was isolated from peripheral blood lymphocytes by PAX gene Blood DNA Midi Kit (QIAGEN, Hilden, Germany). WES was performed on 466 affected individuals and 285 heathy subjects from Neuromed cohort. Exonic regions were enriched using the Twist Exome 2.0 plus (Twist Bioscience, San Francisco, CA) based on DNA fragmentation and capture. Exomes were barcoded and sequenced using the Illumina® Novaseq6000 platform (Illumina, San Diego, CA). The alignments of the 150-bp paired-end reads to the human reference genome was performed by using the Burrows Wheeler Aligner (BWA) MEM v0.7.559. After removal of duplicate reads through Picard MarkDuplicates command (with standard options), we called the single nucleotide variants (SNVs) and insertions/deletions (indels) for all samples using HaplotypeCaller (BP RESOULTION option) and GenotypeGVCFs in Genome Analysis Toolkit (GATK) v3.5-0-g36282e4, following the manufacturer best practice guidelines (available at https://software.broadinstitute.org/gatk/best-practices/). Variants with Minor Allele Count (MAC) = 0, number of alternative alleles ≠ 2 and call rate <95% were also filtered out, as well as samples with identical-by-descent sharing and sex mismatches, and samples with call rate <90%. Similarly, samples were checked for absence of outliers in terms of genome-wide homozygosity, of number of singleton variants and of genetic ancestry (through Multidimensional Scaling Analysis in PLINK). Variants passing quality control were annotated to genes (within 10 kb from transcription start/stop site) through ANNOVAR. Variant annotation contained information concerning variant type, Minor Allele Frequency (MAF) in the general population, and predictions of the variant’s effect on gene function. MAF was annotated in NHLBI GO Exome Sequencing Project ESP6500si-v2 (European American and African American population), 1000 Genomes Project (AFR [African], AMR [Admixed American], EAS [East Asian], EUR [European], SAS [South Asian], Exome Aggregation Consortium (ExAC) (EUR, non-Finish European population [NFE], AFR, SAS, EAS and AMR). SIFT, PolyPhen2 and Combined Annotation Dependent Depletion were used to assess the deleterious effects of the identified variants. These variants were annotated to genes (within 10 kb from transcription start/stop site) through Annovar version 1-2-2016 and Ensembl Variant Effect Predictor (VEP) v88.
The cohort of patients and controls selected for the analysis of exonic variants or sequences nearby was searched for 25 variants in the GRM3 gene (6 in the promoter region, 18 in the intronic regions and 1 synonymous change c.C879T, p.A293A) with a minor allele frequency (MAF) > 0.01. The investigated polymorphisms are listed in Supplementary Table 5.
Gene Expression Data
The Genotype‐Tissue Expression (GTEx) portal (https://www.gtexportal.org/home/) was accessed to obtain GRM3 gene expression data of the identified SNPs. The analysis was performed on all available adult human CNS regions (amygdala, anterior cingulate cortex BA24, caudate nucleus, putamen, substantia nigra, cerebellar hemispheres, cerebellum, cerebral cortex, frontal cortex BA9, hippocampus, hypothalamus, nucleus accumbens, and c-1 cervical tract of the spinal cord).
TMS studies in patients with PD and healthy controls
Participants who underwent neurophysiological session included: 11 patients with PD carrying one of the two haplotypes associated with PD (aged: 72 ± 8; males: 8); 10 patients with PD carrying the wild-type genotypes (aged 74 ± 6; males: 7); and 16 age and sex-matched healthy controls (aged 66.75 ± 9.11; males: 10). Patients with PD carrying or not the associated haplotypes and healthy controls underwent neurophysiological assessment for the study of cortical excitability and plasticity using TMS. Participants underwent a single experimental session for the neurophysiological procedures. PD patients were studied after discontinuation of dopaminergic therapy for at least 12 hours.
Single- and paired-TMS pulses were delivered using two Magstim magnetic stimulators (Magstim Company, Whitland, UK) connected to an eight-shaped coil. The coil was positioned tangentially to the scalp at the intersection, with the handle angled approximately 45° backward from the midline. After locating the hotspot of the abductor pollicis brevis (APB) muscle, which is the optimal scalp position for eliciting maximum MEPs in the APB, resting and active motor thresholds (RMT and AMT) were determined, along with the minimum intensity required to evoke an MEP of approximately 1 mV amplitude (1 mV MEP)63,64. To assess M1 excitability, the input-output (I/O) MEP curve was measured, delivering 50 single-pulse stimuli in groups of 10 at five different stimulation intensities, with 20% increments from 100 to 180% of the RMT. Stimulation intensities were randomly ordered to avoid hysteresis effects. SICI and ICF were also investigated using paired-pulse TMS, employing a subthreshold conditioning stimulus (90% AMT), a suprathreshold test stimulus (1 mV MEP), and an interstimulus intervals (ISIs) of 2 and 4 ms for SICI and 10 and 15 ms for ICF64,65. Ten trials were conducted for each ISI. To investigate cortical plasticity, PAS was delivered to the contralateral primary motor cortex (M1) in PD patients and to the dominant side in healthy controls. PAS involved 225 electrical stimuli applied to the median nerve at the wrist using a Digitimer DS7 (Digitimer, Welwyn Garden City, UK), coupled with TMS stimuli adjusted to evoke a 1 mV MEP over the APB muscle hotspot (frequency 0.25 Hz, electrical stimulation intensity 2–3 times perceptual threshold). The electrical conditioning stimulus preceded each TMS stimulus at an ISI of 21.5 ms. During PAS, participants were instructed to maintain fixation on their hand and report every 20 perceived peripheral electrical stimuli to ensure consistent attention levels and comparable conditions across sessions. Electromyography (EMG) activity was recorded from the APB muscle on the most affected side using surface electrodes arranged in a muscle belly-tendon configuration. EMG signals underwent amplification and filtering (20 Hz-1 kHz) with a Digitimer D360 (Digitimer, UK), before being recorded and stored on a laboratory PC (sampling frequency of 5 kHz) through an AD1401 plus analog-to-digital converter (Cambridge Electronic Design, Cambridge, UK) for subsequent offline analysis. Analysis was performed using specialized software (Signal® version 4.00, Cambridge Electronic Design, UK). Peak-to-peak MEP amplitude was measured within a 20-40 ms window following the TMS artifact. Traces exhibiting background EMG activity exceeding 100 µV in the 200 ms window preceding the TMS artifact were discarded in real-time. The slope of the MEP input-output (I/O) curve (i.e., the slope of the regression line through the scatterplot of MEP amplitude (Y-axis) versus stimulation intensity (X-axis)) was computed. SICI and ICF were quantified as the ratio of conditioned to unconditioned MEP amplitude. For evaluation of primary motor cortex (M1) plasticity through PAS, 1 mV MEPs were measured at various timepoints, including pre-PAS (T0) and at 5 minutes (T1), 15 minutes (T2), and 30 minutes (T3) post-PAS.
Statistical analysis of human data
For genetic studies, clinical and demographic characteristics were described using, as summary statistics, median and the interquartile range (IQR) or absolute and relative frequencies. Comparisons between PD patients and controls were evaluated using MedCalc statistical software for continuous variables and Chi-Square test for dichotomous variables using the SNPStats software. In the endophenotypes analysis we used an MDS-UPDRS score < 30 (corresponding to a mild phenotype: 1-2 of HeY scale) and ≥ 30 (corresponding to a severe phenotype: 3-5 HeY scale)62, while in non-motor symptoms we used as cut-off ≤ 54 and >54 (9 items x 2 (mild impairment) x 3 (weekly impairment). Bonferroni correction was applied for both association analysis with the disease and correlation with phenotypic traits (Figs. 4–7 and Supplementary Tables 1-2).
For TMS study, age and sex differences among PD patients carrying the GRM3 haplotypes associated with the disease, PD patients carrying the wild-type genotype, and healthy controls were evaluated using the Kruskal-Wallis test and the Chi-square test. Clinical features of patients undergoing the neurophysiological protocol were compared using the Mann-Whitney U test between PD patients with haplotypes and PD patients carrying the wild-type genotype. Differences between the three groups (PD patients with haplotypes; PD patients carrying the wild-type genotype, and healthy controls) in neurophysiological features, including TMS parameters (i.e. motor thresholds, input/output curve, mean SICI, mean ICF) and PAS response (mean 1 mV MEPs) recorded before PAS and mean MEP amplitude recorded at 5 min (T1), 15 min (T2), and 30 min (T3) after PAS were valuated using the Kruskal-Wallis test and post hoc comparison (Bonferroni correction). Statistical analyses were performed using STATISTICA® (TIBCO Software Inc., Palo Alto, CA) (Fig. 8).
Responses