Role of GPX3+ astrocytes in breast cancer brain metastasis activated by circulating tumor cell exosomes
Introduction
Breast cancer is a prevalent malignancy among women globally, and early diagnosis and treatment impact the five-year survival rate and treatment outcome1,2,3,4. While the survival rate of breast cancer has improved in recent years because of screening programs and advances in treatment methods, the prognosis for advanced-stage breast cancer, particularly in cases with brain metastases (BM), remains unfavorable5,6,7. Brain metastasis is a leading cause of mortality in breast cancer patients, affecting around 20% of patients throughout the disease8,9,10,11. However, the limited effectiveness of current treatment methods in preventing and treating breast cancer brain metastasis is attributed to the unclear understanding of its biological mechanisms8.
Astrocytes, the predominant type of glial cells in the central nervous system, have a critical role in maintaining the overall health and functioning of the central nervous system12. The influence of star-shaped glial cells on brain metastasis has garnered the interest of scientists13. Astrocytes, star-shaped glial cells, could engage with tumor cells through numerous mechanisms, such as physical interaction, secretion of extracellular vesicles (EVs), and signaling molecules. These interactions are believed to be crucial in developing brain metastasis14,15,16. Studies have demonstrated that the activation of astrocytes could modify the immune environment in the brain, resulting in the development of a premetastatic niche characterized by immunosuppressive properties. This niche facilitates the dissemination of tumors17,18,19. Previous research has shown that phosphorylated signal transducer and activator of transcription 3 (pSTAT3) in reactive astrocytes has recently emerged as a promising therapeutic target for minimally invasive BM. The invasive growth of BM is associated with pSTAT3-positive astrocytes releasing CHI3L1. Activation of STAT3 or recombinant CHI3L1 alone induces cancer cell invasion into the brain parenchyma20. Cancer-activated astrocytes create a sustained low-level activation of type I interferon (IFN) microenvironment in brain metastatic lesions. IFN signaling in astrocytes activates the production of C-C motif chemokine ligand 2 (CCL2), further enhancing the recruitment of monocytes and promoting brain metastasis21. Brain metastatic cells induce and sustain a pro-metastatic program driven by Signal Transducer and Activator of Transcription 3 (STAT3) in a subpopulation of reactive astrocytes surrounding metastatic lesions. Active STAT3 in reactive astrocytes is negatively correlated with post-diagnosis survival in intracranial metastases. Blocking STAT3 signaling in reactive astrocytes can reduce experimental BM from different primary tumor origins22.
In this context, single-cell RNA-seq and metabolomics offer a powerful tool for a comprehensive and in-depth understanding of the biological processes involved in breast cancer brain metastasis23. Single-cell RNA-seq could unveil the heterogeneity of different types and states of cells, uncover cell-cell interactions, and elucidate mechanisms at the transcriptional level24. Metabolomics analysis could explore the metabolic changes in tumors and astrocytes, uncovering their potential metabolic pathways and regulatory networks25. Moreover, circulating tumor cells (CTCs) have been found to play a role in creating metastatic niches via remote blood regulation. However, the specific roles and mechanisms of CTCs in breast cancer brain metastasis are still being investigated26.
This study aims to elucidate the potential mechanisms by which CTCs activate GPX3+ astrocytes that polarize toward tumor cells during the initial phases of brain metastasis in breast cancer. It will be achieved by employing single-cell RNA sequencing (scRNA-seq) and metabolomics techniques to comprehend the formation of a metastatic niche in the brain tissue. Our research aims to investigate the biological processes involved in breast cancer brain metastasis and identify new targets and ideas for treatment strategies. By doing so, we aim to enhance the prognosis of breast cancer patients, particularly those susceptible to brain metastasis.
Results
Establishment of a Mouse Model for spontaneous breast cancer brain metastasis
BM are the most frequent malignant neoplasms of the central nervous system, surpassing primary brain tumors in incidence by a factor of 1027. Metastatic breast cancer (BC) is responsible for more than 90% of breast cancer-related deaths, with the brain being among the most lethal sites for metastasis28,29. Despite implementing advanced treatment approaches such as stereotactic radiosurgery, the median survival time for breast cancer patients with BM remains approximately one year30. It is imperative to identify novel targets for breast cancer patients with brain metastasis to offer additional treatment alternatives.
Experimental models of metastasization to the brain assist in uncovering possible cellular and molecular mechanisms and identifying potential therapeutic targets31,32. To address this limitation, we created a mouse model (BMBC mouse) that exhibits spontaneous metastasis from the primary site (breast) to the brain. 4T1 cells were injected into the mammary glands of BALB/c mice to induce tumor formation, subsequently spreading to the lungs, liver, and lymph nodes. Notably, no evidence of brain metastasis was detected. Subsequently, the injection of 4T1 cells into the mammary gland of NSG mice revealed that over 50% of the NSG mice developed brain metastasis.
Given that NSG mice are immunodeficient, we acquired the 4T1 mouse breast cancer brain metastasis (4T1-BM) cell line from NSG mouse brain metastasis and administered intratumoral injections into the mammary glands of immunocompetent BALB/c mice. Our results indicate that 40% of the mice developed brain metastasis (Fig. 1A). Moreover, the mice that underwent metastasization to the brain show evident clinical signs of neurological dysfunction, including limb paralysis and loss of balance. In vivo experiments using dynamic bioluminescence imaging (BLI) reveal that, unlike lung metastasis, brain metastasis emerges at a later stage in the progression of the disease (Fig. 1B, C). The H&E and IHC experiments revealed noteworthy CD31, Ki67, and GFAP expression in BM. These metastases exhibited distinct histopathological features, such as vascular adhesion, proliferation, brain parenchymal infiltration, and reactive gliosis (Fig. 1D, E).
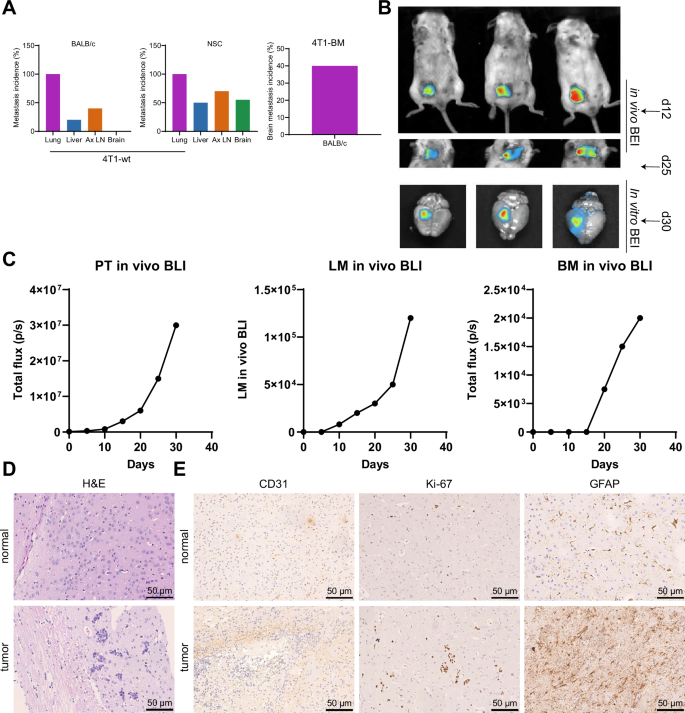
Note: A Schematic representation of the establishment of the spontaneous brain metastasis model of breast cancer and the process of in vivo injection of 4T1-BM metastatic cells. Ax LN: Axillary lymph node. B in vivo BLI monitoring of primary tumor (PT) growth, lung metastases (LM), and BM following injection of 4T1-BM cells in BALB/C mice. C BLI kinetics and quantification of breast primary tumor, lung metastases, and BM, where the red dots represent the quantified values of isolated lung and brain tissue compared to the corresponding in vivo measurements (black curves). D H&E images of 4T1-BM metastatic foci in brain tissues of normal group and spontaneous brain metastasis model mice of breast cancer (scale bar: 50 µm); E IHC detection of the expression of CD31 (endothelial cells), Ki67 (proliferation), and GFAP (glial cells) genes in brain tissues of normal group and spontaneous brain metastasis model mice of breast cancer (scale bar: 50 µm); n = 10. Count data are presented as Mean ± SD.
Our study yielded positive results, as we successfully established a mouse model that demonstrates spontaneous metastasis from the primary site (breast) to the brain.
scRNA-seq analysis reveals distinct cellular distributions and identification of cell types in brain tissue of breast cancer mouse model
Prior research has shown that the primary tumor can modify the microenvironment in particular tissues before metastasis. This modification induces the creation of metastatic niches, which offer favorable circumstances for the adaptation and survival of primary tumor cells. This allows the cells to proliferate and acquire the conditions for subsequent colonization of target organs33.
In order to investigate the specific molecular mechanisms underlying the formation of brain metastatic niches in BMBC mice, we obtained scRNA-seq datasets from the brain tissues of spontaneous brain metastatic (tumor group, n = 4) and non-metastatic (normal group, n = 4) breast cancer primary site to brain metastasis model mice using high-throughput sequencing. Both groups had primary tumors, and the data were integrated using the Seurat package. Initially, we examined the number of genes in all cells before filtering for different groups in the scRNA-seq data, including the nFeature_RNA, nCount_RNA, and percent.mt metrics. The results showed that cells had nFeature_RNA < 8000, nCount_RNA < 50000, and percent.mt = 0 (Supplementary Fig. 2A).
We removed low-quality cells from the dataset using the criteria nFeature_RNA > 200 and nFeature_RNA < 5000. It resulted in an expression matrix containing 18,489 genes and 29,146 cells. The filtered cell groups’ characteristics include nFeature_RNA, nCount_RNA, and percent. mt, are presented in Supplementary Fig. 2B.
Subsequently, we utilize the “FindIntegrationAnchors” function to merge the data from the tumor and normal groups and the “IntegrateData” function to eliminate batch effects. The correlation analysis of sequencing depth revealed the correlation coefficient between nCount_RNA and percent. mt in the filtered data is NA, while the correlation coefficient between nCount_RNA and nFeature_RNA is 0.85 (Supplementary Fig. 3A). This result suggests that the filtered cell data is of good quality and could be utilized for subsequent analysis. In order to further standardize the filtered cells, we conducted a screening for highly variable genes based on gene expression variance. Subsequently, we selected the top 4000 genes with the highest variance for downstream analysis. The cell cycle of the sample was determined utilizing the “CellCycleScoring” function (Supplementary Fig. 2C), and the data was preliminarily normalized.
Subsequently, PCA was applied to reduce the dimensionality of the data by using the selected highly variable genes. This analysis revealed no discernible batch effects among the samples, as shown in Supplementary Fig. 3B. This study selectively presents the major constituent genes in the first four principal components (PCs) (Supplementary Fig. 4A). Additionally, we generate a heat map of the first four PCs using the “DimHeatmap” function (Supplementary Fig. 4B).
The first 20 principal components (PCs) should be visualized using the ‘JackStrawPlot’ function to compare the distribution of p-values for each PC with the mean distribution. ‘Important’ PCs are typically identified by small p-values, represented by the solid line being above the dashed line, and could effectively represent the information contained in highly variable genes that were selected earlier (Supplementary Fig. 3C). The first 11 PCs with a p-value less than 0.05 were also selected for subsequent UMAP analysis when combined with the ‘ElbowPlot’ function (Supplementary Fig. 4C).
Following the UMAP clustering analysis, all cells were grouped into 25 distinct clusters (Supplementary Fig. 4D). The characteristic genes for each cell cluster were identified and used to generate expression profiles of the top 10 marker genes specific to each cluster (Fig. 2A). The cluster analysis reveals multiple cell distributions in each sample, with differences observed between the tumor group and the normal group samples (Fig. 2B).
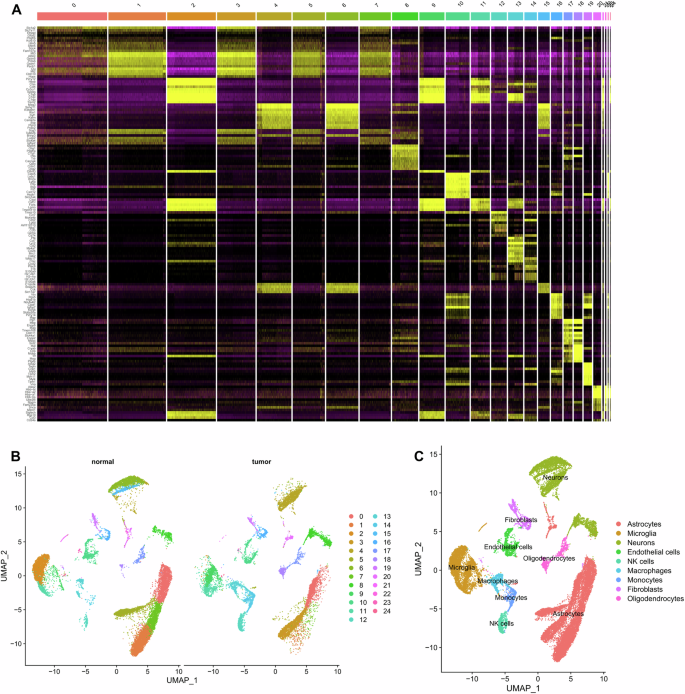
Note: A Heatmap displaying the top 10 marker gene expressions for each cell cluster; B UMAP clustering analysis showing the grouping of Normal and Tumor samples; C Integration of the “SingleR” package with the CellMarker database annotating 16 cell clusters into 9 cell types.
We used the Bioconductor/R software package called “SingleR” and the CellMarker database to annotate the marker genes of 25 cell clusters in brain tissue. Finally, the marker genes were annotated into 9 cell types: Astrocytes, Microglia, Neurons, Endothelial cells, NK cells, Macrophages, Monocytes, Fibroblasts, and Oligodendrocytes (Fig. 2C).
After performing quality control on the single-cell sequencing data and conducting principal component analysis and UMAP clustering analysis, we classified the sample cells into nine distinct cell types for further analysis.
Characterization of Tumor-Associated Astrocytes (TAAs) and their potential role in brain metastatic niche formation in breast cancer brain metastasis
The disruption of the blood-brain barrier (BBB) is a prerequisite for the formation of brain metastatic niche. Astrocytes, the most abundant and widely distributed glial cells in the brain, play a crucial role in preserving the integrity of the blood-brain barrier and ensuring the stability of the brain’s microenvironment34.
Recent research suggests that the number of astrocytes in brain metastasis tissues of lung cancer is lower than in normal brain tissue, which causes a disruption of the blood-brain barrier and leads to the formation of BM35. We illustrate the proportions of different cell clusters in the samples and observe that astrocytes account for the highest proportion in both the tumor and normal groups. Additionally, we note that the proportion of astrocytes in the normal group is greater than that in the tumor group (Fig. 3A).
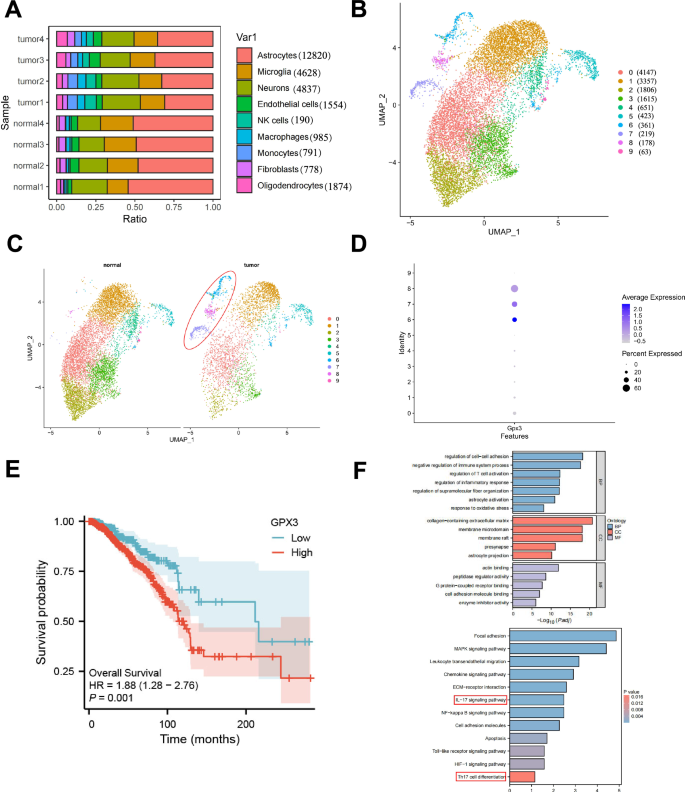
Note: A The percentage composition of different cell subtypes in each sample, represented by different colors. B UMAP clustering analysis reclassifies astrocytes into 10 cell clusters. C UMAP clustering analysis of astrocytes in Normal and Tumor samples, with the tumor-specific subcluster highlighted by the red circle. D Expression of GPX3 in astrocyte subclusters. E Effect of high versus low GPX3 expression on the overall survival rate of breast cancer brain metastasis patients based on GEO database analysis; F GO and KEGG enrichment analysis of characteristic genes in TAAs cells, with critical pathways highlighted in red boxes.
Therefore, we isolated the astrocyte population and conducted a re-clustering analysis. Here, we selectively present the key gene components from the top 4 principal components (Supplementary Fig. 5A) and their corresponding heatmap (Supplementary Fig. 5B). We utilized the “JackStrawPlot” and “ElbowPlot” functions (Supplementary Fig. 5C, D) to select the top 15 principal components (PCs) for the subsequent UMAP analysis. This analysis allowed us to cluster astrocytes into 10 distinct cell clusters (Fig. 3B). By doing so, we identified characteristic genes for each cell cluster and visually represented the expression profiles of the top 10 marker genes specifically associated with these 10 cell clusters (Supplementary fig. 5E).
The results reveal significant differences between the tumor and normal groups in terms of the expression of astrocytes (Fig. 3C). Specifically, Cluster 6, 7, and 8 were found to be predominantly present in the tumor group. Hence, we have classified these subgroups as tumor-associated astrocytes (TAAs). Literature states that single-cell analysis has identified a GPX3+ type 2 lung epithelial cell subset in lung metastasis. Moreover, through its secretion of IL-10, this subset could promote the formation of lung metastatic niches36. GPX3 is a metabolic enzyme in cellular oxidative metabolism37. According to multiple reports, this protein functions as a tumor suppressor and a promoter of survival during tumor progression38.
Simultaneously, we investigated the distribution of GPX3 among the cluster of astrocytes and discovered that GPX3 exhibited a more prominent distribution and expression in the TAAs (Cluster 6, 7, 8) (Fig. 3D). Based on an analysis of the GEO database, we examined the impact of high versus low GPX3 expression on the overall survival rate of patients with breast cancer brain metastasis. The results showed that patients with high GPX3 expression had a significantly lower overall survival rate than those with low GPX3 expression, indicating that high GPX3 expression may be closely associated with poor prognosis in these patients. This supports the potential role of GPX3 as a prognostic marker for breast cancer brain metastasis patients (Fig. 3E). We further conducted GO and KEGG enrichment analyses on the characteristic genes within Clusters 6, 7, and 8 (Fig. 3F). The results demonstrated that the feature genes of the GPX3+ TAAs subcluster were primarily involved in regulating cell-cell adhesion, immune system and inflammation control, oxidative stress response, and astrocyte activation. Furthermore, they were also found to be associated with immune and inflammation-related pathways, including the MAPK signaling pathway, NF-κB signaling pathway, toll-like receptor signaling pathway, IL-17 signaling pathway, and Th17 cell differentiation. Previous studies suggest that pro-inflammatory infiltrating cells, specifically Th17 cells, can secrete IL-17. This secretion activates the MAPK signaling pathway, resulting in the proliferation and metastasis of breast cancer cells. Additionally, it leads to NF-κB-mediated MMP signal expression39. Furthermore, Th17 cells could also modify liver metastatic niches, stimulate pathways related to cancer stem cells and epithelial-to-mesenchymal transition (EMT), and facilitate angiogenesis40.
Based on the findings above, we hypothesize that the subgroup of GPX3+ TAAs may be associated with the modulation of Th17 cell immune response, occurrence of inflammation, and formation of brain metastatic niches.
Knockout of GPX3 in astrocytes reduces brain metastasis and prolongs survival in a mouse model of breast cancer
To further investigate the relationship between GPX3+ TAAs cells and brain metastasis, we generated astrocyte-specific Slc6a11-CreERT2 mice and Gpx3-Flox mice. Tamoxifen treatment was used to induce Cre-ERT2, activating Cre recombinase in the nucleus and subsequent conditional knockout of GPX3 in astrocytes (GPX3 KO) (Supplementary fig. 6A). The absence of GPX3 in astrocytes of GPX3 KO mice was further confirmed through Western blot and immunofluorescence (Supplementary fig. 6B, C).
Gpx3 knockout (KO) mice were injected with 4T1-BM cells at the abdominal groove of the right fourth mammary gland. After 30 days of cancer cell injection, bioluminescence imaging using luciferase detection indicated a significant reduction in brain metastasis in GPX3 KO BMBC mice compared to the control group of BMBC mice (Fig. 4A, B). Furthermore, the GPX3 KO BMBC mice exhibited a longer survival time compared to the BMBC mice (Fig. 4C). Fn-1, S100A8, S100A9, and MMP9 are regarded as the primary constituents in the formation of the pre-metastatic microenvironment due to their involvement in multiple cancer relapses and metastases40. Quantitative real-time polymerase chain reaction (qRT-PCR) and Western blot analysis revealed a decrease in the mRNA and protein levels of Fn-1, S100A8, S100A9, and MMP9 in the brain of GPX3 knockout (KO) BMBC mice compared to the wild-type (WT) BMBC mice (Fig. 4D–F).
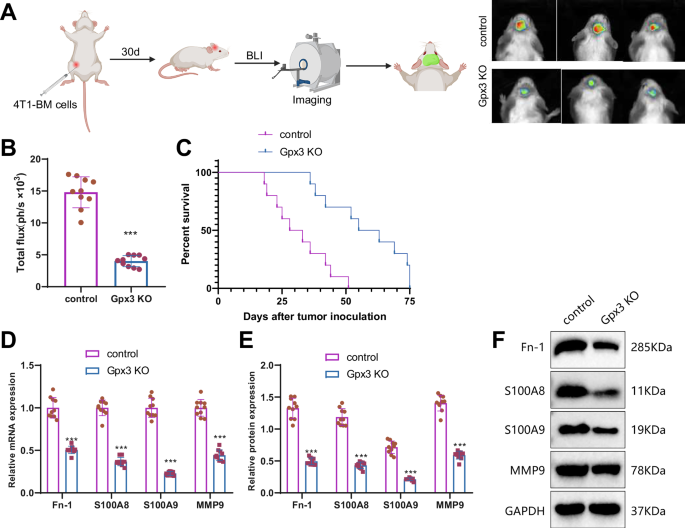
Note: A BLI experiment to evaluate brain metastasis in different groups of mice (Created with BioRender.com). B Quantitative analysis of brain metastasis using BLI. C Survival analysis of the mice in each group. D–F RT-qPCR and Western blot determined expression levels of Fn-1, S100A8, S100A9, and MMP9 mRNA and protein in the brain tissue of mice in each group. The mRNA levels were normalized to the control group. The quantitative data were presented as Mean ± SD. * indicates statistical significance compared to the control group, P < 0.05; ** indicates statistical significance compared to the control group, P < 0.01; *** indicates statistical significance compared to the control group, P < 0.001; n = 10.
The results above indicate that the knockout of GPX3 in star-shaped glial cells could inhibit tumor metastasis. It suggests that GPX3+ TAAs cells are crucial in promoting the formation and metastasis of brain metastatic niches.
GPX3 + TAAs promote Th17 cell differentiation and contribute to brain metastatic niche formation in breast cancer brain metastasis
We determined, via GO and KEGG enrichment analysis, that the cell characteristic genes of GPX3+ TAAs are enriched in the IL-17 signaling pathway, Th17 cell differentiation, and other signaling pathways (Fig. 3F). Th17 cells represent a distinct subset of cells that secrete IL-17 and undergo differentiation from CD4+ T cells. We examined the subsets of immune cells in the brains of GPX3 knockout BMBC mice and BMBC mice before and after tumor inoculation. No differences in brain immune cell subsets were observed between GPX3 KO BMBC mice and BMBC mice before tumor transplantation (Supplementary Fig. 7A). Following tumor transplantation, the brain of GPX3 KO BMBC mice exhibited reduced numbers of CD4+ T cells (Fig. 5A) and Th17 cells (Fig. 5B). Furthermore, the number of Ly6G + Ly6- neutrophils, Ly6G-Ly6C+ monocytes, and FOXP3 + CD4+ T cells (regulatory T cells) in the brains of GPX3 KO BMBC mice was significantly reduced (Supplementary Fig. 7B). The decrease in these three cell types could all potentially contribute to tumor progression. Furthermore, the quantity of CD11b + Ly6G+ Ly6Cint neutrophils and Ly6G Ly6C+ monocytes in the brains of GPX3 knockout BMBC mice decreased (Supplementary fig. 7B). Correspondingly, qRT-PCR and Western blot analysis revealed a significant decrease in the expression levels of the Th17 cell-associated cytokines IL-17 (IL17A), IL-17F, and IL-23 in GPX3 KO BMBC mice (Fig. 5C, D).

Note: A, B Flow cytometric analysis of the number of CD4+ T cells, CD8+ T cells, and Th17 cells in the brains of mice in each group. C, D Expression levels of IL-17 (IL17A), IL17F, and IL-23 mRNA and protein in the brain tissue of mice in each group as determined by RT-qPCR and Western blot, with mRNA normalized to the control group (BMBC). E Flow cytometry was used to detect the number of Th17 (CD45+ IL-17A+) cells in the brain tissues of mice in each group; F BLI experiment to evaluate brain metastasis and quantitative analysis in each group of mice. G Survival analysis of the mice in each group. H–I Expression levels of Fn-1, S100A8, S100A9, and MMP9 mRNA and protein in the brain tissue of mice in each group as determined by RT-qPCR and Western blot. Ns indicates no difference compared to the BMBC group, with mRNA normalized to the control group (GPX3 KO BMBC); Counting data were presented as Mean ± SD, ** indicates statistical significance compared to the BMBC group or GPX3 KO BMBC+Ctrl protein group, P < 0.01; *** indicates statistical significance compared to the control group or GPX3 KO BMBC+Ctrl protein group, P < 0.001; n = 10.
Subsequently, we used oe-IL17 to increase the proportion of Th17 cells in vivo. Flow cytometry analysis of brain tissues from each group of mice revealed a significant increase in Th17 cells in the brain tissues of oe-IL17-treated mice (Fig. 5E), which reversed brain metastasis in GPX3 KO BMBC mice (Fig. 5F) and significantly reduced survival rates (Fig. 5G). The results of qRT-PCR and Western blot analysis (Fig. 5H, I) demonstrated a significant increase in the levels of Fn-1, S100A8, S100A9, and MMP9 mRNA and protein levels. These findings further support the significant role of Th17 cells in the formation and metastasis of brain polymorphonuclear neutrophils in BMBC mice.
The results above indicate that GPX3+ TAAs cells promote the maturation and differentiation of Th17 cells. Additionally, they facilitate the formation and migration of metastatic niches in the brains of BMBC mice.
GPX3 + TAAs facilitate Th17 cell differentiation through IL-1β secretion in breast cancer brain metastasis
Studies investigating the molecular mechanisms of brain metastasis in lung cancer have observed a marked elevation in GFAP-positive astrocytes surrounding the metastatic areas in brain slices. These activated astrocytes are responsible for producing interleukin-6 (IL-6), tumor necrosis factor-alpha (TNF-α), and interleukin-1 beta (IL-1β), thereby facilitating the metastasis and growth of tumor cells within the brain41.
IL-1β has been shown to play a crucial role in promoting a favorable microenvironment established by tumor-associated astrocytes for metastatic cells during brain metastasis of breast cancer42. Furthermore, IL-1β plays a pivotal role in differentiating Th17 cells43,44.
In the single-cell analysis of this study, we found that IL-1β was highly expressed in Cluster 6 of GPX3+ TAAs cells (Fig. 6A). Therefore, we hypothesize that GPX3+ TAAs cells secrete IL-1β to promote the differentiation of Th17 cells. qRT-PCR and Western blot results showed that, compared to healthy control mice, there was no significant difference in the expression levels of GPX3 and IL-1β in astrocytes from the normal group. However, in the BMBC mice, the expression levels of GPX3 and IL-1β in TAAs cells were significantly elevated. In contrast, in GPX3 KO BMBC mice, GPX3 KO – healthy, and GPX3 KO – non-metastatic mice, IL-1β expression in TAAs cells was significantly decreased (Fig. 6B, C).
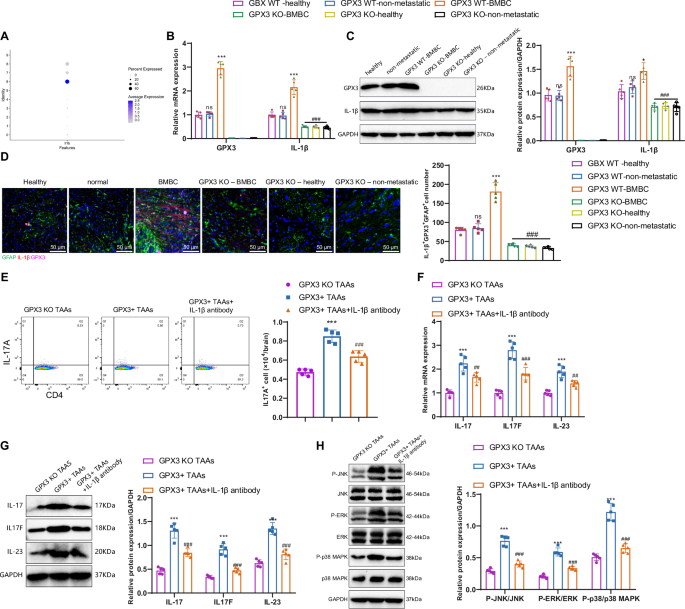
Note: A The expression status of IL-1β in astrocytic subgroups; B, C RT-qPCR and Western blot analysis of GPX3 and IL-1β mRNA and protein expression levels in brain tissues from each group of mice. mRNA levels were normalized to the control group (GPX3 WT – healthy). GPX3 WT – healthy refers to the wild-type healthy control group; GPX3 WT – non-metastatic refers to the group of breast cancer primary site brain metastasis spontaneous model mice without brain metastasis; GPX3 WT – BMBC refers to the group of breast cancer primary site brain metastasis spontaneous model mice with brain metastasis; GPX3 KO – BMBC refers to the group of conditional GPX3 knockout mice with brain metastasis; GPX3 KO – healthy refers to the group of conditional GPX3 knockout healthy control mice; GPX3 KO – non-metastatic refers to the group of conditional GPX3 knockout mice without brain metastasis; D Immunofluorescence analysis of GFAP, GPX3, and IL-1β expression in mouse brain tissues, and quantification of IL-1β + GPX3 + GFAP+ cells; E Quantification of Th17 cells in various cell groups using flow cytometry; F, G RT-qPCR and Western blot analysis of IL-17 (IL17A), IL17F, and IL-23 mRNA and protein expression levels in different groups of cells, with mRNA normalized to the control group (GPX3 KO TAAs); H Western blot to detect the activation levels of MAPK pathway in cells from each group. Count data were presented as Mean ± SD, ns indicates no difference compared to the healthy group; Compared to the normal group or GPX3 KO TAAs group, *P < 0.01, **P < 0.01, ***P < 0.001. Compared to the BMBC group or GPX3+ TAAs group, #P < 0.01, ##P < 0.01, ### P < 0.001. Cell experiments were repeated 3 times; The quantitative data were presented as Mean ± SD, n = 5.
Furthermore, immunofluorescence analysis demonstrated predominant expression of IL-1β in TAAs cells, with a substantial co-localization observed between IL-1β and GPX3, specifically within GFAP+ TAAs cells. Furthermore, there is a greater proliferation of GPX3+ TAAs cells that produce IL-1β in the brains of BMBC mice compared to healthy control mice and normal group mice. However, we observed a decreased quantity of GPX3+ TAAs cells producing IL-1β in GPX3 knockout BMBC mice compared to BMBC mice (Fig. 6D). Both GPX3 and IL-1β play roles in the brain metastasis process, with the production of IL-1β being dependent on GPX3 in TAAs cells.
Subsequently, we conducted in vitro co-cultures of astrocytes and T cells from distinct mouse groups. Flow cytometry results (Fig. 6E) indicated that GPX3+ TAAs cells promoted Th17 cell differentiation compared to GPX3 KO TAAs cells. Inhibition of IL-1β hindered the process of GPX3+ TAAs cells promoting Th17 cell differentiation. The results of qRT-PCR and Western blot analysis (Fig. 6F, G) indicate that GPX3+ TAAs cells, when co-cultured with T cells in vitro, exhibit significantly elevated expression levels of IL-17 (IL17A), IL17F, and IL-23 compared to GPX3 KO TAAs cells. Moreover, under IL-1β antibody intervention, the expression levels of IL-17 (IL17A), IL17F, and IL-23 in T cells significantly decrease following co-culture with GPX3+ TAAs cells. Studies have shown that pro-inflammatory infiltrating Th17 cells can secrete IL-17, thereby activating the MAPK signaling pathway39. We co-cultured astrocytes and T cells from each group of mice in vitro, and Western blot analysis showed that, compared to GPX3 KO TAAs cells, co-culturing GPX3+ TAAs cells with T cells in vitro significantly increased the activation of the MAPK pathway in T cells. In the presence of IL-1β antibody intervention, the activation of the MAPK pathway in T cells was significantly reduced (Fig. 6H).
These in vivo and in vitro experiments demonstrate that GPX3+ TAAs secrete IL-1β, promoting Th17 cell differentiation and further activating the MAPK signaling pathway.
CTCs influence the brain’s immune microenvironment by activating GPX3+ tumor-associated astrocytes and promoting Th17 cell differentiation
CTCs play a crucial role in tumor metastasis, functioning as the precursors for developing metastatic tumors45. To further investigate whether CTCs could activate GPX3+ TAAs cells and thereby influence the immune microenvironment of brain tissue, we performed co-cultures of CTCs isolated from the blood of breast cancer mice with astrocytes. Western blot analysis revealed an elevation in the expression of GPX3 in astrocytes upon adding CTCs (Fig. 7A). This result suggests that CTCs can activate the expression of astrocyte GPX3 through an unknown mechanism. This process leads to the formation of tumor-associated astrocytes with high GPX3 expression, also known as GPX3 + TAA cells. Numerous studies suggest that the initial step in the formation of metastatic niches involves the secretion of various soluble factors and EVs by tumor cells, which in turn regulate communication from the local to distant sites, consequently modifying the local microenvironment46,47.
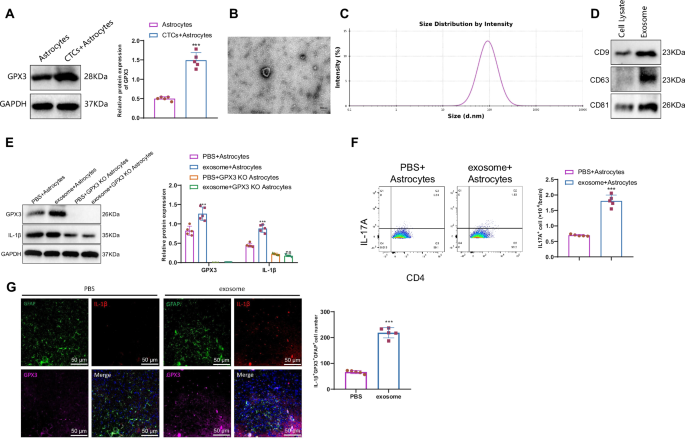
Note: A Western blot analysis of GPX3 protein expression levels in different groups of cells; B, C Transmission electron microscopy and nanoparticle tracking analysis of exosomal size; D Western blot detected the expression of exosome-specific proteins CD9, CD63, and CD81; E Western blot analysis of GPX3 and IL-1β protein expression levels in different groups of cells; F Flow cytometry analysis of Th17 cell numbers in different groups of cells; G Immunofluorescence analysis of GFAP, GPX3, and IL-1β expression in mouse brain tissues (scale bar: 50 µm); ns indicates no difference compared to PBS + GPX3 KO Astrocytes group; *** indicates a difference compared to the PBS+Astrocytes group, P < 0.001; cell experiments were repeated 3 times. The quantitative data were presented as Mean ± SD, n = 5.
To further investigate the mechanism behind the activation of GPX3+ astrocytes by CTCs, we purified exosomes from mouse CTCs. Transmission electron microscopy (TEM) revealed an average exosomal size of approximately 100 nm (Fig. 7B). Moreover, nanoparticle tracking analysis (NTA) was performed to provide additional confirmation of the size of exosomes derived from CTCs (Fig. 7C). Furthermore, Western blot results demonstrated high expression of exosome markers CD9, CD63, and CD81 in exosomes (Fig. 7D).
When exosomes were co-cultured with astrocytes, it was discovered that introducing exosomes resulted in increased expression of GPX3 and IL-1β in astrocytes. However, there was no variation in the expression of IL-1β in astrocytes lacking GPX3 treated with exosomes (Fig. 7E). This finding suggests that cancer cells may induce the expression of GPX3 and IL-1β by releasing exosomes. Furthermore, we investigated its impact on the inflammatory environment of brain tissue. Our flow cytometry experiments showed an increase in the proportion of Th17 cells in the co-culture environment of astrocytes and T cells treated with exosomes (Fig. 7F). These findings suggest that CTCs can enhance the differentiation of Th17 cells and establish an inflammatory microenvironment that supports the metastasis of breast cancer through the activation of GPX3-positive astrocytes.
To simulate the formation of metastatic niches in vivo, we injected exosomes derived from CTCs through the tail vein. Immunofluorescence experiments indicated a pronounced co-localization of IL-1β and GPX3 in astrocytes, with increased expression levels (Fig. 7G).
These experimental results, conducted both in vitro and in vivo, suggest that CTCs have the ability to impact the inflammatory milieu of brain tissue through the secretion of exosomes and the activation of GPX3+ tumor-associated antigen-presenting cells (TAA cells).
GPX3 regulates IL-1β expression through ROS scavenging and activation of HIF-1α in astrocytes during breast cancer brain metastasis
To further investigate the specific molecular mechanism by which GPX3 regulates IL-1β expression, we collected brain tissue samples from spontaneous brain metastasis and non-metastasis mouse models of breast cancer at the primary site. These samples were subjected to untargeted metabolomics analysis. Differential analysis revealed a total of 51 differentially expressed metabolites (Fig. 8A). The metabolites were imported into the MetaboAnalyst website for pathway enrichment analysis. The results indicated enrichment of the metabolites in various metabolic pathways, including Glutathione metabolism, Aminoacyl-tRNA biosynthesis, D-Glutamine and D-glutamate metabolism, Arginine biosynthesis, and Pantothenate and CoA biosynthesis (Fig. 8B, C). GPX3 is a tripeptide that contains thiol groups and interacts with glutamate, cysteine, and glycine to perform a crucial function in glutathione metabolism48.
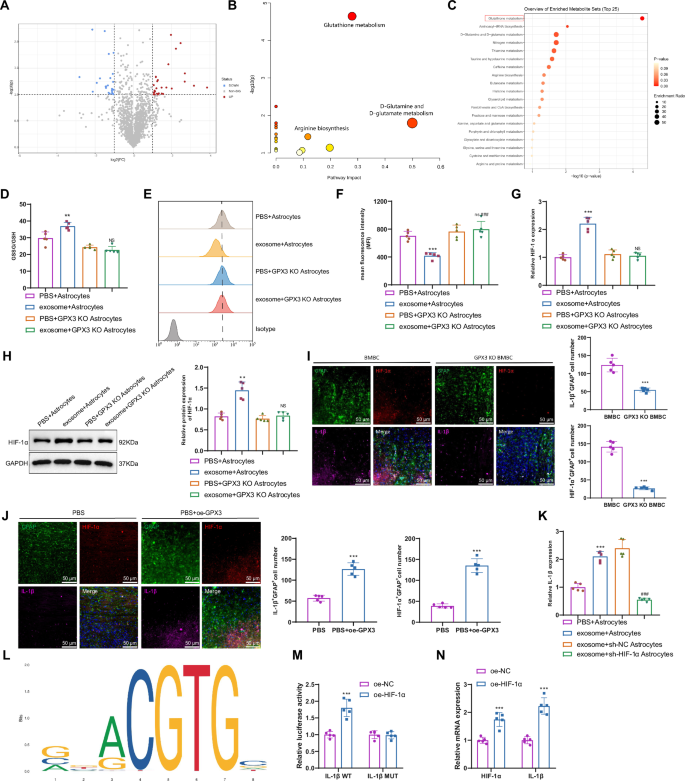
Note: A Volcano plot of differential metabolites between brain tissue samples of mice with spontaneous brain metastasis and those without brain metastasis at the primary site of breast cancer; B Pathway enrichment analysis of differential metabolites in the MetaboAnalyst database; C Function enrichment analysis of differential metabolites in the MetaboAnalyst database; D Determination of GSSG/GSH ratio in exosome-stimulated astrocytes using a glutathione assay kit; Representative histograms E and mean fluorescence intensity (MFI) F showing ROS levels detected by flow cytometry in different groups of cells; G–H RT-qPCR and Western blot analysis of HIF-1α mRNA and protein expression levels in different groups of mouse brain tissues, with mRNA normalized to the control group (PBS+Astrocytes); I, J Immunofluorescence analysis of GFAP, HIF-1α, and IL-1β expression in different groups of mouse brain tissues; K RT-qPCR analysis of IL-1β mRNA expression levels in different groups of cells, with mRNA normalized to the control group (PBS+Astrocytes); L Prediction of HIF-1α binding sites using the JASPAR website; M Dual luciferase reporter gene experiment verifying the binding of HIF-1α and IL-1β; N RT-qPCR analysis of HIF-1α and IL-1β mRNA expression levels in different groups of cells; ns indicates no difference compared to PBS + GPX3 KO Astrocytes group, with mRNA normalized to the control group (oe-NC); Count data were presented as Mean ± SD; Compared to the PBS+Astrocytes group or oe-NC group, *P < 0.01, **P < 0.01, ***P < 0.001; Compared to the exosome+Astrocytes group or exosome+sh-NC Astrocytes group, #P < 0.01, ##P < 0.01, ### P < 0.001; cell experiments were repeated 3 times; n = 5.
Because GPX3 facilitates the conversion of reduced glutathione (GSH) to oxidized glutathione (GSSG), it plays a crucial role as an antioxidant pathway by effectively capturing ROS and safeguarding cells against oxidative damage49,50. The ratio of GSSG/GSH in star-shaped glial cells was higher after exosome treatment of CTCs, as indicated by our detection (Fig. 8D). The results of the flow cytometry experiment demonstrated a decrease in intracellular ROS levels in astrocytes following exosome treatment (Fig. 8E, F). Conversely, no changes were observed in the intracellular ROS levels of GPX3 KO astrocytes, suggesting that GPX3 effectively scavenged the ROS.
To elucidate the impact of ROS on the expression of IL-1β, we searched for pivotal transcription factors implicated in this molecular pathway. Previous studies have demonstrated that ROS could impede the activity of hypoxia-inducible factors (HIF) in both hypoxia-induced and non-hypoxia-induced contexts. Notably, HIF-1α stands out as the foremost representative, playing a pivotal role as a transcription factor in the onset and advancement of cancer51,52.
The expression of HIF-1α in astrocytes increased following exosome treatment, as determined by qRT-PCR and Western blot analysis. In contrast, the knockout of GPX3 decreased the expression of HIF-1α at both the transcriptional and protein levels (Fig. 8G, H). Immunofluorescence experiments revealed significantly lower expression levels of IL-1β and HIF-1α in astrocytes of GPX3 KO BMBC mice compared to BMBC mice. Following overexpression of GPX, the expression of HIF-1α and IL-1β markedly increased (Fig. 8I, J). Furthermore, exosome-induced IL-1β production in astrocytes is inhibited when silencing HIF-1α (Fig. 8K).
To investigate the transcriptional regulation mechanism of the IL-1β gene by HIF-1α, we used the JASPAR website to predict the binding sites of HIF-1α within the IL-1β promoter region (Fig. 8L). Additionally, we identified the binding sites of the transcription factor HIF-1α in the IL-1β promoter region by referring to Supplementary table 6. A mutation was introduced in the binding site between HIF-1α and IL-1β, followed by a dual luciferase reporter assay (Fig. 8M). Overexpression of HIF-1α was found to enhance the luciferase activity of IL-1β WT but had no effect on the luciferase activity of IL-1β MUT. This result indicates a targeted relationship between HIF-1α and IL-1β, with HIF-1α capable of transcriptional activation of IL-1β. Additionally, elevated expression levels of HIF-1α and IL-1β were observed in astrocytes overexpressing HIF-1α (Fig. 8N).
The experiments demonstrate that GPX3 facilitates the production of IL-1β by clearing ROS and activating hypoxia-inducible factor-1 alpha (HIF-1α).
Discussion
Breast cancer is a prevalent malignant tumor among women globally. While progress in screening and treatment approaches has led to enhanced survival rates, the outlook remains discouraging for patients in advanced stages, particularly those with brain metastasis5,6,7. Cerebral metastasis occurs in around 20% of cases and contributes to mortality8,9,10,11.
Astrocytes, which are star-shaped glial cells, potentially play a pivotal role in the process of tumor metastasis15,16,53. For instance, in a mouse model of brain metastasis, Boire et al. (2017) discovered that astrocytes offer metabolic support to the infiltrating tumor cells through ketone production54. Furthermore, in their study, Zhang et al. (2019) suggested that astrocytes can produce specific chemokines, including CCL2, that could attract immunosuppressive macrophages. This process aids tumor cells in evading immune clearance during metastasis55. This research builds upon previous studies and further emphasizes that astrocytes may have a role in the process of brain metastasis in breast cancer. Our study identified that CTCs can activate GPX3+ astrocytes. They also secrete IL-1β, which promotes Th17 cell differentiation and influences the inflammatory milieu in brain tissue.
In our study, we discovered that CTCs can activate GPX3+ astrocytes, leading to the secretion of IL-1β and promoting the differentiation of Th17 cells. This process influences the inflammatory environment of the brain, ultimately facilitating the formation and migration of metastatic niches. Additionally, the results presented in the study demonstrate a significant decrease in Ly6G + Ly6- neutrophils, Ly6G-Ly6C+ monocytes, and FOXP3 + CD4+ regulatory T cells in the brains of GPX3 knockout BMBC mice post-tumor inoculation. The reduction in these three cell types may all contribute to tumor progression. These findings not only enhance our understanding of the involvement of astrocytes in the brain metastasis of breast cancer but also offer a fresh insight into the biological functions of astrocytes. Previous studies predominantly viewed astrocytes as protectors of the brain environment. However, we now understand that they could also deceive their guardians and contribute to tumor metastasis56,57. This discovery offers us a fresh perspective on comprehending the mechanism of brain metastasis in breast cancer. Furthermore, this study presents a novel therapeutic approach involving the targeting of GPX3+ astrocytes or the modulation of astrocytes’ immune properties, potentially leading to the prevention of breast cancer brain metastasis.
In this study, we employed two high-throughput sequencing technologies, namely single-cell RNA-seq and metabolomics, to thoroughly investigate the underlying mechanism of breast cancer brain metastasis. This method enables us to comprehend the transfer process at the single-cell level and also uncovers the metabolic changes that take place during it. The integration of these two technologies unquestionably offers powerful tools to enhance our comprehension and treatment of BM in patients with breast cancer. Metabolomics research has revealed the mutual dependency between localized tumors and the host, leading to an adaptive transcriptional program with spatial exclusivity25. It has been demonstrated that cancer cells can influence the microenvironment of distant organs, creating a supportive niche for metastasis. In this regard, the activation of GPX3+ astrocytes by CTCs may serve as a mechanism by which cancer cells prepare the brain microenvironment for colonization. In general, our study has unveiled a potential novel mechanism of breast cancer brain metastasis. Specifically, CTCs promote differentiation of Th17 cells, alter the immune environment of the brain, and activate GPX3+ astrocytes. These processes ultimately facilitate the formation of metastatic niches in the brain (Fig. 9). Astrocytes play an essential role in maintaining the brain microenvironment, particularly during the process of brain metastasis, where they can either promote or inhibit tumor cell survival. Research has shown that GPX3, through its antioxidant function, can regulate support cells, including astrocytes, impacting oxidative stress levels and subsequently facilitating the survival and metastasis of cancer cells38. This discovery is important for enhancing our understanding of the mechanisms involved in brain metastasis in breast cancer and developing novel treatment strategies.
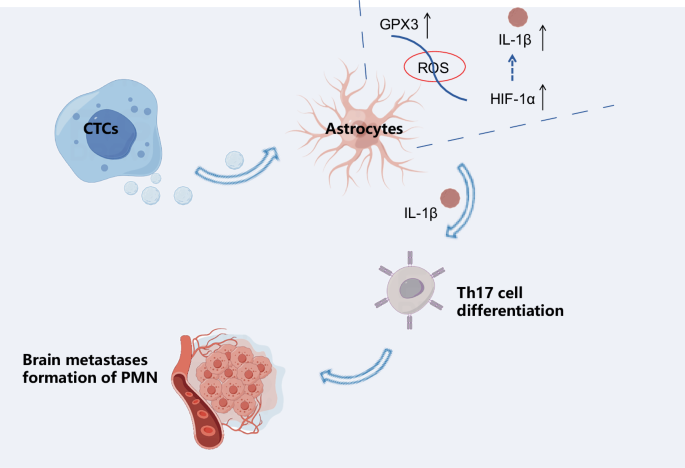
(Created with BioRender.com).
In this study, we confirmed that GPX3 promotes HIF-1α-induced IL-1β expression by inhibiting HIF-1α degradation. To elucidate the impact of ROS on IL-1β expression, we investigated key transcription factors. It is evident that ROS can suppress hypoxia-inducible factors (HIF), prominently HIF-1α, a crucial transcription factor in cancer progression and metastasis. By predicting the binding site of HIF-1α in the IL-1β promoter region using the JASPAR database (Fig. 8K), and conducting dual-luciferase reporter assays and RT-qPCR analyses (Figure 8LM), we observed that overexpression of HIF-1α in astrocytes activated IL-1β transcription levels. Previous studies have not extensively explored the interaction between HIF-1α and IL-1β. However, as mentioned in prior research, IL-1β can upregulate functional HIF-1α protein via the classical inflammatory signaling pathways involving NFkB and COX-2, ultimately promoting the expression of VEGF, a crucial factor for tumor growth and metastasis58. IL-1β plays a role in post-transcriptionally increasing HIF-1α protein levels, contributing to the protective effect on chondrocytes during osteoarthritis59. This suggests a mutual enhancement between the two in various diseases, a relationship yet to be validated in our current experiments. Future studies will include supplementary experiments to investigate the interaction between HIF-1α and IL-1β on Th17 cell differentiation and the formation of metastatic niches in brain tissues.
Clinically, the findings of this study have significant implications. First, GPX3+ astrocytes could serve as a novel therapeutic target. By targeting this cell population, it may be possible to prevent brain metastasis of breast cancer. Secondly, understanding the interaction between astrocytes and CTCs, as well as how astrocytes influence the immune environment within the brain, may help us develop new therapeutic strategies to modify the brain’s immune environment and inhibit breast cancer brain metastasis. Additionally, GPX3 expression levels may serve as a biomarker for predicting the risk of brain metastasis in breast cancer patients.
Despite some important findings, this study has certain limitations. Firstly, although our results demonstrate that increased Th17 cell differentiation in vivo promotes brain metastasis in BMBC mice, further research could provide more direct evidence by exploring the effect of adoptive transfer of Th17 cells isolated from metastatic mice on metastasis susceptibility. Our study is primarily based on mouse models, and the results will need to be validated in larger-scale human samples. Additionally, although we found that GPX3+ astrocytes may play a key role in breast cancer brain metastasis, further studies are needed to explore more characteristics of this cell population and its interaction with CTCs. Lastly, while our study focused on the inflammatory environment in brain metastasis, additional mechanisms may be involved in breast cancer brain metastasis, such as crossing the blood-brain barrier and tumor cell colonization within the brain.
This study points to several future research directions. First, further investigation is needed to understand how exosomal components in CTCs affect GPX3 and IL-1β expression in astrocytes, potentially using transcriptomic sequencing to analyze gene expression within exosomes. Another consideration is to expand this approach to test the GPX3-HIF-1α-IL-1β axis in brain metastasis models originating from different primary tumors to determine if similar mechanisms are at play. Additionally, we plan to isolate CTCs and EVs from these varied metastasis models to enhance experimental validation. Due to experimental conditions and technical constraints, in vivo studies could not be conducted at this stage. Future work aims to optimize CTC extraction and culture methods, allowing us to collect more exosome samples from CTCs for in vivo experiments to evaluate their impact on metastasis susceptibility in non-spontaneous metastasis models.
The rapid and unpredictable nature of tumor metastasis has made it difficult to sample tumors before metastasis occurs. Thus, we were unable to study the process of metastasis progression in a precise, stepwise manner. Using IL-1β in GPX3 knockout mice to rescue the related phenotype could better illustrate the role of GPX3 in promoting IL-1β expression, inducing Th17 cell differentiation, and thereby participating in PMN formation. We have not yet considered whether primary tumors may regulate PMN formation through similar pathways; if so, it could provide significant therapeutic insights. Finally, future studies in larger human sample sizes will be necessary to validate whether GPX3 expression levels can effectively predict the risk of brain metastasis in breast cancer. We hope to explore novel therapeutic strategies, particularly those targeting GPX3+ astrocytes or modulating the immune environment within the brain, to inhibit breast cancer brain metastasis.
Methods
Mice treatment and model establishment
One hundred BALB/c mice and 20 NSG (NOD-PrkdcscidIl2rgem1/Smoc) mice were procured from Shanghai Southern Model Biological Technology Co., Ltd. All animal experiments were approved by the Institutional Animal Care and Use Committee of Shandong Provincial Hospital. All mice were housed in a pathogen-free, environmentally controlled barrier facility with a 12-hour light-dark cycle. Appropriate temperature and humidity levels were maintained in the facility, and the mice had unrestricted access to food and water.
A spontaneous brain metastasis model was established from the primary site of mouse mammary carcinoma by injecting 4T1 cells (5 × 10⁴ cells/50 μL PBS) into the mammary fat pad of the fourth right breast of 5–6-week-old female BALB/c or NSG mice. Intraperitoneal anesthesia was administered before surgery with 3% isoflurane (Sigma product number 26675-46-7). Tumor growth was monitored biweekly using a caliper, and its volume was calculated using the formula: volume = π/6(length × width2). The mice were euthanized after the experiment using the cervical dislocation method. Subsequently, tumors, lungs, axillary lymph nodes, liver, and brain were harvested for ex vivo BLI analysis.60.
The animal groups used in this study were as follows: GPX3 WT – healthy, which refers to the wild-type healthy control group; GPX3 WT – non-metastatic, which refers to the group of breast cancer primary site brain metastasis spontaneous model mice without brain metastasis; GPX3 WT – BMBC, which refers to the group of breast cancer primary site brain metastasis spontaneous model mice with brain metastasis; GPX3 KO – BMBC, which refers to the group of conditional GPX3 knockout mice with brain metastasis; GPX3 KO – healthy, which refers to the group of conditional GPX3 knockout healthy control mice; GPX3 KO – non-metastatic, which refers to the group of conditional GPX3 knockout mice without brain metastasis; Gpx3 KO BMBC+Ctrl protein, Gpx3 KO BMBC+oe-IL17, GPX3 KO BMBC, PBS, and exosome groups, with each group consisting of 10 mice (n = 10).
Bioluminescence Imaging (BLI)
4T1 cells (LV-Luc), stably transduced with firefly luciferase, were inoculated into a complete culture medium in a 96-well plate following the instructions. The cells were allowed to adhere. Prior to imaging, the culture medium was replaced with a medium containing 300 μg/ml of D-luciferin (HY-12591A, MCE). To conduct in vivo bioluminescence imaging, mice were injected intraperitoneally with 150 mg/kg of D-luciferin 10 to 15 minutes before imaging. Anesthesia was induced in mice using 1-3% isoflurane. Subsequently, the mice were positioned on the heated imaging stage of the PerkinElmer IVIS Spectrum small animal live optical 3D imaging system and subjected to continued exposure to 1-2% isoflurane. To ensure consistent signal detection, the anesthetized mice underwent consecutive image captures in the same direction.
For ex vivo bioluminescence imaging, mice were intraperitoneally injected with 150 mg/kg of D-luciferin 10 to 15 minutes before euthanization. Subsequently, the organs were meticulously removed and transferred to a Petri dish with a diameter of 3 cm. A phosphate-buffered saline (PBS) solution containing 300 μg/ml of D-luciferin was prepared. It was allowed to incubate for 5 minutes before proceeding to the imaging step. The total photon flux (expressed in photons/second) emitted from images could be obtained, analyzed, and quantified by defining regions of interest (ROI) using the live image software provided by PerkinElmer60.
H&E staining
Each group of mice was anesthetized separately with 3% isoflurane. The chest was opened, and 0.9% NaCl was rapidly injected into the ascending aorta through the left ventricle. Once the blood was fully drained, 4% polyformaldehyde was added to achieve a final concentration in 0.01 M phosphate-buffered saline (PBS), followed by perfusion. After infusing a stiffening solution into the limbs of the mice, the brain tissue was extracted and then immersed in a 4% paraformaldehyde solution for 24 hours. The brain tissue samples underwent dehydration, transparency, and routine paraffin embedding. Continuous sections, each with a thickness of 4 µm, were cut using a microtome with paraffin. The sections were baked at 60 °C for 1 hour and dewaxed with xylene. Routine H&E staining was performed after hydration. The specimen was stained with Sudan III for 2 minutes, followed by a 10-second rinse with tap water. Subsequently, color separation was performed using a 1% hydrochloric acid ethanol solution for 10 seconds. After rinsing with distilled water for 1 minute, the sample was stained with eosin for 1 minute. It was then briefly rinsed with distilled water for 10 seconds before undergoing gradient alcohol dehydration and xylene transparency. Finally, the sample was embedded in neutral resin for sectioning. Following the sealing process, the alterations in tissue morphology could be examined utilizing the XP-330 optical microscope, supplied by Shanghai Bingyu Optical Instrument Co., Ltd61,62.
Immunohistochemistry (IHC)
Mouse brain tissue sections embedded in paraffin were obtained from each group and deparaffinized in water, followed by dehydration in a graded series of alcohols. Antigen repair solution was used for tissue repair, followed by cooling with tap water. The slide was then treated with a blocking solution of normal goat serum (Catalog number: C-0005, Shanghai Haoran Biotechnology Co., Ltd., China) and incubated at room temperature for 20 minutes. Any excess liquid on the slide was removed by shaking. Tissue sections were then treated with anti-CD31 antibody (ab182981, Abcam, UK) at a dilution of 1:2000, anti-Ki67 antibody (ab15580, Abcam, UK) at concentrations ranging from 0.1 to 5 µg/ml, and anti-GFAP antibody (MA1-35377, Thermo Fisher) at dilutions of 1:25 to 1:100. The samples were stored overnight at 4 °C and subsequently washed three times in 0.1 M PBS for 5 minutes each. Secondary antibodies, including goat anti-rabbit IgG (ab6721, 1:2000, Abcam, UK) and goat anti-mouse IgG (ab150115, 1:200-1:1000, Abcam, UK), were applied to the tissue sections.
The sample was incubated at 37 °C for 20 minutes, after which the Streptavidin-HRP working solution (catalog number: 0343-10000U, EasyMab Biotech Co., Ltd., China) was added. Incubation was continued at 37 °C for an additional 20 minutes. Chromogenic staining was carried out using DAB (Item number: ST033, Guangzhou Weijia Technology Co., Ltd., China), followed by water washing upon completion of the staining process. The sample was restained with Sulumus (catalog number: PT001, Shanghai Bogu Biotechnology Co., Ltd., China) for 1 minute and then rinsed with water. A 1% solution of ammonia water was recommended for restoring the blue color. Alcohol with a specific concentration gradient was employed for the dehydration process. Xylene was the preferred solvent for transparency. The specimen was mounted using neutral resin.
The cells were observed and photographed under a microscope, and the scoring was based on the intensity of cell staining, which was divided into four levels. A score of 0 was assigned for negative staining, indicating no positive result. For light yellow staining, reflecting weak positive results, a score of 1 was assigned. Brownish-yellow staining, indicative of a positive result, received a score of 2. Lastly, brownish-brown staining, demonstrating a strong positive result, was assigned a score of 3. The scoring system was based on the percentage of positive cells, with one point allocated for values less than or equal to 25%, two points for values between 26% and 50%, three points for values between 51% and 75%, and four points for values exceeding 75%. The final result was calculated by multiplying the two scores.36,63.
Tissue dissociation for scRNAseq
scRNA-seq was performed on brain tissues obtained from a spontaneous mouse model with brain metastasis (tumor group, n = 4) and brain tissues from mice without brain metastasis (normal group, n = 4) to identify the primary site of breast cancer metastasis in the brain. The samples were washed with a 0.04% PBS-BSA solution and sectioned into smaller pieces using a surgical knife. Digestion was carried out utilizing papain (P4762, Sigma) at 37 °C for 30 minutes. After digestion, the mixture was centrifuged at 300 g for 5 minutes at room temperature. The supernatant was discarded, and the cell pellets were resuspended in a solution containing a DNase and protein inhibitor dilution. Subsequently, the floating single cells were passed through a 40 μm cell strainer pre-wetted with HBSS. The suspension was then centrifuged at 300 g for 5 minutes at 4 °C. The cell microspheres were resuspended in 10 ml of a 30% Percoll PBS solution and subjected to centrifugation at 700 g for 10 minutes. After the removal of the surface-floating debris of myeloid phospholipids, the cells in cell spheres were resuspended promptly using FACS buffer (PBS with 1% BSA). The samples were treated with the Zombie NIR Fixable Viability Kit (423105, BioLegend, USA) for a live/dead discrimination assay. FACS sorting was conducted utilizing the BD FACS Aria II cell sorter. Cells were sorted into a capture medium (PBS containing 0.04% BSA). The study employed the CountessTMII automated cell counter and Trypan blue staining to enumerate single-cell samples. Once the cell viability exceeded 80%, in accordance with the manufacturer’s guidelines, the cells were loaded onto the 10x Genomics Chromium chip64.
Analysis of scRNA-seq datasets
GEMs (Gel Bead-In-Emulsion) were formed by combining a single-cell suspension, gel beads, and oil using the 10x Genomics Chromium Controller. Following the formation of droplets, the sample was transferred into PCR tubes and underwent reverse transcription using a T100 Thermal Cycler (Bio-Rad). This process involved incubation at 53 °C for 45 minutes, followed by a 5-minute incubation at 85 °C, and a final incubation at 4 °C. The generation of cDNA was succeeded by amplification, and the quality was assessed using Agilent Bioanalyzer 2100. Libraries were constructed utilizing the P5 primer, Read 2 (which reads the sequencing primer site), Sample Index, and the P7 primer. Quality control was performed on the obtained library and subsequently sequenced using Illumina HiSeq4000 PE125.
The scRNA-seq data was further analyzed by employing 10x Cell Ranger (version 2.2.0). The base-call files (BCLs) from the Illumina sequencer were converted to FASTQ files, followed by a series of processing steps, including alignment, filtering, barcode extraction, and unique molecular identifier (UMI) counting. The reads were aligned to the mouse reference transcriptome (mm10) using STAR (Spliced Transcripts Alignment to a Reference). Primary quality control (QC) was conducted by Cell Ranger to produce high-quality data64.
Single-cell transcriptome analysis
The single-cell data were analyzed using the “Seurat” package in the R software. Quality control was performed based on the criteria of nFeature_RNA > 200 and nFeature_RNA < 5000. To reduce the dimensionality of the scRNA-Seq datasets, variance-based Principal Component Analysis (PCA) was applied, selecting the top 4000 genes with high variability. The suitable number of principal components for further analysis was determined using the Elbowplot and JackStrawPlot functions from the Seurat package. Clusters were identified using the FindClusters function from Seurat, with the resolution set at the default value of 1. Subsequently, the scRNA-seq sequencing data underwent dimensional reduction using the UMAP algorithm. Marker genes specific to individual cell subtypes could be identified using the Seurat package. Finally, the “SingleR” package was integrated with the online resource CellMarker to annotate cells and extract target cell populations for subsequent re-clustering analysis65,66.
Generation of conditional gene knockout GPX3 KO mice
The solution was prepared by dissolving Tamoxifen (10540-29-1, Sigma) in corn oil (8001-30-7, MCE) at a concentration of 20 mg/ml. The mixture was thoroughly shaken overnight at 37 °C and stored at 4 °C until injection. Slc6a11-CreERT2 transgenic mice were crossed with Gpx3-Flox mice. The tamoxifen injection dosage for the hybrid mice was determined based on their body weight at 6 weeks of age, typically around 75 mg/kg. Tamoxifen was administered intraabdominal once every 24 hours for 5 consecutive days. The injection site was disinfected with 70% ethanol before administration. After the final injection, the mice were isolated for 24 hours. The experimental group comprised Slc6a11-CreERT2-Gpx3 knockout mice (Gpx3 KO mice), while the control group consisted of Slc6a11-CreERT2 mice. Slc6a11-CreERT2 mice (NM-KI-200130) and Gpx3-Flox mice (NM-CKO-2119250) were obtained from the Shanghai Model Organisms Center, Inc67.
The cultivation of breast cancer cells
Breast cancer cells, called 4T1 cells (catalog number CRL-2539), were obtained from the ATCC company. These cells were derived from BALB/c mice and exhibit tumor growth and metastatic spread that closely mimic human breast cancer. The 4T1 cells were cultured in RPMI-1640 medium (ATCC catalog number: 30-2001) supplemented with 10% fetal bovine serum (ATCC catalog number: 30-2020), and maintained at 37 °C with 5% CO2. The culture medium was changed twice a week, and 4T1 cells from the 4th to 8th passage were used for subsequent experiments.
The extraction and identification of primary astrocytes
The wild-type and GPX3 KO mice were anesthetized using 3% isoflurane and euthanized by cervical dislocation. The mouse skull was promptly removed from a sterile workbench before carefully extracting the brain. The brain was then washed three times in PBS and finely chopped. Subsequently, digestion was carried out by treating the sample with collagenase IV (Catalog number: C4-BIOC, 1 mg/ml, Sigma) at 37 °C for 1–2 hours. The digested tissue was obtained as a single-cell suspension by passing it through 40 µm and 70 µm cell strainers (BD Falcon, BD Biosciences). The single-cell suspension was then transferred to a culture dish and supplemented with DMEM + 10% FBS. The cells were cultivated under conditions of 37 °C and 5% CO2. Once the cell growth density reached 80% or higher, an immunofluorescence analysis was conducted. The purity of astrocytes was assessed using a GFAP immunofluorescence assay combined with DAPI staining (Supplementary Fig. 1A). The purity of astrocytes was calculated as the ratio of GFAP-positive cells to DAPI-positive cells, with a purity level of 95% deemed suitable for subsequent experiments68.
The astrocytes were cultured in 6-well plates, while T cells seeded in 8.0 µm Transwell inserts were placed in the upper chambers of the wells, allowing co-culture with astrocytes in the lower chambers at 37 °C under 5% CO2, with the addition of 1 ng/ml Anti-IL-1 beta antibody for treatment69. The culture media was refreshed every 24 hours70.
Enrichment and culture of CTCs
Approximately 0.5-1 mL of mouse blood samples were collected using a standard cardiac puncture technique and immediately transferred into anticoagulant tubes containing EDTA. The blood samples were then combined with Ficoll-Paque PLUS from GE Healthcare, and the leukocytes were separated through density gradient centrifugation at 400 g for 30 minutes at room temperature. CD45 magnetic beads antibody (Product no: 11153D, Thermo Fisher) and the MACS magnetic bead sorting system (Miltenyi Biotec, Germany) were employed to adsorb and eliminate white blood cells under the influence of a magnetic field, thus enriching the precipitated CTCs.
The CTCs were placed in RPMI 1640 medium (Catalog No: HY-K3004, MCE), supplemented with 20 ng/ml epidermal growth factor (EGF, Catalog No: HY-P72983, MCE), 20 ng/ml basic fibroblast growth factor (FGF2, Catalog No: HY-P7066, MCE), B27 supplement (Catalog No: 17504044, Thermo Fisher), and 1% antibiotics (Catalog No: 15240096, Thermo Fisher). The cells were then cultured at 37 °C, 5% CO2, and 3% O2 in a CO2 incubator. Once the CTCs multiplied, they were transferred for culturing under standard oxygen concentration. An immunofluorescence analysis was conducted once the density of cell growth reached 80% or higher.
The purity of CTCs was determined using EpCAM immunofluorescence combined with DAPI staining, with a cell purity of 90% deemed suitable for subsequent experiments (Supplementary Fig. 1B).
When CTCs reached 70–80% confluency, the upper chambers of 8.0 µm Transwell inserts seeded with astrocytes were placed into 6-well plates for co-culture with the lower chamber CTCs at 37 °C under 5% CO2, with media refreshed every 24 hours71.
Extracellular Vesicle Isolation and Identification
After CTCs were cultured, the total exosome isolation reagent (4478359, Thermo Fisher) was added to the culture medium at a ratio of 2:1. Following this, the samples were thoroughly mixed and incubated overnight at temperatures ranging from 2 °C to 8 °C. The samples were then centrifuged at a speed of 10,000 for 1 hour under a temperature range of 2 °C to 8 °C. Upon aspirating and discarding the supernatant, the pellets were resuspended in 1× PBS. The separated exosomes (Exo) were subsequently stored at a temperature of 2 °C to 8 °C for one week.
Exosome treatment was carried out by adding pre-extracted and purified exosomes (50 μg/mL) to the culture medium once astrocytes had reached 70-80% confluency. The cell culture medium, along with EVs, was combined with astrocytes and incubated at 37 °C with 5% CO2. The levels of reduced glutathione (GSH) and oxidized glutathione disulfide (GSSG) were measured using the GSH and GSSG assay kit (S0053, Bi Yun Tian)35,72. C6 glioma cells were incubated with a phosphate-buffered saline (PBS) solution containing 5 μM DCFH-DA at 37 °C in the absence of light for 30 minutes. After that, the cells were collected using a 0.05% trypsin-EDTA solution. Subsequently, the cells were resuspended in a fresh culture medium, and their ROS levels were analyzed using a flow cytometer73.
Identification of Exosomes using transmission electron microscopy (TEM): 10 μL of Exosomes (concentration: 100 μg/mL) were dropped onto a cover slip, with a copper grid Formvar membrane facing downwards on the suspension. Each Exosome sample was prepared on 2–3 copper grids. The sample was covered, and the copper grids were allowed to absorb for 20 minutes in a dry environment. Subsequently, 100 μL of PBS was added to the cover slip. Using forceps, the copper grids (with the Formvar membrane facing downwards) were placed on the PBS droplet for 5 minutes and washed twice. Throughout all steps, the Formvar membrane side was kept moist while the other side remained dry. The copper grids were placed on a 50 μL drop of 1% glutaraldehyde for 5 minutes. Following this, the copper grids were placed in 100 μL double distilled water for 2 minutes (repeating the washing process 8 times). Next, the copper grids were placed in a 50 μL drop of uranyl acetate solution for 5 minutes. Then, the copper grids were placed in a 50 μL drop of methyl cellulose-UA for 10 minutes with the procedure conducted on ice. Excess liquid was gently removed using a stainless steel loop to leave a thin layer of methyl cellulose film on filter paper and air-dried for 10 minutes. After drying, electron microscope images were captured at 100 KeV.
For Exosome size analysis using Nanoparticle Tracking Analysis (NTA), exosomes were suspended in 1 mL of PBS, with filtered PBS used as a control. The diluted exosomes were then injected into the NanoSight LM10 instrument for particle size measurement. The NTA measurement conditions were set at 23.75 ± 0.5 °C, with a measurement time of 60 s74.
Extracellular vesicle proteins were extracted using RIPA lysis buffer with 4% protease inhibitor (P0013B, Biyuntian) following the manufacturer’s instructions. The protein concentration was determined using the Beyotime BCA protein assay kit (P0010S). Equivalent amounts of protein samples were separated on a sodium dodecyl sulfate-polyacrylamide gel (SDS-PAGE) and then transferred using a wet method onto a PVDF membrane (FFP24, Beyotime). The membrane was blocked with 5% skim milk in TBST (5 mL) at room temperature for 1 hour, followed by overnight incubation at 4 °C with primary antibodies against CD9 (ab307085, Abcam), CD81 (ab109201, Abcam), and CD63 (AB315108, Abcam). Subsequently, the membrane was washed with TBST and then incubated at room temperature for 1 hour with a goat anti-rabbit secondary antibody labeled with horseradish peroxidase (A0208, Beyotime). The membrane was treated with an ECL chemiluminescence detection kit (P0018FS, Beyotime) and visualized using the ECL chemiluminescence detection system (Bio-Rad’s ChemiDoc XRS+). The experiment was repeated three times75.
Cell transfection
The star-shaped glial cells were digested with trypsin in the logarithmic phase. Subsequently, the cells were seeded in 6-well plates at a density of 1 × 10⁵ cells per well. After 24 hours of regular cultivation, when the cell fusion rate reached approximately 75%, the instructions provided by Thermo Fisher (11668019) for cell transfection using Lipofectamine 2000 were followed. The transfected plasmids used in the experiments included oe-NC, oe-HIF-1α, sh-NC, and sh-HIF-1α, with specific sequences available in Supplementary table 1. Transfection efficiency was assessed using RT-qPCR 48 hours after transfection. The plasmid, obtained from Shanghai Gima Biotech Company, had a concentration of 50 ng/mL76.
Flow cytometry
The collected brain tissue was added to a tissue culture dish containing 10 mL of flow cytometry staining solution. A 3 mL syringe was used to compress the tissue and disintegrate it into a suspension of individual cells. The cell strainer was positioned on the rim of a 15 mL conical tube to facilitate the transfer of cells from the tissue culture dish, effectively removing cell clumps and debris. Subsequently, the cell suspension was centrifuged at 300–400 × g for 5 minutes at a temperature between 2 and 8 °C. The liquid above the settled cells was removed, and the cells were mixed with an appropriate amount of staining solution for flow cytometric analysis. A purified Fc receptor binding inhibitor (20 μL) was added to each 100 μL of single-cell suspension to block nonspecific Fc receptor-mediated interactions. The mixture was incubated at 2–8 °C or room temperature for 10–20 minutes. The specified antibodies were combined with the appropriate flow cytometry staining buffer volume to achieve a final volume of 50 μL for the antibody mixture. The mixture was then added to the cells and gently vortexed. It was incubated at room temperature, avoiding light, for 20–30 minutes. The antibodies used encompass CD4+T cells (CD45 + CD4+), CD8+ T cells (CD45 + CD8+), regulatory T cells (FOXP3 + CD4+), Th17 cells (CD45 + IL-17A+), B cells (CD45 + CD19+), macrophages (CD45 + CD11b + F4/80+), myeloid-derived suppressor cells (MDSCs) (Ly6C + Ly6G-), and granulocytic cells (Ly6C- Ly6G+). For detailed antibody manufacturer information, please refer to the respective sources. Detailed information on antibody manufacturers can be found in Supplementary table 2.
After two washes, flow cytometry analysis was conducted using the FlowJo software on BD LSR Fortessa (BD Biosciences) and SONY ID7000 instruments. The cells were washed, fixed, and permeabilized to enable intracellular staining using the Foxp3 Fix/Perm Buffer Kit (00-5523-00, Thermo Fisher). FlowJo software (BD Biosciences) was used for the analysis of fluorescence intensity obtained from the fluorescence-activated cell sorter LSR Fortessa36.
Immunofluorescent staining
Paraffin-embedded sections of mouse brain tissue were obtained from each group. The sections were deparaffinized in water and dehydrated in a graded series of alcohols. An antigen retrieval solution was utilized for water bath retrieval, which was then cooled using tap water. The sample was washed with a 0.5% Triton X-100 solution (X100, Sigma) for 10 minutes, then blocked with a mixture of 5% bovine serum albumin (BSA) (SRE0098, Sigma) and 0.5% Triton X-100 in PBS at room temperature for 1 hour. The sections were incubated with the primary antibody at 4 °C overnight, followed by three washes with PBS at room temperature. Subsequently, the sections were incubated with the secondary antibody at room temperature for 1.5 hours. Manufacturer information for the primary and secondary antibodies can be found in Supplementary table 3. After cleaning, the slices were installed and covered in a culture medium containing DAPI (D9542-1MG, Sigma). The slices were observed using the Olympus Fluoview-3000 confocal microscope (Olympus Optical, Ltd, Japan), and quantitative analysis was conducted using Fiji software (National Institutes of Health, USA)77.
Dual-Luciferase reporter assay
HIF-1α and IL-1β binding sites were predicted using the JASPAR website. The wild-type (WT) sequence of IL-1β containing the HIF-1α binding site was inserted into the pmirG10 luciferase reporter vector to create the wild type (WT) plasmid (IL-1β-WT). Simultaneously, a mutant plasmid (IL-1β-MUT) without the HIF-1α binding sequence was generated in the same manner. Astrocytes were co-transfected with the above reporter plasmids and either oe-NC or oe-HIF-1α. After 48 hours of co-transfection, the cells were subjected to luciferase/renilla assays using the Dual-Luciferase Reporter Assay System (E1910, Promega). The firefly luciferase values were normalized to renilla luciferase values (by calculating the ratio of dual fluorescence, with the ratio of the control group set as 1 unit, providing the relative luciferase activity of different treatment groups)78.
Metabolomics analysis
100 mg of brain tissue sample ground using liquid nitrogen was placed into an EP tube. An 80% methanol-water solution (500 μL) was added, and the mixture was vortexed and shaken, followed by incubation in an ice bath for 5 minutes. Subsequently, the sample was centrifuged at 15000 × g and 4 °C for 20 minutes. A specific volume of the supernatant was taken and diluted with mass spectrometry-grade water to achieve a methanol content of 53%. After centrifugation at 15,000 × g and 4 °C for 20 minutes, the resulting supernatant was collected. The supernatant was transferred into the small bottle placed in the auto-sampler.
The plasma metabolomics analysis was conducted using the LC20 high-performance liquid chromatograph (Shimadzu, Japan) in conjunction with the Triple TOF-6600 mass spectrometer (AB Sciex). For chromatographic analysis, the Waters ACQUITY UPLC HSS T3 C18 (100 × 2.1 mm, 1.8 μm) chromatographic column was used. The column was maintained at a temperature of 40 °C, and elution was performed at a flow rate of 0.4 mL/min. The mobile phase consisted of an aqueous solution of acetonitrile with 0.1% formic acid. The gradient elution program for mobile phase B included the following steps: 5% mobile phase B from 0.0 to 11.0 minutes, 90% mobile phase B from 11.0 to 12.0 minutes, and 5% mobile phase B from 12.0 to 14.0 minutes. The shower gel was introduced into the mass spectrometer without undergoing fragmentation79.
The mass spectrometry conditions involved an ionization voltage of 5500 V, a capillary temperature of 550 °C, a nebulizer gas flow rate of 50 psi, and an auxiliary heating gas flow rate of 60 psi. In order to prevent overfitting, the preprocessed data was analyzed using orthogonal partial least squares-discriminant analysis (OPLS-DA) and permutation tests (with 100 permutations). Metabolites that achieved a VIP > 1 and had p-values < 0.05 in the OPLS-DA model were categorized as differential metabolites (DMs). Additionally, metabolites with fold changes ≥2 or ≤0.5 and p-values < 0.05 in the Student’s t-test were selected as the final differential metabolites. MetaboAnalyst version 5.0 was employed to identify pertinent metabolic pathways80.
Western Blot
Proteins were extracted from mouse brain tissue and astrocytes using Solibao’s Organelle Protein Fast Extraction Kit (EX2410) and Fixed Cell Protein Extraction Kit (EX2170). Protein concentration was determined using Sigma’s BCA Protein Assay Kit (BCA1-1KT). SDS-PAGE electrophoresis was performed with equal amounts of protein (20 µg per lane) using a 10–12% gel. Subsequently, the protein was transferred onto a polyvinylidene fluoride (PVDF) membrane obtained from EMD Millipore (Billerica, USA). The sample was incubated with a 5% BSA solution for 2 hours. Following this, the sample was washed using PBS and proceeded to an overnight incubation at 4 °C with the primary antibody (Supplementary Table 4 for detailed information on the primary antibody). After washing, the membranes were incubated with goat anti-rabbit IgG (ab6722, dilution 1:200-1:1000) and goat anti-mouse IgG (ab150115, dilution 1:200–1:1000) from Abcam at room temperature for 2 hours. The enhanced chemiluminescence system (iBright FL1500) from Thermo Fisher was then used for image development. The GAPDH antibody from Abcam (ab9485) was used as a reference, diluted at 1:250081. The experiment was repeated three times. Please refer to supplementary Figures 8–40 for all original WB images.
RT-qPCR
The total RNA was extracted from mouse brain tissue and astrocytes using Thermo Fisher’s Tissue RNA Extraction Kit (12183018 A) and Cell RNA Extraction Kit (12183020) in accordance with the provided instructions. The reverse transcription of 1 μg of total RNA into cDNA was carried out using the First Strand cDNA Synthesis Kit (K1622) from Fermentas (USA). RT-qPCR detection was conducted using the Fast SYBR Green PCR Master Mix (Applied Biosystems, Thermo Fisher) and the ABI PRISM 7500 RT-PCR system. Three repetitions were set for each well. The relative expression level of mRNA could be calculated using the 2 method. Here, ΔΔCt was determined by subtracting the average Ct value of the target gene in the experimental group from the average Ct value of the reference gene in the experimental group and then subtracting the average Ct value of the target gene in the control group from the average Ct value of the reference gene in the control group. The internal reference was GAPDH. The RT-qPCR reaction was carried out using the StepOnePlus system developed by Applied Biosystems. The reaction conditions included a single cycle at 95 °C for 15 minutes, followed by 40 cycles of 10 seconds at 95 °C and 60 seconds at 60 °C82. The primer sequences utilized in the experiment are available in Supplementary Table 5. The reagents and consumables necessary for the experiment were procured from Wuhan Synergy Biotechnology Co., Ltd.
Statistical analysis
Statistical analysis was performed using IBM SPSS Statistics version 21.0 (IBM SPSS Statistics, Chicago, Illinois, USA). Measurement data were expressed as Mean ± SD. For comparing two groups of non-paired data that were normally distributed and had equal variances, the non-paired t-test was utilized. One-way ANOVA was employed to compare data among multiple groups, followed by Tukey’s post hoc test. Survival analysis was conducted using the Kaplan-Meier method and the Log-Rank test. A statistical difference was defined as P < 0.05.

Responses