Multidimensional terahertz probes of quantum materials
Introduction
The physics of quantum materials is one of the frontiers of modern condensed matter physics1. It presents a broad, formidable challenge, in particular due to the interaction of numerous degrees of freedom and their dynamical fluctuations, yet resolving these microscopic physics promises an unprecedented understanding of these quantum materials. How quantum materials cross phase boundaries in equilibrium, and how they are driven into new phases of matter with no equilibrium counterpart are questions essential to realizing their imaginable functionalities2,3.
To this end, important messengers of the underlying physics are changes in their excitation spectra that accompany structural and electronic rearrangements, which typically occur in the terahertz (1012 Hz) frequency range4,5. Yet our understanding and exploitation of material properties in the terahertz frequency range has been hindered by the challenges of generating, detecting, and manipulating light at these frequencies6 for spectroscopic applications. In particular, many aspects of coupling between different degrees of freedom, complex many-body interactions, and dynamical phenomena remain hidden in conventional terahertz spectroscopies7,8,9 sensitive only to two-point correlations of relevant observables.
In contrast, sophisticated techniques have been developed at microwave frequencies for nuclear magnetic resonance (NMR) spectroscopy10,11 to access higher-order correlations of spin degrees of freedom. Various excitation schemes are routinely used to distill material nonlinearities, and have also been translated to the visible and near-infrared frequency ranges12,13. In particular, multidimensional coherent spectroscopy at optical frequencies14 has emerged as the preeminent method for disentangling complex electronic dynamics in chemical and biological systems15, allowing spectroscopists to dissect material nonlinearities into their individual constituent terms16.
Significant efforts have now been made to extend multidimensional techniques into the terahertz frequency range towards two-dimensional terahertz spectroscopy (2DTS)17. Since its first demonstration over a decade ago18, the growing accessibility of strong-field terahertz light sources has led to applications of 2DTS in a wide variety of material systems19,20,21,22,23,24,25,26,27,28,29,30. But perhaps their most intriguing applications lie in quantum materials, whose spectacular emergent properties arise precisely from the electronic correlations that 2DTS excels at resolving. In this Perspective, we introduce 2DTS as a powerful new technique for studying the intrinsic properties of quantum materials and discuss future opportunities for applying 2DTS as an ultrafast probe of quantum materials dynamically driven out of equilibrium with light31.
Basics of 2-D terahertz spectroscopy
The basics of 2-D spectroscopy at infrared and optical frequencies are well-established and has been described extensively in the literature from a quantum level-system perspective12,13. On the contrary, low-energy collective excitations of quantum materials are often described by effective coordinates and their equations of motion4. Our starting point will therefore be the generic potential energy of a coordinate x, which takes the form:
where ω0 is its resonance frequency dictated by the harmonic potential and z* is the effective charge that determines dipolar coupling of the coordinate to an external time-dependent electric field E(t). In the following we provide a brief introduction to the nonlinearities of a classical oscillator and their corresponding 2-D spectra, which will then lend intuition to the unique physics underlying various features that we describe later.
Self-anharmonicity
As a heuristic example, we take a quartic potential nonlinearity of the form:
where a is an anharmonic coefficient that determines the strength of the nonlinearity. We will assume the case of a ‘soft spring’ (a > 0), which describes, for example, the Josephson plasma resonance in layered superconductors32,33,34.
In its most common realization, 2DTS involves two identical terahertz excitation pulses (denoted EA and EB) that cooperatively drive a nonlinear response of the coordinate (shown in Fig. 1a). This nonlinear signal is then generically a function of two variables, the inter-pulse time delay τ and the real laboratory time t that evolves following interaction with the second pulse EB. In the harmonic oscillator limit (a = 0), the superposition principle dictates that the coordinate response to EA + EB is simply the summation of the individual responses to EA and EB alone. With the nonlinearity included however, the superposition principle is broken by a displacement-dependent resonance frequency35
Despite the simple nature of the underlying quartic potential, an infinite hierarchy of nonlinear coordinate responses scaling with ({E}_{A}^{n}{E}_{B}^{m}) (where n + m is odd) results to arbitrary order36. Here we will only consider the most commonly measured third-order (n + m = 3) coordinate response composed of six contributing nonlinearities, four that emit at the fundamental resonance frequency ω0 and two that emit at triple its value 3ω0 (third-harmonic generation). We further restrict our focus to only the four former terms, as the third-harmonic nonlinearities typically contain redundant information34.
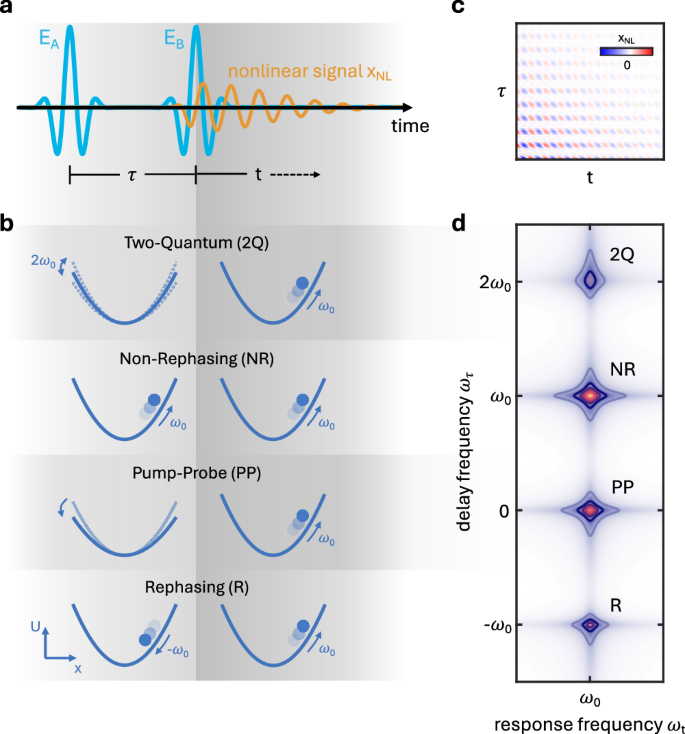
a Terahertz excitation pulse sequence involving two nominally identical fields EA and EB separated by a time delay τ. A nonlinear signal xNL then evolves along the real laboratory time t. b Illustrations of the four third-order nonlinearities with a response frequency of ω0 that result from a soft quartic anharmonicity. Note that the two remaining third-harmonic generation nonlinearities occur, but are not shown here. c Nonlinear signal xNL in the time-domain as a function of {τ, t}, which exhibits intricate oscillatory behavior due to interference between the multiple nonlinearities. d Fourier transform of the time-domain signal in c, showing four distinct peaks corresponding to the four nonlinearities illustrated in b as indicated.
To interpret such impulsive nonlinearities, it is most natural to consider the dynamics driven by EA and EB sequentially. Beginning with the arrival of EA, its interaction with the system results in two primary consequences for the subsequent interaction with EB a time τ later (illustrated in Fig. 1b). First, it can immediately be seen from (3) that the resonance frequency is both rectified and modulated at twice the resonance frequency 2ω037. Second, EA introduces a time-dependent initial condition that either enhances or suppresses the response to EB (beyond a simple superposition of the two individual responses). To emphasize, these nonlinearities occur simultaneously and share a common response frequency ωt = ω0, resulting in overlapping signatures in one-dimensional spectra. As will be shown in the following however, this ambiguity is lifted in a two-dimensional spectrum.
Two-dimensional spectrum
To isolate the nonlinearities cooperatively driven by both EA and EB from their individual responses, one measures a nonlinear signal defined by
The equation of motion resulting from (2) may be straightforwardly solved36 as a function of {τ, t} to obtain xNL(τ, t), which exhibits complex oscillatory dynamics along both time axes as shown in Fig. 1c. Interpretation of these dynamics is difficult in the time-domain, but becomes tractable in the frequency-domain. To this end, two-dimensional Fourier transform of xNL(τ, t) correlates the dynamics along τ and t in a two-dimensional (2-D) spectrum shown in Fig. 1d.
In the two-dimensional (2-D) spectrum, four peaks appear at a response frequency ωt = ω0, corresponding to the four nonlinearities described above. Two peaks appear at delay frequencies ωτ = 0 and ωτ = 2ω0, corresponding to rectification and parametric modulation of the resonance frequency, and are denoted the ‘Pump-Probe’ and ‘Two-Quantum’ peaks respectively. The two other peaks appearing at ωτ = ω0 and ωτ = − ω0 then arise from in-phase or out-of-phase modulation (by the first excitation pulse EA) of the nonlinear signal (stimulated by the second excitation pulse EB), and are denoted the ‘non-rephasing’ and ‘rephasing’ peaks respectively. These nonlinearities, illustrated in Fig. 1b and designated with terminology borrowed from atomic and molecular physics12,13, are summarized in Table 1 along with their excitation field scaling (in terms of positive and negative frequency components EA/Beiωt and ({E}_{A/B}^{* }{e}^{-iomega t})) and frequency coordinates. We emphasize that, despite the apparent simplicity of (2), these spectral features are generic for the third-order nonlinearity of an anharmonic oscillator and bear direct correspondence to their quantum level system counterparts. The classical description of their underlying mechanisms described here then lends intuition to how the various physics of quantum materials manifest in different features of a 2DTS spectrum, which will be the focus of the following section.
2DTS of quantum materials: in equilibrium
In the previous section, we considered an anharmonic oscillator whose nonlinearity derives solely from a quartic potential nonlinearity. While instructive, this model can never realistically capture the physics of quantum materials. For example, collective excitations in real solids are dispersive, are affected by thermal fluctuations, couple to other degrees of freedom, and can suffer from material disorder. While such complications are difficult to disentangle with conventional spectroscopic probes, their effects naturally separate into unique features in a 2-D spectrum.
Different peaks, different physics
In 2-D spectra of quantum materials, different aspects of their microscopic physics distort specific peaks away from their generic forms shown in Fig. 1d. Examples of such phenomena are illustrated in Fig. 2 and summarized below for each peak.
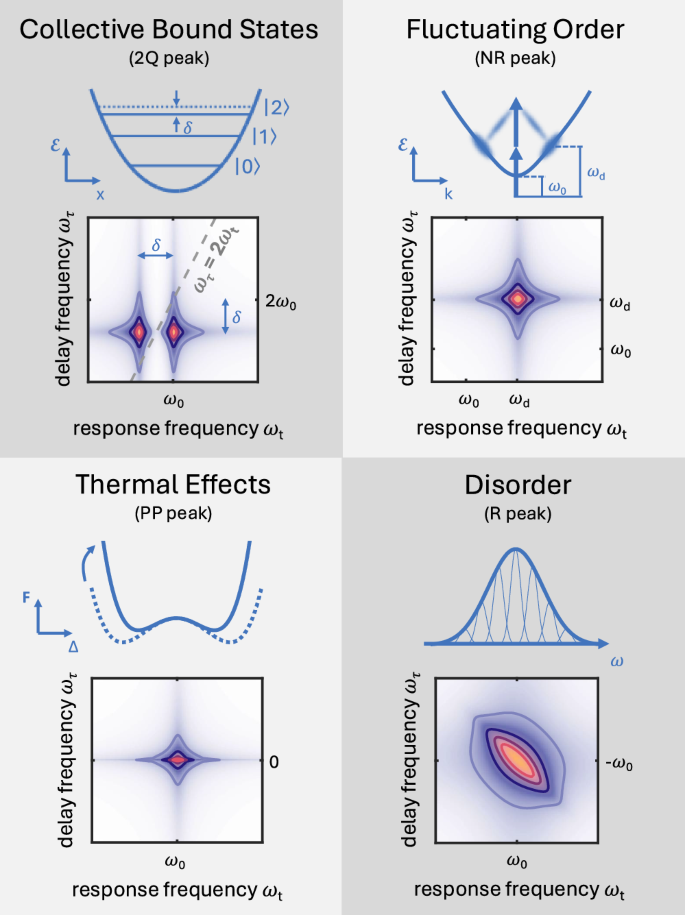
Top left: The two-quantum (2Q) nonlinearity probes doubly-occupied states of a quantum oscillator, and exhibits unique signatures of quasiparticle bound states of binding energy δ. Top right: The non-rephasing (NR) nonlinearity is sensitive (though not uniquely) to finite-momentum fluctuations, resulting in a peak position determined by the driving frequency ωd rather than the resonance frequency ω0. Bottom left: The pump-probe (PP) nonlinearity captures all incoherent (non-oscillatory) processes. Most notably all thermal effects are isolated in this peak, leaving only non-thermal coherent dynamics elsewhere in the 2-D spectrum. Bottom right: The rephasing nonlinearity is unique in its sensitivity to disorder. In the absence of disorder the rephasing peak is symmetric while in the presence of disorder the rephasing peak elongates as shown.
Two-quantum (2Q)
The two-quantum nonlinearity, as its name suggests, tracks dynamics evolving at (or near) twice the excitation photon frequency. These dynamics may arise classically, for example from parametric modulation of the resonance frequency (as illustrated in Fig. 1b). They may also be of quantum mechanical origin, arising from quantum coherences between two quasiparticle excitations and an unoccupied ground state38. Such two-quantum nonlinearities have been observed, for example, for magnetic excitations in orthoferrites39,40 and Josephson plasmons in layered cuprates28. In quantum materials, the two-quantum nonlinearity is particularly important for probing material anharmonicities41, which can result in bound states of collective excitations such as bimagnons42 or biphonons43. As illustrated in Fig. 2, for a binding energy ℏδ exceeding the resonance linewidth, the two-quantum nonlinearity (1) shifts vertically along ωτ by δ and (2) splits horizontally along ωt into two peaks separated by δ. The two resultant peaks then correspond to a transition back into the unoccupied ground state (ωt = ω0) and dissociation of the collective bound state into single quasiparticles (ωt = ω0 − δ).
Non-rephasing (NR)
The non-rephasing nonlinearity is the strongest nonlinearity for a classical anharmonic oscillator, as in-phase excitation between EA and EB cooperatively drive the coordinate to the largest amplitude (strongest effect of anharmonicity). Besides its role in generating absorptive 2-D spectra (useful when conventional 2-D spectra are congested with overlapping peaks44), the non-rephasing nonlinearity is also sensitive to fluctuating order. In a recent theoretical study, Salvador et al. have predicted34 non-rephasing 2-D spectra of the Josephson plasma resonance to contain signatures of superconducting fluctuations. To see this, one must consider a nonlinear excitation process (beyond the mean-field approximation) illustrated in the top right panel of Fig. 2, in which two electric field interactions drive pairs of finite-momentum plasma waves at equal and opposite momenta45. In the corresponding non-rephasing 2-D spectrum, a symmetric peak is observed whose peak position is fixed by the driving frequency (ωτ, ωt) = (ωd, ωd) due to energy conservation. This is in stark contrast to the spectrum predicted by mean-field theory for a damped oscillator, which exhibits a peak whose lineshape directly follows the linear loss function34 (centered at the plasma frequency ω0). We anticipate the non-rephasing nonlinearity to also be sensitive to analogous processes of other types of excitations such as Klemens decay of phonons46 or 3-magnon scattering47.
Pump-probe (PP)
As evidenced by its scaling with ∣EA∣2, independent of excitation phase, the pump-probe nonlinearity encompasses all incoherent (non-oscillatory) dynamics. Perhaps the most ubiquitous of such nonlinearities are thermal effects, in which initial excitation by EA (typically) raises the electronic temperature to a transient, non-equilibrium value. The bottom left panel of Fig. 2 illustrates such a thermal nonlinearity for an ordered system, in which the free energy is thermally-quenched by optical excitation. The corresponding pump-probe 2-D spectrum then exhibits a narrow lineshape along the vertical ωτ axis, reflecting the long timescales of thermal relaxation processes. A recent experiment by Kim et al. on the cuprate superconductor La2−xSrxCuO448 exploited this ability of 2DTS to separate coherent and incoherent dynamics, observing a strong pump-probe nonlinearity due to incoherent breaking of Cooper pairs49 that is spectrally separated from the coherent order parameter dynamics. We note that in the case of dominant incoherent optical processes (thermal or otherwise) the pump-probe nonlinearity will appear alone in 2-D spectra, which has been observed in varied systems24,26,50,51.
Rephasing (R)
The rephasing nonlinearity is most well-known for its usefulness in studying disorder (being responsible for optical photon echoes52 and spin echoes in nuclear magnetic resonance53), which may be understood from either a time- or frequency-domain perspective for a disordered ensemble of oscillators (valid in the limit of strong localization). In the time-domain, the first pulse EA coherently excites dynamics of the ensemble which dephase due to disorder, obscuring their intrinsic lifetime. Arrival of the second pulse EB then performs a time-reversal operation, reversing the extrinsic dephasing and ‘rephasing’ the ensemble after a time t = τ. The bottom right panel of Fig. 2 then illustrates the frequency-domain perspective with both a 1-D spectrum and rephasing 2-D spectrum. In the 1-D spectrum, the resonance lineshape is broadened by a combination of both intrinsic and extrinsic broadening and one cannot disentangle the two effects. In the 2-D spectrum, these two broadening mechanisms are projected into orthogonal directions and produce an asymmetric ‘almond’ peak shape34,54,55. Recent 2DTS experiments have exploited this rephasing nonlinearity to measure intrinsic linewidths in doped silicon23 and to characterize disordered superconductivity in the cuprate La2−xSrxCuO428. Analogous theoretical proposals have also been put forth toward resolving fractional excitations in spin liquids56,57.
Beyond third-order nonlinearities
The third-order nonlinearities described above typically capture the most prominent features observed in 2DTS experiments. However, the intense excitation employed in many 2DTS experiments, with peak electric fields in the kV/cm to MV/cm range, can drive even higher-order nonlinearities which have been observed in various systems.
An early example of such high-order nonlinearities in 2DTS spectra was reported by Maag et al. on magnetically-biased quantum wells20. With application of a magnetic field, the energies of the electron gas are quantized to Landau levels whose resonance frequencies are independent of electron-electron interactions – the celebrated theorem by Kohn58. Kohn’s theorem can be violated, however, by intense terahertz excitation. The physical mechanisms responsible were then clarified using 2DTS, which differed depending on excitation regime. At the lowest excitation fields, third-order nonlinearities dominate the 2DTS spectra and are due to band non-parabolicities. With stronger excitation fields however, fifth-order nonlinearities appear and the nonlinear optical response is determined by Coulomb effects between the electron gas and ionic background.
Recently, Huang et al. accessed an even more remarkable regime in 2DTS of the orthoferrite Sm0.4Er0.6FeO340. With driving fields in the MV/cm regime, features appear in 2DTS spectra that arise from magnon nonlinearities up to sixth-order, including fourth-, fifth-, and sixth-harmonic generation. The 2DTS spectra were only reproduced by simulations including both four-fold magnetic anisotropy and the Dzyaloshinskii-Moriya interaction, which underscores the exquisite sensitivity of high-order 2DTS spectra to the subtle physics of complex magnetic systems.
Coupled resonances
At this point we have considered only a single driven oscillator and its self-anharmonicities59. In real quantum materials however, anharmonic coupling between different resonances plays an essential role in their material properties and is also responsible for many of their most intriguing behaviors60. Such coupling is intricate, usually involving many degrees of freedom, and is difficult to decipher with one-dimensional spectroscopies. Disentangling the underlying coupling mechanisms in quantum materials is therefore a primary application of 2DTS, as we will demonstrate in the following.
As an example, we consider lowest-order anharmonic coupling (in a centro-symmetric system) between a coordinate x and three coupled coordinates {x1, x2, x3}, namely quadratic-linear61 and tri-linear62 coupling of the form:
where g and h are the anharmonic coefficients and the coupled coordinates {x1, x2, x3} have resonance frequencies {ω1, ω2, ω3} respectively. Symmetry considerations then require the coordinates {x1, x2, x3} to be infrared-active and the commmon coordinate x to be Raman-active (z* = 0). As illustrated in Fig. 3a, {x1, x2, x3} are directly driven by the excitation fields while the common coordinate x is indirectly driven by anharmonic coupling and the corresponding force
where the former term gives rise to both a rectified (ω = 0) and second-harmonic (ω = 2ω1) response while the latter term results in sum/difference frequency (ω = ω3 ± ω2) responses.
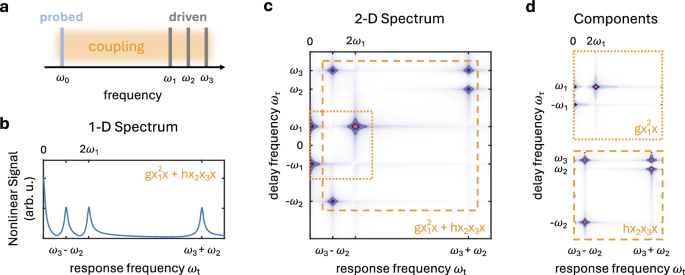
a Depiction of the probed coordinate x with a resonance frequency ω0 indirectly excited through coupling to three driven modes {x1, x2, x3} with resonance frequencies {ω1, ω2, ω3}. Schematic b one-dimensional and c two-dimensional spectra of the nonlinear response resulting from the total anharmonic coupling ({U}_{anh}=g{x}_{1}^{2}x+h{x}_{2}{x}_{3}x). The one-dimensional spectrum exhibits peaks at various response frequencies ωt that are ambiguous to the underlying coupling mechanisms, while the 2-D spectrum provides more intricate peak patterns that inform the underlying drive frequencies. d Decomposition of the total spectrum shown in c into its two constituent components, which exhibit characteristic peak patterns used to identify the coupling term responsible. Note that the schematic spectra shown in b–d are obtained under a driven condition, in which the nonlinear driving force exceeds the oscillation period of x. In the inverse condition, impulsive excitation of x becomes possible and additional features along ωt = ω0 appear.
In the most general one-dimensional measurement of coupling in this system, an initial pulse resonantly excites all three coordinates {x1, x2, x3} before a subsequent pulse measures the response of x via an observable such as transient reflectivity or transient birefringence. We further assume a driven condition, in which the nonlinear driving force exceeds the oscillation period of x. As shown in Fig. 3b, the resultant one-dimensional measurement yields, however, only the response frequencies while providing minimal information on the underlying coupling mechanisms.
In contrast, the corresponding 2-D spectrum shown in Fig. 3c is far richer. In addition to the response frequency axis, the dynamics are now spectrally resolved along the delay frequency axis ωτ to produce two-dimensional peak structures characteristic of specific coupling mechanisms. In Fig. 3c, two sets of peaks (outlined by the dotted and dashed boxes) can be identified as corresponding to the two coupling terms in (5). The peak pattern of each component, plotted individually in Fig. 3d, may then be intuitively understood by considering their coordinates along the two frequency axes ωτ and ωt.
Given a set of peaks at a particular response frequency ωt, their corresponding coordinates along the delay frequency ωτ indicate the parent driving frequencies that derive from (6). This may be most easily understood in the spectrum of Uanh = hx2x3x (bottom panel of Fig. 3d), where two peaks at ωt = ω3 + ω2 appear at corresponding delay frequencies ωτ = + ω3 and ωτ = + ω2 that unambiguously indicate a sum-frequency generation process. The two peaks at ωt = ω3 − ω2 likewise appear at ωτ = ω3 and ωτ = − ω2 to indicate a difference-frequency generation process. These fingerprints of sum- and difference-frequency generation processes were recently observed, for example, between magnon modes in YFeO363.
The spectrum of ({U}_{anh}=g{x}_{1}^{2}x) (top panel of Fig. 3d) (which can be intuited as the Uanh = hx2x3x spectrum in the degenerate limit ω3 = ω2), is interpreted in an analogous fashion. Here, two peaks at ωt = 0 appear at oppositely-signed frequencies ωτ = + ω1 and ωτ = − ω1 to indicate a rectified response while a single peak appears at ωt = 2ω1 and ωτ = + ω1 due to second-harmonic generation of a single frequency.
The peak patterns of the two lowest-order coupling terms considered here may be straightforwardly generalized to other possible coupling mechanisms in quantum materials. For example, recent experiments have demonstrated 2DTS as an incisive probe of ‘activated’ coupling involving phonons27, magnons29, and even between magnons and phonons64. Higher-order coupling terms65 should provide even more distinct signatures in 2-D spectra while other more exotic coupling mechanisms (not expected from straightforward symmetry considerations66) will also be interesting directions of future studies.
Quantum treatment of 2DTS
In the classical treatment of 2DTS applied above, potential anharmonicities result in six third-order nonlinearities (catalogued in Table 1). These classical nonlinearities each possess direct counterparts in a quantum treatment of 2DTS (applicable, in particular, to fermionic23 and fractional excitations56,57), which is applied ubiquitously to describe multidimensional spectroscopies at higher energy scales (mid-infrared12 to optical frequencies14). In the following, we present a quantum description of 2DTS in qualitative terms to highlight important differences from the classical picture, and leave a detailed discussion of the formalism to more complete texts12,13,67.
A quantum description of 2DTS typically begins with the optical Bloch equations68 for the density matrix ρ of a quantum level system. A perturbative solution of the equations67 then yields an expansion of the density matrix,
where the nth order density matrix ρ(n) involves a corresponding number of time-ordered field interactions that each induces a transition in the Bra or Ket of ρ(n). Each sequence of n density matrix elements induced by is commonly referred to as a quantum pathway, and possible quantum pathways are conveniently catalogued using so-called double-sided Feynman diagrams.
To construct such diagrams, one begins with an initial density matrix (here we assume a ground state population (leftvert 0rightrangle leftlangle 0rightvert)) that interacts with the first excitation field. An arrow pointing to the (left)right represents excitation by E(*), while an arrow on the (left)right side of the diagram interacts with the (Ket)Bra of the density matrix. An arrow pointing (into)out of the diagram then results in a transition to a (higher)lower energy level, a consequence of the rotating-wave approximation. The resultant density matrix element evolves along the corresponding experimental time delay – coherences oscillate at the frequency difference of the two states involved, while populations decay according to their relaxation pathways. Dephasing of coherences can then be included either phenomenologically12,13 or with a microscopically-motivated spectral density69,70.
The third-order diagrams for a ladder system comprised of a ground state (leftvert 0rightrangle), singly-excited state (leftvert 1rightrangle), and doubly-excited state (leftvert 2rightrangle) are plotted in Fig. 4, which can be categorized identically to the classical treatment above according to their electric field scaling and frequency coordinates in Table 1. Despite their remarkable similarity, however, we now remark on two important differences between the quantum and classical pictures. (1) The strength of each diagram in Fig. 4 is determined by the product of four dipole moments associated with each density matrix transition (including radiation along the time delay t). One therefore finds that the strengths of the pump-probe, non-rephasing, and rephasing diagrams are identical in the quantum picture, in contrast to their unequal strengths in the classical picture shown in Fig. 1d. (2) Each diagram has a (negative)positive sign for an (odd)even number of arrows on its right side. The two diagrams contributing to the two-quantum nonlinearity are therefore of opposite polarity and cancel38, unless additional interactions such as excitation-induced shift71 (δ ≠ 0) or excitation-induced dephasing72 of the (leftvert 2rightrangle leftlangle 1rightvert) coherence break their equivalence.
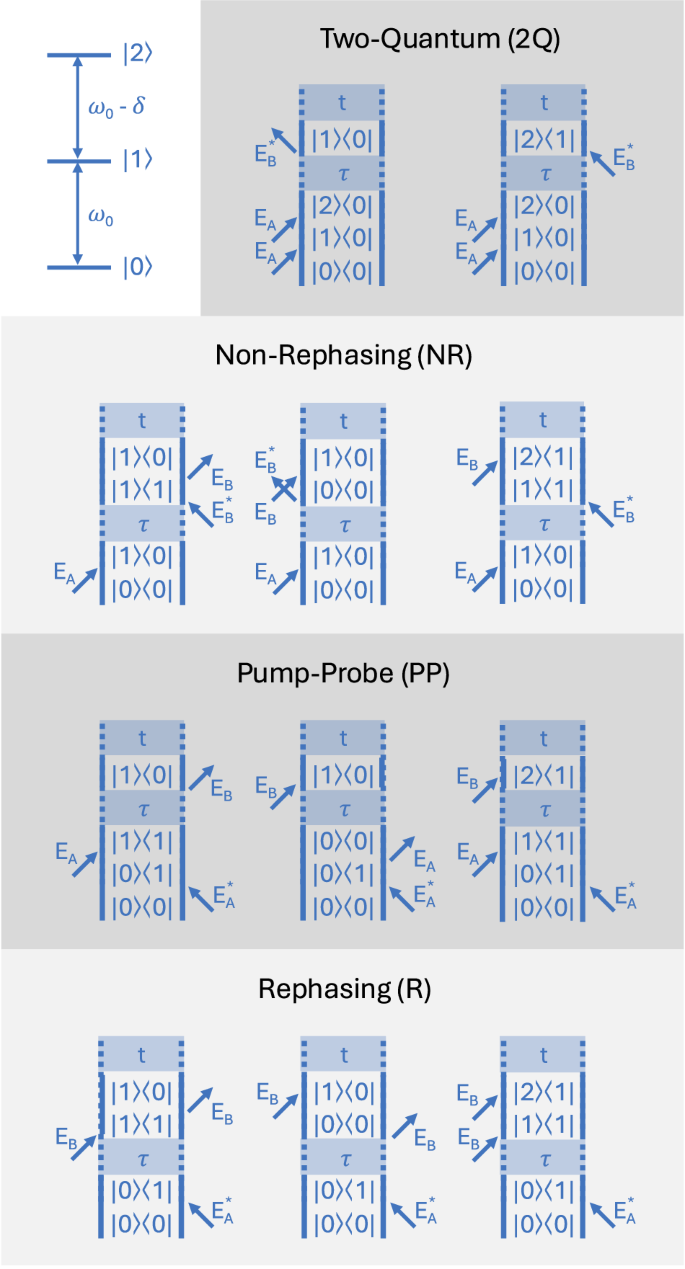
Double-sided Feynman diagrams describing possible optical nonlinearities for the three-level ladder system shown. Diagrams are constructed according to the rules detailed in the main text, assuming an initial density matrix (leftvert 0rightrangle leftlangle 0rightvert). In the case of two-pulse excitation, each pulse may act either once or twice (contribute one or two field interactions) prior to the time delays τ and t as indicated.
2DTS of quantum materials: out of equilibrium
So far we have considered quantum materials in thermodynamic equilibrium, in which a multitude of quantum phases can be realized by varying static parameters such as temperature, pressure, and composition. In contrast to these traditional methods, recent years have witnessed rapid progress in dynamic manipulation of quantum materials with light73. Light-induced ferroelectricity74,75, magnetism76,77, topological switching78,79,80, and even putative superconductivity81,82,83 are all examples of non-thermal phases that can emerge when quantum materials are pushed out of equilibrium84. Below, we provide an outlook for applying 2DTS toward understanding these light-induced phases, as well as the complex interplay of numerous degrees of freedom that underlie many of these spectacular effects.
Pump-2DTS probe experiments
In most demonstrations of light-induced phenomena, an initial ‘pump’ pulse drives a system into a non-equilibrium state, which is then interrogated by a subsequent ‘probe’ pulse that measures a one-dimensional (either linear or nonlinear) observable. In this language, one may generalize 2DTS as a multidimensional probe of transient states that measures its multidimensional nonlinear optical response.
We illustrate this idea for a hypothetical light-induced phase transition induced by a pump pulse Epump, in which the final non-equilibrium phase percolates from an initial disordered phase at short timescales. Such ultrafast disorder can then be probed by the rephasing nonlinearity generated by a subsequent 2DTS pulse sequence resonant with a salient collective mode frequency ω0 (whether phononic, magnetic, superconducting, or otherwise), illustrated in Fig. 5 for increasing values of the pump-2DTS probe time-delay tp−p. Prior to arrival of the pump pulse (tp−p < 0), no ordered phase exists at thermal equilibrium and a rephasing nonlinearity is absent for the collective mode that heralds a non-equilibrium ordered phase. Immediately after excitation by the pump pulse (tp−p > 0), a non-equilibrium phase forms whose disorder (and that of its concomitant collective mode) is reflected by an elongated rephasing 2-D spectrum34,54. With further increasing tp−p, the non-equilibrium phase becomes less disordered and the rephasing 2-D spectrum becomes correspondingly symmetric. We remark that this methodology can only be applied to non-equilibrium states that persist for times long enough for each time delay to be varied in the 2DTS probe74,77,85,86.
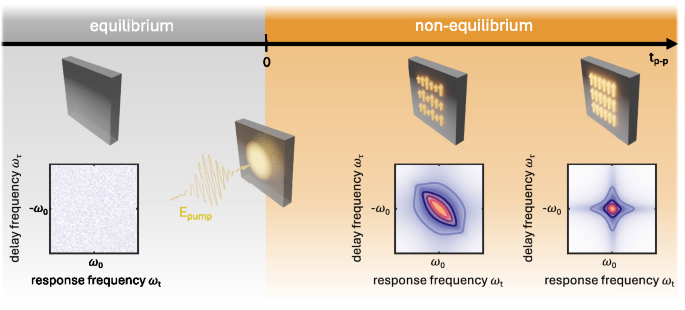
Evolution of the nonlinear optical response is shown as a function of pump-2DTS probe delay tp−p. Before arrival of the pump pulse (tp−p < 0), the system is unordered at thermal equilibrium and no rephasing nonlinearity is observed at the salient collective mode frequency ω0. Upon arrival of the pump pulse Epump (tp−p = 0), a non-equilibrium phase transition is initiated. At short timescales (tp−p > 0) the non-equilibrium phase is disordered, reflected by an elongated peak in the rephasing 2-D spectrum. At long timescales (tp−p ≫ 0), the disorder resolves and the rephasing 2-D spectrum becomes correspondingly symmetric.
Besides the rephasing nonlinearity, the other nonlinearities measured by 2DTS can provide even more information on non-equilibrium phenomena. For example, the pump-probe nonlinearity can isolate thermal effects such as the melting of competing orders81,87 while the two-quantum nonlinearity (and its higher-order counterparts) can inform the build-up of non-thermal correlations88 or loss thereof. Taken together, the information revealed by a 2DTS probe should ultimately address fundamental questions about non-equilibrium phase transitions such as their dynamic universality classes and scaling89, or whether these equilibrium concepts even apply at all to such radically different timescales.
Perturbative pump experiments
In our final generalization of 2DTS in a non-equilibrium context, we incorporate the ‘pump’ into part of the 2DTS excitation sequence. In contrast to the typical intense pump field that induces drastic changes in material properties (an overtly non-perturbative response), we consider relatively weak pump fields and an induced response that is perturbative. In this regime the microscopic mechanisms leading to light-induced non-equilibrium phenomena, more specifically the various coupling pathways between a driven mode and other material degrees of freedom, can be characterized.
A recent study reported by Taherian et al.90 demonstrates the power of this methodology towards studying the underlying mechanism of the light-induced state of underdoped YBa2Cu3O6+x, in which the appearance of a Josephson plasma edge upon optical excitation was attributed to formation of a non-equilibrium superconducting state. In these experiments, EA and EB were tuned to the closely-spaced apical oxygen phonon modes at 17 THz and 20 THz while the nonlinear observable was transient second-harmonic generation induced by the excitation fields91. The resultant 2-D spectra revealed unambiguous signatures of Josephson plasma currents cooperatively excited by both driven phonon modes, identified by the characteristic peak pattern of a difference-frequency generation process shown in Fig. 3.
Many other light-induced phenomena result from intricate underlying mechanisms ambiguous to conventional one-dimensional probes. Non-equilibrium superconducting-like states in organic solids82,92, ferroelectricity in SrTiO317,74, and magnetism in YTiO377 are all problems that may require a multidimensional probe to disentangle. The additional frequency dimension in 2-D spectra also provides a more efficient alternative for characterizing pump frequency resonances, typically performed in the frequency-domain by sweeping the excitation frequency93,94.
Outlook
In this Perspective, we introduced the emerging technique of two-dimensional terahertz spectroscopy as an incisive probe of quantum materials, both in and out of equilibrium. Future directions are numerous, but we conclude with three potential developments of particular interest to us.
(1) The coherent nature of 2DTS resolves both the real (dispersive) and imaginary (dissipative) components of the nonlinear optical response95, information which is typically discarded in most experiments thus far that analyze amplitude 2-D spectra. Developing the experimental and theoretical framework for analyzing complex 2-D spectra should connect nonlinear observables with their more familiar linear counterparts (optical conductivity, refractive index, etc.), and may even provide insight into the phase of an underlying many-body wavefunction in materials with topological order96.
(2) Extending scanning probes97 to perform 2DTS with nanometer resolution and below is another frontier that combines the advantages of multidimensional spectroscopy with imaging capability98. Directly correlating the spectral disorder measured by 2DTS with underlying spatial disorder will strengthen the crucial connection between material inhomogeneities and the resultant optoelectronic properties99.
(3) Finally, 2DTS may also be implemented with ultrafast circuitry100,101 to reach frequencies below what is possible with free-space optical methods102. Such on-chip methods also circumvent the restrictive diffraction limit of terahertz light, and integrate naturally with studies of van der Waals materials and their devices103,104.
Responses