Using magnetic dynamics to measure the spin gap in a candidate Kitaev material
Introduction
Spin-orbit entangled insulators, shaped by the intricate interplay between electron correlation and spin-orbit coupling, exhibit a range of exotic phases, including axion insulators, topological Mott insulators, and Kitaev materials1,2,3. Kitaev materials, in particular, have drawn significant attention due to their honeycomb magnetic lattice geometry, which offers a theoretically exact solution under idealized conditions4,5. In this model, bond-dependent anisotropic Kitaev interactions between adjacent spins lead to magnetic frustration and significant quantum fluctuations6. In reality, spin-orbit entangled Kitaev candidate materials often exhibit complicated magnetic interactions, such as the Heisenberg interaction and off-diagonal spin exchange, aside from the Kitaev interactions6,7,8. Consequently, most candidate materials exhibit magnetic order at low temperatures instead of a quantum spin liquid (QSL) ground state8,9,10,11. Nevertheless, these ordered phases offer crucial insights, as their symmetry and magnetic excitations shed light on the underlying interactions. This information is essential for evaluating and potentially tuning these systems toward a QSL state, thus advancing the understanding of spin-orbit entangled quantum materials6,12.
Several transition-metal materials, including α-RuCl311,13 and H3LiIr2O68, have been proposed as candidates for realizing the Kitaev model. Apart from these, Na2Co2TeO6 is distinguished as a promising candidate due to its more compact 3d orbitals which exhibit stronger spin couplings compared to the weakly localized 5d– and 4d-electron systems6. The spin-orbital coupling (SOC) within 3d orbitals of each Co atom gives rise to an effective spin-1/2 configuration on the honeycomb lattice. The complicated spin interactions and fluctuations within the spin-orbit entangled Na2Co2TeO6 leads to frustration and quantum fluctuations, yielding a diverse magnetic phase diagram14,15,16. At low temperatures, the system transitions from a paramagnetic state to a two-dimensional (2D) antiferromagnetic ordered state at 31 K, followed by the emergence of a 3D ordered state below 26.7 K15,16,17,18,19. Neutron scattering studies reveal that the low-energy spin excitations are diffusing below the 2D order transition temperature of 31 K, which have impeded the precise determination of its spin gap16.
Characterizing small spin gaps is significant for identifying phases in quantum materials. Historical examples include the debates over whether various spin systems exhibit a gapped or gapless spin liquid, such as the initial variational calculations proposing a gapless Dirac quantum spin liquid (QSL) state in the spin-1/2 Heisenberg model on kagome lattices20, while DMRG studies suggested a gapped QSL state with distinct properties21. Beyond spin liquids, the presence of spin gap signals non-trivial topological properties and thermal transport properties in low-dimensional materials22,23,24,25,26. The ability to directly detect the spin gap is crucial to resolving these questions. Thus, various conventional experimental techniques have been employed to characterize the spin gap, as shown in Fig. 1a, including specific heat27, thermal conductivity28,29, electron spin resonance (ESR)9,30, nuclear magnetic resonance (NMR)31, inelastic neutron scattering (INS)32, and resonant inelastic x-ray scattering (RIXS)33. However, detecting spin gaps smaller than microelectron volts by these traditional techniques remains a significant challenge, limited by the lower bounds of measured energy and temperature, as well as energy resolution.
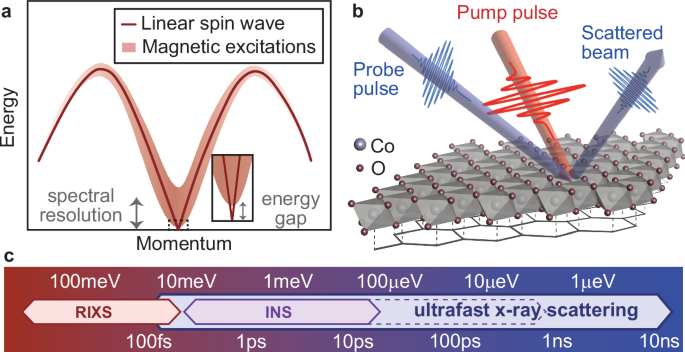
a Illustration of gapless spin-wave excitations (solid line) and the continuum in frustrated magnets. A closer look at the low-energy region is provided in the inset. The arrows sketch the spectral resolution and the small spin gap. b Experimental setup for the trREXS, showing the optical pump (red) and x-ray probe (blue). The honeycomb lattice under the crystal structure indicates the lattice formed by the Co atoms, significant in the Kitaev model. c Comparison of energy resolutions of scattering spectra and their corresponding timescales. The red arrow sketches the range of energy resolutions accessible through RIXS; the purple arrow indicates the energy resolution commonly achieved by INS, with the dashed line representing resolutions that require additional effort. Ultrafast trREXS measurement can cover a broad energy resolution range based on the observed timescales.
An alternative method for probing small-energy excitations has been proposed in the time domain. As shown in Fig. 1c, the characteristic time is inverse to a dominant energy scale. Thus, a small spin gap, which is beyond the resolution of RIXS or INS measurements, reflects a relatively long timescale that can be discerned using pump-probe techniques. For example, time-resolved optical spectroscopy has successfully disentangled low-energy bosonic excitations through their distinct timescales34; time-resolved x-ray scattering spectroscopy has revealed a collective charge fluctuation with characteristic energy in the sub-meV range35; x-ray photon correlation spectroscopy has been utilized to reveal sub-meV antiferromagnetic domain fluctuations36. In this scenario, ultrafast x-ray scattering emerges as a promising avenue to achieve microelectron volt energy resolution for a specific magnetic excitation by analyzing the corresponding finite-momentum dynamics in the time domain. By monitoring dynamics exceeding longer than several nanoseconds, one can access an energy resolution of sub-μeV scales, which is crucial for probing small spin gaps.
To this end, we employ time-resolved resonant elastic x-ray scattering (Tr-REXS) to reveal long-term magnetic dynamics at picoseconds to nanoseconds timescales in the Kitaev candidate material Na2Co2TeO6, as sketched in Fig. 1b. With the high-momentum resolution and time-resolved capabilities, we are able to directly investigate the fluence- and temperature-dependence of magnetic dynamics after pump. By a DMRG simulation of its model Hamiltonian, we further show that observed slow recovery dynamics reflects the small spin gaps in these types of magnetic materials. Thus, we establish this methodology by determining a spin gap of ~0.6 μeV in Na2Co2TeO6.
Results
Spectral characterization in equilibrium
The Na2Co2TeO6 crystal is characterized by a hexagonal space group P6322. Its magnetic moments are predominantly contributed by the valence electron in the high-spin electronic configuration (({t}_{2g}^{5}{e}_{g}^{2})) of Co2+ ions, with both spin and orbital angular momenta contributing to the magnetic moment37. Each edge-sharing CoO6 octahedra can be effectively regarded as a spin-1/2 state, forming a two-dimensional (2D) honeycomb lattice, as depicted in Fig. 1b. The energy-momentum-resolved REXS spectrum exhibits a pronounced peak at q = (−0.5, 0, 0.62) at 30 K, as shown in Fig. 2a, consistent with previous study16,38. Its intensity maximizes at two incident x-ray energies of 778.9 eV and 777.3 eV. The multi-peak resonances are related to the different electronic states, and the spectral features of the x-ray absorption spectrum of Na2Co2TeO6 are similar to the CoO reference spectrum, confirming the Co2+ state39 [see Supplementary Note 1]. As the temperature decreases below 2D magnetic phase transition temperature T2D ~31 K, both peaks exhibit a coincided rise of intensity [see Supplementary Note 1 for details], reflecting their associations with the magnetic order16,17. Both scattering peaks remain finite while largely suppressed above 31 K, indicating a subleading structural order that coexists with magnetic instability. Analyzing the temperature dependency of these two scattering peaks facilitates the differentiation between magnetic and structural contributions. The scattering intensity at 778.9 eV displays a strong temperature dependence immediately below 31 K, indicating a predominant magnetic contribution; conversely, the intensity at 777.3 eV remains evident above 31 K and climbs more gradually below 31 K, implying larger structural contribution. Our XRD studies demonstrate that this superstructure peak is almost independent of temperature below 31 K [see Supplementary Note 2], allowing us to subtract it to isolate the pure magnetic signal. Our time-resolved experiment results show that the suppression of the superstructure peak is very small ( ~2%, within the noise level) [see Supplementary Note 2].
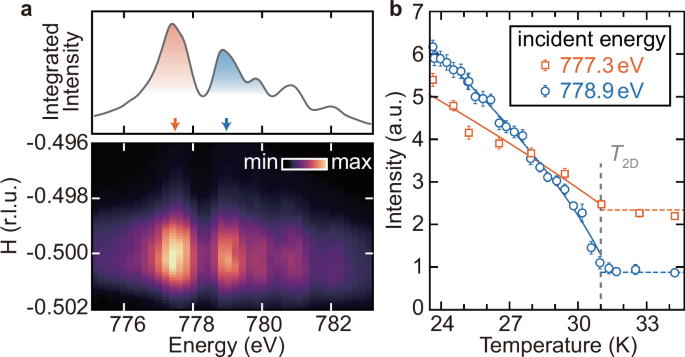
a REXS spectra for Na2Co2TeO6 at 30 K, showing the scattering intensity distribution around H = −0.5 r.l.u. (lower) and the integrated intensity for wavevectors between H = −0.502 and −0.498 r.l.u. (upper). The two shaded peaks in the upper panel highlight the two dominant resonant energies (777.3 eV and 778.9 eV) associated with the magnetic order. b Temperature dependence of the scattering signals at the two different incident energies. The intensities are fitted using an empirical equation and revealed the 2D magnetic transition temperature T2D = 31 K.
Light-induced dynamics of the magnetic scattering peak
By driving Na2Co2TeO6 out of equilibrium using a laser pulse, we analyze the subsequent changes in the magnetic structure using Tr-REXS. We exploit the two resonant scattering peaks (highlighted in Fig. 2) near q = (−0.5, 0, 0.62) to quantify the magnetic excitations. The energy gap of Na2Co2TeO6 is determined as ~2 eV by the optical absorption spectrum (inset of Fig. 3a). The small absorption peak at ~1 eV arises from the d-d transition of octahedral Co2+ 40. To decipher the dynamics of this magnetic order and the related magnetic excitations, we use both the below-gap 800 nm (~1.55 eV) pump laser and above-gap 400 nm (~3.1 eV) pump laser to excite the resonant magnetic peaks.
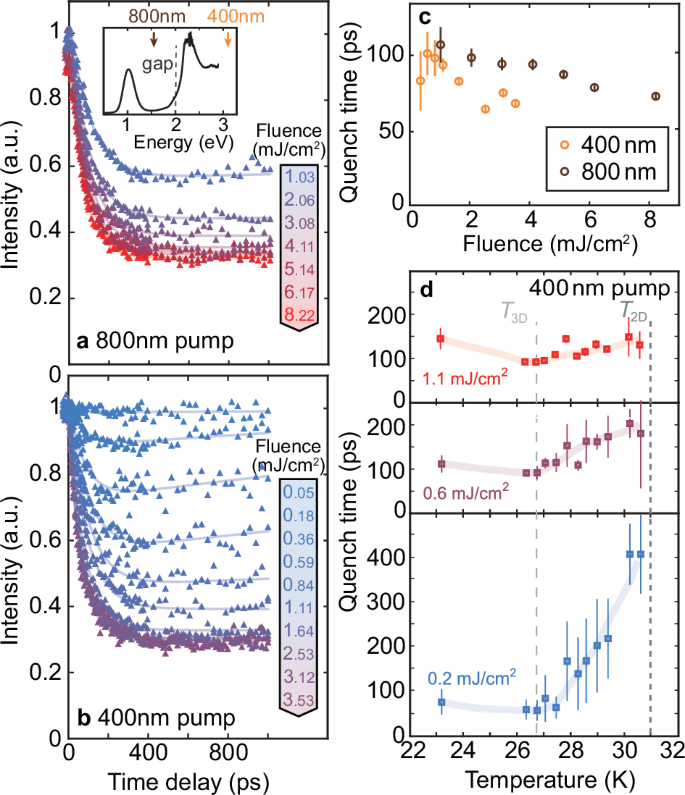
a, b Evolution of the magnetic scattering intensity for the 778.9 eV resonance induced by (a) 800 nm and (b) 400 nm pumps with various fluences, normalized by the equilibrium spectral intensities. The solid curves delineate the double-exponential fitting using Eq. (1). The pump-probe measurements are conducted at 23 K. The inset shows the optical absorption spectra of Na2Co2TeO6, with arrows highlighting the 400 nm and 800 nm photon energies, respectively. The dashed line indicates the band gap of ~2 eV. c The quench time τq extracted from (a, b) as a function of pump fluence. d Temperature dependence of the quench times for a 400 nm pump with different pump fluences. The dashed lines denote the transition temperatures of the 3D and 2D magnetic orders.
As shown in Fig. 3a, the evolution of the 778.9 eV REXS peak intensity, induced by an 800 nm pump laser, exhibits a prolonged dynamics at 23 K, manifesting as a gradual decay after pump (denoted as “quenching”) and a subsequent slow recovery back to equilibrium. This behavior can be described by a double-exponential function [see fitting details in Supplementary Note 3]:
Here, Iquench is the intensity portion affected by the pump laser and depends on the pump fluence, while ({I}_{{rm{res}}}) represents the residual intensity. To highlight the relative changes, these intensities are normalized by the equilibrium scattering peak intensity. The two prolonged dynamical processes are characterized by the characteristic quenching time τq and recovery time τr, respectively. Similar slow dynamics also appear in the evolution induced by an above-gap 400 nm pump (see Fig. 3b). This similarity suggests that the dynamics induced by these long-term dynamics can be regarded as the evolution of spin excitations. The dynamics induced by the below-gap 800 nm pump is less likely due to two-photon absorption since two-photon absorption requires more fluence (at least an order of magnitude higher than the above-gap pump41) to induce a similar suppression of the magnetic intensity. Due to the optical resonance, the absorption rate is much higher in 400 nm, resulting in a more pronounced response and higher fidelity when fitting the characteristic times [see Supplementary Note 4]. Specifically, the Iquench saturates at a fluence of 2.5 mJ/cm2 and 5 mJ/cm2 for the 400 nm and 800 nm pumps, respectively. For convenience of analyzing the magnetic excitation timescales and their fluence dependence, we primarily focus on the 400 nm pump in this work.
The light-induced demagnetization in Na2Co2TeO6 occurs within a timescale of 50 to 100 ps, as characterized by τq (see Fig. 3c). This demagnetization process slightly accelerates with an increase in pump fluence, attributed to photocarrier screening effects42,43. Notably, the order parameter decays significantly slower than in CDW materials44,45,46,47,48 and Mott insulators49,50,51,52,53. This phenomenon can be presumably attributed to the localized spins in cobalts, which hinder direct coupling between the electronic orbital degree of freedom and the spins. Without this direct coupling, the demagnetization is primarily driven by the strong phonon-magnon coupling in Na2Co2TeO6 as also evidenced by thermal conductivity29,54. This mechanism aligns with observations in other materials like InMnAs55 and MnBi2Te456, where localized spin moments and significant spin-lattice coupling are present. Similar to the REXS peak at 778.9 eV, the dynamics of the 777.3 eV resonant peak exhibit a slow demagnetization process with comparable timescales [see Supplementary Note 5]. Due to the mixture of magnetic and structural contributions, the Iquench is smaller for the 777.3 eV REXS peak.
Aside from the similarity with the dynamics induced by the below-gap 800 nm laser, relation between the prolonged dynamics induced by the 400 nm laser and spin excitations is further confirmed through the temperature dependence. As shown in Fig. 3d, the quenching time τq exhibits a significant increase as the temperature approaches T2D = 31 K from below. This trend reflects the strong magnetic fluctuations near the phase transition51,57,58,59, which has been also observed in other Kitaev materials such as α-RuCl351. A minor difference from α-RuCl3 is the disruption of the monotonic trend below 26.7 K in Na2Co2TeO6, where another 3D magnetic order starts to develop. This observation suggests an interplay between two distinct magnetic orders in Na2Co2TeO6, a phenomenon that warrants further investigation but is beyond the scope of this work.
Unlike the quench time which reflects the transition to excited states, the recovery process back to equilibrium characterizes the low-energy magnetic excitations. Therefore, we examine the long-time evolution of the two Tr-REXS peaks following the 400 nm pump. A comparison between the spectral shapes for both resonant peaks at equilibrium and 1000 ps indicates that the peak width remains essentially consistent, distinct from the broadening observed in thermal fluctuations60 (see Fig. 4a, b). We use the Lorentzian function to fit the half-width at half-maximum (HWHM) of the magnetic peak. The correlation length of the magnetic order ξ= 1/HWHM, where HWHM is expressed in units of a* (a*=2π/((sqrt{3})/2 × a0)). The magnetic correlation length is ~130 a0 and 700 Å, which is not limited by experimental resolution [see Supplementary Note 6]. Furthermore, the superstructure modulations have a negligible effect on the measured magnetic correlation length [see Supplementary Note 2]. Figure 4c and d present the corresponding fluence dependence of the magnetic dynamics for the two x-ray energies. For a relatively strong pump of 1.31 mJ/cm2, the long-term recovery can be characterized as τr = 8.66 ± 0.47 ns for the 777.3 eV and 11.43 ± 0.38 ns for the 778.9 eV peak. Reducing the pump fluence leads to a decrease in τr, contradicting again to the heat diffusion process [see Supplementary Note 7]. At a fluence of 0.37 mJ/cm2, we observe a saturation in the recovery timescale for the 778.9 eV peak [see Supplementary Note 7], yielding a τr = 2.54 ± 0.14 ns. This timescale coincides with the results for the 777.3 eV peak at the same fluence (τr = 3.94 ± 0.17 ns). Their proximity further underlines their association with the material’s intrinsic low-energy states, independent of pump and probe conditions. The phenomenon of prolonged relaxation is not unique to Na2Co2TeO6, but is also observed in other materials with intricate magnetic phases, such as another Kitaev candidate α-RuCl342 and multiferroic TbMnO3. These nanosecond-long relaxations are believed to occur due to nearly degenerate magnetic ground and excited states, influenced by frustrated interactions15,16,17,18,19. Therefore, the timescale of recovery quantitatively encodes information about these low-energy states.
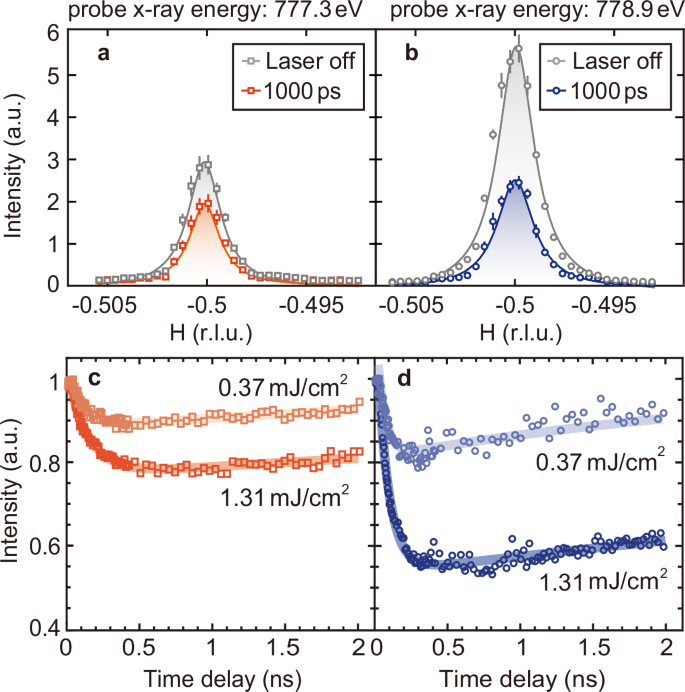
a, b The variation of the (−0.5, 0, 0.62) magnetic peak before and after pump excitation (1000 ps, 400 nm) with 777.3 eV and 778.9 eV at 23 K. The superstructure peaks are subtracted from the data. The grey shade indicates the change in intensity caused by photoexcitation. Solid lines are fit using a Lorentzian function. Error bars represent Poisson counting error. c, d Magnetic intensity normalized by laser-off data as a function of time delay with 777.3 eV (c) and 778.9 eV (d) at 23 K. The blue and red lines display the results of fitting, corresponding to pump fluence of 0.37 and 1.31 mJ/cm2 respectively.
Spin gap measurement from the Heisenberg-Kitaev model
To elucidate the slow recovery dynamics in Na2Co2TeO6 and its relation to the low-energy spin structure, we simulate the spin-1/2 Kitaev-Heisenberg Hamiltonian to describe the microscopic states of Na2Co2TeO661,62. This model captures the superexchange between each Co atom in a hexagonal structure, as illustrated in Fig. 5a. The cobalt atoms in an octahedral crystal field assume a high-spin ({({t}_{2g})}^{5}{({e}_{g})}^{2}) configuration in their 3d orbitals. Without trigonal splitting, an effective orbital momentum Leff = 1 with spin-orbit coupling splits the three-fold degenerate t2g orbitals into jeff = 1/2, 3/2, and 5/2 states, with jeff = 1/2 as the ground state. The superexchange interactions between nearest-neighbor Co atoms, via t2g–t2g, t2g–eg, and eg–eg channels, are mediated by the 2p orbitals of intervening oxygen atoms in a 90° of Co–O–Co bond geometry [see Fig. 5b]. This configuration leads to a coupling between the spins at two Co sites (denoted as i and j) perpendicular to the exchange path, i.e. ({S}_{i}^{gamma }{S}_{j}^{gamma }) (γ = x, y, z depends on the hexagon plane orientation). Deviations from perfect octahedral geometry introduce off-diagonal spin interactions, resulting in the Kitaev-Heisenberg Hamiltonian:
Here, the Heisenberg interactions are described by the first, second, and third nearest-neighbor spin-exchange J1, J2, and J3; K is the bond-dependent Kitaev interactions, with {α, β, γ} denoting the three types of anisotropic terms for the three nearest-neighbor directions. The symmetric off-diagonal terms, Γ and ({Gamma }^{{prime} }), appear in the Hamiltonian due to the octahedra distortion mentioned above. We follow the spectral fitting in ref.61 and choose the coupling coefficients as J1 = −0.1 meV, J2 = 0.3 meV, J3 = 0.9 meV, K = −9 meV, Γ = 1.8 meV, and ({Gamma }^{{prime} }=0.3) meV [see Supplementary Note 8 for the discussions of other model parameters].
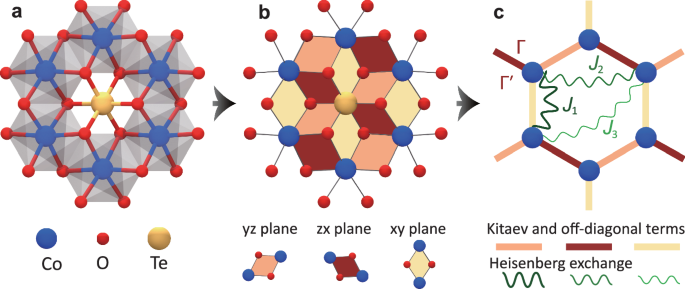
a Co-Te-O layer with Co (blue) atoms forming the honeycomb structure. Each nearest-neighbor Co pair is connected through two oxygen (red), and the Te (yellow) is placed at the center of each hexagon. The edge-sharing octahedra are represented by the gray cage surrounding each Co. b The pseudospin superexchange of Co mediated by O gives rise to the anisotropic spin terms K, and the octahedra distortion results in the symmetric off-diagonal terms {Γ, (Gamma {prime})}. The rotations of {α, β, γ} are represented by {y, z, x} (orange), {z, x, y} (red) and {x, y, z} (yellow), respectively. c The isotropic Heisenberg interaction between the nearest neighbor, next nearest neighbor, and third nearest neighbor for Co are shown as {J1, J2, J3}, the orientations of Kitaev and off-diagonal spin interactions are shown as the orange, red, and yellow bonds.
Employing the DMRG method63, renowned for its accuracy in analyzing strongly correlated systems, we simulate the electronic structure of Na2Co2TeO6, with a specific focus on the spin excitation gap. For relatively small systems, DMRG enables direct calculation of the first several excited states, thereby identifying the spin excitation gap defined as the energy difference between the ground state and the first excited state. The deduced gap values for a 4 × 4 and 6 × 4 clusters are Δ = 54.6 μeV and 32.4 μeV, respectively. (These unit cells are oriented along the e1 and e2 vectors, as shown in the inset of Fig. 6b). Notably, the gap decreases as the system size increases, indicating a finite-size effect and necessitating extrapolation to the thermodynamic limit.
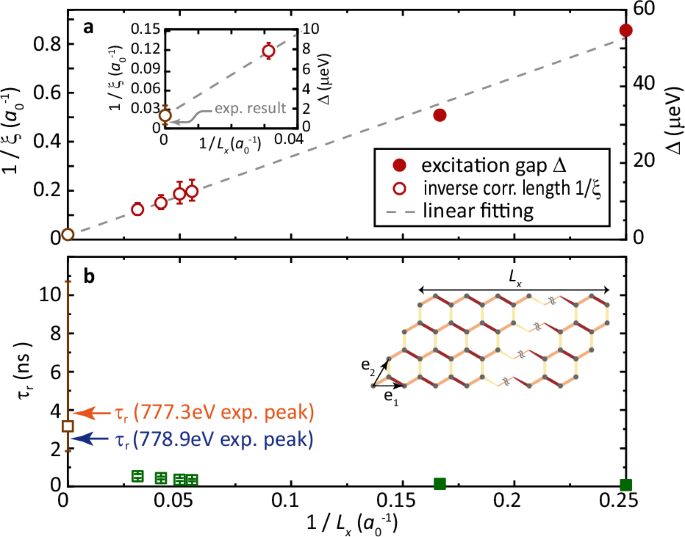
a The excitation gap Δ (closed circles) and inverse correlation length 1/ξ (open circles) simulated using the Kitaev-Heisenberg model for Lx × 4-systems with different sizes. The dashed line denotes the linear fitting for the Δ and 1/ξ, with the thermodynamic-limit extrapolation (intersection) represented by the gray open circle. The inset contrasts the simulated and experimental correlation lengths near the thermodynamic limit. The value of 1/ξ has an error bar of 0.014. b Characteristic timescales τr (green squares) extracted from the Rabi oscillation across the excitation gap. The gray square marks the thermodynamic-limit extrapolation. The two arrows highlight experimentally determined τr using two x-ray energies. The inset shows the quasi-1D geometry, with bond colors indicating the Kitaev superexchanges in Fig. 5.
Despite the impracticality of a direct finite-size scaling for excited states due to computational demands, we employ an indirect extrapolation to determine the spin gap. Systems larger than 18 × 4 exhibit a spatial distribution of the ground-state spin-spin correlation function Fz(r) that decay exponentially along the horizontal direction. A correlation length ξ can be extracted from fitting the correlation function (see the Methods). Accounting for relativistic effects near a quantum phase transition, we employ the Δ ∝ 1/ξ relationship to infer the spin gap64. Specifically, we simulate the Fz(r) for systems with various Lx where ξ can be reliably determined. The inverse of these ξ-values displays strong linearity with 1/Lx, as shown in Fig. 6a. Extrapolating this size dependency to the thermodynamic limit (1/Lx → 0), we obtain an intersection of (1/xi sim 0.02{a}_{0}^{-1}), with a0 representing the lattice constant. This agrees with the experimental magnetic correlation length within the error bar. By comparing the fitted linearity with the energy gaps calculated for smaller systems, we establish a correlation between Δ and 1/ξ (velocity of excitations), yielding ξΔ/a0 = 63.9 ± 4.5 μeV. Therefore, our DMRG simulation of the Kitaev-Heisenberg gives a spin gap Δ ~1.3 μeV in the thermodynamic limit. Our calculations have also considered other sets of parameters reported by INS studies [see Supplementary Note 8]. These models develop potentially gapless modes, which are inconsistent with the INS experimental data and our measured magnetic dynamics indicating the presence of a gap.
The long-term recovery timescale is predominantly governed by the low-energy states and can be approximated by the Rabi oscillation period across the spin gap. Therefore, the characteristic time derived from our simulation yields τr = h/Δ ~3.2 ns, as shown in Fig. 6b. This simulated timescale is consistent with the experimentally observed τr at low frequencies for both x-ray peaks (3.94 ns and 2.54 ns).
Discussion
The consistency between the spin gap determined through DMRG simulations and the characteristic recovery time identified in trREXS experiments reflects the viability of measuring ultra-small energy gaps using pump-probe x-ray experiments. Importantly, such determinations are also feasible with experimentally measured correlations, indicating the correlation-gap relation. A supporting evidence is that the experimentally measured correlation length (ξ = 130a0) translates into an energy gap Δ ~0.6 μeV, using the ξΔ/a0 obtained in Fig. 6a, yielding a characteristic time of 6.4 ns. This timescale falls within the range of the recovery times (τr) observed for the strong and weak pump conditions. The extracted correlation length from 2D order can be connected to the spin gap as the spin gap is dispersionless along the L direction in Na2Co2TeO6 [see Supplementary Note 6]. INS experiments on Na2Co2TeO6 reveal a spin gap of ~1 meV, which is determined as the energy at the maximum intensity15,16,65. However, the spin excitation has a bandwidth, and its weak spectral weight extends down to the elastic line. Such a small spin gap below 1 μeV will be buried by the large elastic peak in INS studies. Therefore, our results do not contradict the INS studies, which provide an upper boundary for the spin gap. Our results are consistent with a recent μSR experiment which has revealed prevalent spin dynamics down to 3.3 K14, suggesting significant quantum fluctuations and allowing the existence of a spin gap much smaller than 1 meV. Notably, excitation continua below spin-wave excitations have been observed in ordered magnets. For example, a recent INS study on the magnetically ordered Na2BaCo(PO4)2 revealed a spin excitation continuum induced by strong quantum fluctuations below the spin-wave modes66. Similarly, in the Kitaev material α-RuCl3, which develops magnetic order at low temperatures, neutron scattering studies revealed a broad continuum beneath the sharp magnon excitations. This continuum is interpreted as evidence of fractionalized excitations arising from Kitaev-type interactions10,12. While our study utilizes Na2Co2TeO6 as an example, due to the significance of its spin gap, this methodology is broadly applicable to diverse systems where the gap size ranges from 0.1 to 100 μeV. Such gap sizes correspond to picosecond to nanosecond timescales, which can be effectively revealed by the recovery dynamics.
While the correlation length and associated timescale exhibit consistent orders of magnitude, it is important to emphasize that the Hubbard-Kitaev model, as a single-orbital spin model, simplifies the material by focusing on the key ingredients. It does not account for charge transfer between different atoms, the presence of 3D magnetic order, or spin-phonon couplings. As a result, the model does not capture the demagnetization process observed in the initial 100 ps of the dynamics. The DMRG simulation is designed to examine the recovery process, governed by the low-energy states. Moreover, experimental results are subject to fitting inaccuracies and the intrinsic noise prevalent in long-duration measurements. As such, when comparing simulation outcomes with experimental data, one should consider potential error cancellations and focus on the order of magnitude, avoiding over-interpretation.
Our findings contribute to the ongoing exploration of spin gaps in complex magnetic systems. Our time-resolved REXS study reveals a small spin gap hidden in the diffuse spin excitation, which is challenging to measure by neutron scattering. This novel discovery highlights the advantages of trREXS in identifying spin gaps compared to other techniques. For instance, neutron backscattering and neutron spin-echo measurements also offer the energy resolutions of μeV, but require a large amount of single crystals. In contrast, our method requires only a small amount, thus extending its applicability to a wider range of samples. While transport techniques such as NMR and AC susceptibility can cover hundreds of nanoseconds to much longer, their energy range is much lower than trREXS67. The demonstration of time-resolved x-ray scattering spectroscopy in detecting small spin gaps with its unique merits and unprecedented precision opens innovative pathways for the detailed study and engineering of quantum magnets.
Methods
Sample preparation
The high-quality single crystals of Na2Co2TeO6 used in this study were grown with a flux method37. The hexagonal-shaped crystal flake used in this study had the dimensions of ~3 mm × 3 mm × 0.2 mm (lattice parameters: a = b = 5.25 Å, c = 11.19 Å). The sample was cleaved and examined by x-ray diffraction measurements (XRD) before experiments to confirm its excellent quality. Single crystal x-ray diffraction measurements were performed using the custom-designed x-ray instrument equipped with a Xenocs Genix3D Mo Kα (17.48 keV) x-ray source, which provides ~2.5 × 10⁷ photons/sec in a beam spot size of 150 μm at sample position68. We also performed the x-ray reciprocal space mapping measurements. The sample was mounted on a Huber 4-circle diffractometer. During data collection, the sample was continuously rotated at a rate of 0.005°/s. The 3-dimensional (3D) mapping of momentum space was realized by taking images in 0.1° sample-rotation increments. We fitted the lattice parameters with a hexagonal lattice for the single crystal and indexed the Bragg peaks. Then we can transform the data into HKL reciprocal space. Supplementary Fig S3 shows the diffuse scattering mapping of the Q = (H, 0.5, L) plane.
Optical measurements
The optical transmission data were collected at room temperature and converted to the absorption spectra. For the photon energy range from 0.5 to 2.7 eV, the measurement was performed on a Bruker 80V Fourier transform infrared spectrometer. For the photon energy range from 1.3 to 4 eV, the measurement was carried out on a home-built transmission measurement setup with a deuterium-halogen light source (Ideaoptics iDH2000-BSC) and a highly sensitive spectrometer (Ideaoptics Nova). Then, the transmission spectra from the two measurements were combined by normalizing the data in the overlapped range.
tr-RSXS measurements
The tr-RSXS experiments were carried out at the SSS-RSXS endstation of PAL-XFEL69. The sample was mounted on a six-axis open-circle cryostat manipulator with a base temperature of ~20 K. The sample surface was perpendicular to the crystalline c axis, and the horizontal scattering plane was parallel to the bc plane. X-ray pulses with ~80 fs pulse duration and 60 Hz repetition rate were used for the soft x-ray probe. The x-ray was linear horizontal polarized (π-polarization), and the photon energy was tuned to Co L3 edge ( ~778 eV). Since the 2D magnetic order is L-independent, we fixed the scattering angle of detector at 2θ = 156°, which provides L = 0.62 r.l.u. at H = −0.5 r.l.u. The temperature dependence of the scattering signals was fitted by an empirical function (I(T)=aleft{1-{left[(T+b)/(1+b)right]}^{c}right}) as shown in Fig. 2b70. The equilibrium sample temperature had been calibrated following the magnetic transition temperature reported in ref.16.
We utilized a Ti:sapphire laser to provide optical lasers at 1.55 eV (800 nm) and 3.1 eV (400 nm) with a pulse duration of ~50 fs and a repetition rate of 30 Hz. The 800 nm is converted to 400 nm through BBO crystal. Both σ-polarized (perpendicular to the scattering plane) and π-polarized (parallel to the scattering plane) laser pulses were used to excite Na2Co2TeO6, showing similar transient responses, indicating no laser polarization dependence. To simplify our experimental setup, we chose an 800 nm laser with σ-polarization and a 400 nm laser with π-polarization, considering that the polarization direction of the laser pulse underwent a 90-degree rotation after frequency doubling. The overall time resolution was ~108 fs, determined by measuring the pump-probe cross-correlation. The optical laser was nearly parallel to the incident X-ray beam, with an angle difference of less than 1°. The pump fluence ranged from 0.1 to 8 mJ/cm2. The x-ray spot size at the sample position was ~100 (H) × 200 (V) μm2 (FWHM), while the optical laser spot diameter was about ~500 μm (FWHM). The X-ray repetition rate was twice that of the pump pulses, enabling the comparison of diffraction signals before and after pump excitation.
Extrapolation of the excitation gap
To estimate the gap in the thermodynamic limit, we simulated the first excited-state energy for the Heisenberg-Kitaev model on a four-leg ladder using excited-state method of DMRG developed on ITensor Software Library71. However, due to the significantly increased computing costs after extending the cylinder’s length Lx, our excited-state simulations were restricted to Lx = 4 and 6 (in units of a0). In simulations of larger systems, we switched to an indirect simulation of the gap using ground-state properties obtained from DMRG72. Specifically, we estimated the ground-state spin-spin correlation length using a code based on a high-performance matrix product state algorithm library GraceQ/MPS273. The number of DMRG block states was constrained owing to the absence of spin-rotational symmetry. We maintained multiple bond dimensions of the matrix product state representation of the ground state at each sweep, with a maximum bond dimension of 2048, and a typical truncation error of ϵ ≈ 10−7. The results presented in the main text had been extrapolated to ϵ = 0 to minimize the cutoff error. Note that the cylinder geometry, chosen as Lx × Ly cluster with the open boundary condition along the e1 direction and periodic boundary condition along the e2 direction, destroyed the continuous spin symmetry in the system so that the spin correlation function ({F}^{alpha }(r)=langle {S}_{{x}_{0}}^{alpha }{S}_{{x}_{0}+r}^{alpha }rangle -langle {S}_{{x}_{0}}^{alpha }rangle langle {S}_{{x}_{0}+r}^{alpha }rangle) for α = x and y decayed exponentially, but Fy(r) saturated to a constant while the spin gap was finite. We obtained the spin correlation length by fitting the correlation function Fz(r) through e−r/ξ. The extrapolation into the thermodynamic limit yields a ξ = 49a0.
The correlation length was extrapolated to the thermodynamic limit Lx → ∞, using the linear function 1/ξ = α(1/Lx) + β. This fitting function faithfully described the scaling behavior, reaching the fitted intercept β = 0.02059 ± 0.01348. Here, the ξ was expressed in the unit of unit cell along the e1 direction, depicted as a0. As the linear relation between 1/ξ and 1/Lx had been verified, we reversely extrapolated the linear function backward to the short Lx region where the energy difference between the ground state and the first excited state was evaluated through the excited-state method of DMRG. Then we used the least-square approach to determine the ξΔ/a0 constant by minimizing the energy error against the two simulated excitation gaps for small clusters. The fitting result showed ξΔ/a0 = 63.9 ± 4.5 μeV, where the small residual error indicated the validity of this linear fitting. Alternatively, if we picked only one out of the 4 × 4- or 6 × 4-cluster to fit the constant, the estimation of ξΔ/a0 would be 66.4 μeV or 58.4 μeV, respectively. This estimated error was consistent with the fitting residual calculated above.
Responses