A combination of measures limits demand for critical materials in Sweden’s electric car transition
Introduction
Electrification is the main option considered for reducing greenhouse gas emissions from passenger car travel1. Ramping up sales of electric cars will require a continued scaling up of battery manufacturing capacities, including extraction and processing of raw materials such as lithium, cobalt, nickel, manganese, and graphite2—all listed as critical materials by the European Commission3. The reliance on these potentially critical materials could become a major challenge for the electrification of passenger cars.
The supply chains of these raw materials, where primarily lithium and cobalt have been pointed out4, may face challenges in scaling up due to geopolitical risks due to the sheer volume of material demand as compared to today’s production levels5. Local environmental impacts in the extraction and refinement of lithium, cobalt, and nickel6 as well as manganese7 may also pose additional challenges. Furthermore, severe primary supply limitations may occur in the coming decades for cobalt and nickel8 and production of synthetic graphite may become limited due to high costs and energy intensity9. Hence, studies on how to limit the demand for these materials are called for. Previous studies have shown that recycling and circularity can play an important role in the long term, if recycling infrastructure is rapidly deployed, at global10,11,12, Chinese13, United States (US)13,14, European Union (EU)15, and Swedish16 scales. The material requirements depend on a range of factors, including the development of the transport system, vehicle characteristics, and battery technologies11,17.
The choice of battery technology strongly affects material demand10,15,18 and may shift in the future, especially affecting the demand for nickel, cobalt, and manganese10. A recent review shows large variations in the projected demand, especially in the medium to long term, depending on future electric car adoption rates, and battery technology development18. Even if battery technologies would develop towards cobalt-free alternatives in the medium to long term, material recycling will not be enough to cover the demand in the short term12. Moreover, the choice of battery technology has an impact on the gravimetric energy density of the battery19. This means that a shift in battery technologies would result in changes to the mass in running order (i.e., curb mass plus the mass of a driver and some cargo) if the vehicle’s range is to be maintained. Meanwhile, changes to the mass in running order also affect the specific energy use of the vehicle and the battery capacity needed for maintaining a given vehicle range20,21. The total battery capacity needed also depends on the number of cars in future fleets and their battery sizes. Hence, these complex relationships need to be better understood to estimate how future material demand can be limited.
Several additional measures can affect the demand for the assessed materials. Shifts towards smaller cars and lightweight materials have been highlighted as material efficiency strategies17,22 as well as important factors for reducing passenger cars’ carbon footprints20,23,24,25. Lighter and smaller cars have a direct effect on the demand for vehicle materials and their production-related emissions. Since lighter and smaller cars on average use less energy per driven kilometer (km)20, the battery can also be smaller for a given range, which implies a reduced need for battery materials. Enabling a shorter range for electric cars, without compromising the user’s needs through effective charging strategies, could further reduce the demand for battery capacity26,27. Car sharing enabled by autonomous vehicles in cities could also reduce material demand by reducing the number of cars needed to supply a given travel demand28,29. A shift to autonomous taxis tailored for the trip and number of passengers could also promote the right-sizing of vehicles and lead to, on average, smaller vehicles30,31. Finally, behavioral changes, such as teleworking32 and mode shifting33, may reduce overall passenger car travel demand and could promote a smaller vehicle fleet, under the condition that the travel demand reduction leads to fewer cars being sold. The combined emission reduction potentials of technological and behavioral measures for passenger cars have been analyzed for example for China34 and Sweden35, showing that electrification remains the most important strategy for decarbonizing passenger car travel and that additional measures, such as driving less or shared mobility, can further decrease supply chain emissions. While a combination of technological and behavioral measures could unlock additional reduction potentials also for material demand, the individual effects may be diminished when several measures are implemented at once.
A few previous studies have focused on the impact of similar measures on critical material demand. A study on decarbonization pathways for the US33 shows that reducing car dependency, decreasing vehicle battery sizes, and maximizing recycling can reduce cumulative lithium demand by up to 66% until 2050 compared to a reference case. The same study also shows that reducing car dependency is more effective in limiting demand for virgin lithium than recycling. Another study found that achieving 100% market share in vehicle sales for plug-in hybrid electric vehicles (PHEVs) in the US by 2029 would have equal cumulative greenhouse gas emissions as battery electric vehicles (BEVs) achieving 100% market share by 2035 while requiring 80% less battery materials until 205036. A Belgian study showed that the combined effect of vehicle lifetime extension, downsizing, and car-sharing can reduce cumulative lithium demand by about 30% over a 40-year period, based on dynamic stock-flow modeling37. A global study on scenarios for battery material demand in response to new battery chemistries11, recycling, and second-use, emphasizes the uncertainty in model parameters and the results’ high sensitivity to the assumed battery capacity. Another study that quantifies the solution space for global material demand pathways17, shows that while technological development addresses the criticality of some materials, others (e.g., lithium) may even experience increased cumulative demand, which could be reduced by 26% through limiting fleet growth and by 19% through promoting smaller batteries. However, the combined material demand reduction effect of vehicle and battery technology improvements, infrastructure developments, and behavioral effects that could reduce travel demand has not yet been studied, to the authors’ knowledge—a research gap that is also highlighted in a recent perspective article38. Methods for endogenously capturing the effect of these measures on specific energy use and battery capacity are also lacking, which could improve the understanding of implementing combinations of different technological and behavioral measures.
In this study, we aim to develop explorative scenarios for limiting material demand in battery-electric passenger car fleets. Explorative scenarios are useful tools for understanding the consequences of alternative futures to inform strategic decision-making39. Within these scenarios, we estimate the potential to decrease demand for nickel, lithium, cobalt, manganese, and graphite in passenger car electrification that could be achieved by shifts in battery chemistries, more energy efficient cars, downsizing of cars, reduction of range requirements through improved charging infrastructure, car sharing, and reduction of car travel demand. We find notable reductions in the demand for the considered materials as a result of shorter battery range—enabled by improved charging infrastructure, increased vehicle energy efficiency, reduced travel demand, car sharing, and downsizing of cars compared to a reference scenario. These reductions are larger than the potential contributions from recycling. The Vehicle Turnover model Assessing Future Mobility services (V-TAFM)40, originally designed to assess the carbon footprint impact of passenger car electrification, was extended to enable this analysis. V-TAFM was also enhanced with a vehicle energy use module to endogenously capture the impact of the different measures on specific energy use and mass in running order for a given vehicle range. We use Sweden as a case study since a single-country focus enables detailed analyses of vehicle fleet turnover modeling, technology and behavioral trends, and policy developments. To place these estimates in a material availability context, the future cumulative demand and in-use stocks are compared with Sweden’s shares in the global reserves and resources of the respective materials, based on a per-capita allocation41.
Results
Measures for reducing future demand for battery materials
The factors that influence battery material demand for electric cars are related to several interlinked systems. In this study, we focus on the vehicle and fleet systems while the material requirements for a certain battery chemistry are based on previous research. Hence, we consider two battery chemistry pathways that develop separately from the other measures that we analyze. The material demand of the whole fleet is driven by the number of new cars manufactured in a certain year and the size of the battery in those cars, see Fig. 1. The number of cars needed depends on the vehicle lifetime of the cars in the current fleet and the travel activity each car can supply each year (i.e., the driving intensity). The driving intensity is higher for a shared car, but at the same time, the vehicle lifetime is shorter due to the car being more intensely used29. Finally, the fleet serves to fulfill a given travel demand per year. The battery size for a given driving range is determined by the size of the car, which affects the mass in running order and, in turn, the specific energy use of the car. At the same time, the assumed battery chemistry influences the gravimetric energy density of the battery, meaning that a battery with a lower energy density would lead to an increased mass in running order for a given driving range. The interplay between these factors is fully represented in the model, see details in “Methods”.
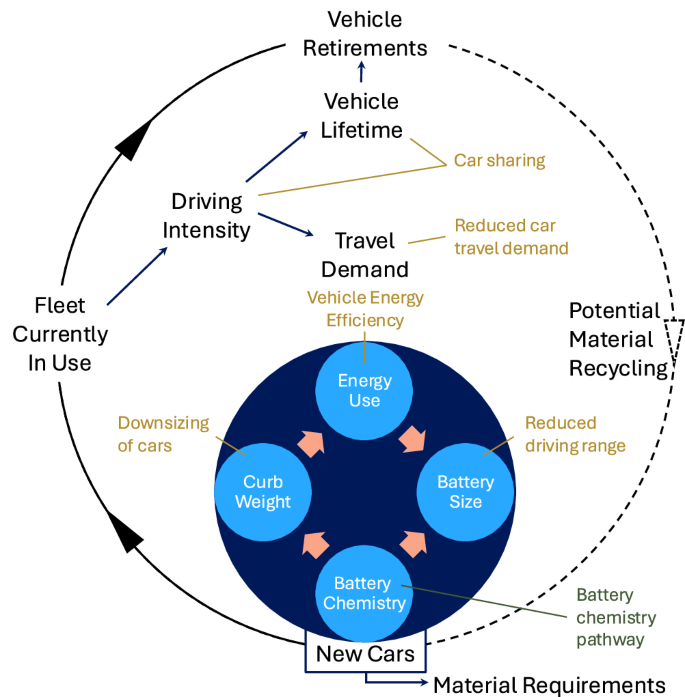
The vehicle system, represented by the smaller, blue circle, estimates the battery size dependent on range, battery chemistry, car size, and energy use. The fleet system, represented by the larger circle, estimates the total number of new cars needed to supply the travel demand dependent on assumptions on car sharing. Together these estimates provide the total amount of battery capacity needed and, consequently, the material requirements can be estimated based on the material intensity of the assumed battery chemistry. Analyzed measures are highlighted in yellow in relation to the part of the system that they affect, whereas the assumed battery chemistry pathway develops separately from the analyzed measures (highlighted in green).
Note that the dashed line in Fig. 1 represents the amount of materials remaining in vehicles reaching end-of-life, setting a theoretical maximum potential for recycling. There are limits to how efficient such systems could be, and we recognize that recycling without losses is unattainable. After quantifying the total cumulative material requirements, the theoretical maximum recycling potential is presented for each scenario indicated as a lower bound for cumulative material requirements from virgin resources.
The scenario analysis compares different measures for reduced material demand with a reference scenario for each of the battery chemistry pathways, both if implemented in isolation and if all measures are combined in a low material demand scenario. The main assumptions for each measure are summarized in Table 1. All measures are introduced linearly from 2022 and reach 100% of the market by 2040, except for car sharing which follows a Gompertz-curve reaching 98% of the market by 2050. Specific parameters for the general assumptions, the reference scenario, and the low material demand measures are provided in Supplementary Tables 1, 2, and 3, respectively. The estimated specific energy use per driven km, the mass in running order, and the battery size for each measure, as well as for the reference and low material demand scenarios, are provided in Supplementary Table 5.
Battery chemistry pathways
The evolution of cathode chemistries has been driven by raw material costs as well as performance and further developments are expected42. Shifts towards chemistries with high nickel content, including Nickel Cobalt Aluminum-oxide (NCA) and different combinations of Nickel, Manganese, and Cobalt (NMC), have been observed during the last decade10. Higher nickel content in the cathode generally implies higher storage capacity but a shorter cycle life and lower thermal stability, while Lithium Iron Phosphate (LFP) cathodes have a lower storage capacity but are considered more robust in terms of cycling life43. Increasing raw material costs caused a halt in the decreasing costs of Li-ion battery cell production in 2022 and affected battery choices44. While there have been technological advances in solid-state batteries, alternative anode chemistries, and their respective electrolytes, such innovations face challenges when scaling up in terms of manufacturing processes as well as achieving a robust supply chain42. Hence, we assume that short- to medium-term battery markets will be dominated by existing battery designs.
The battery chemistries used in the base year (2022) are assumed to be in line with the average in European sales of new cars (based on market shares of LFP, low-nickel, and high-nickel content batteries in European sales44 and the global market shares of specific battery chemistries within the low-nickel and high-nickel content categories45). The resulting market shares in the base year are 19% NMC111, 32% NMC622, 35% NMC811, 11% NCA, and 3% LFP. The two pathways start from the base year and follow linear trajectories to reach 100% of the market by 2040 for high-nickel content batteries (i.e., NMC811) and cobalt- and nickel-free batteries (illustrated by LFP in our analysis), respectively.
The assumed battery chemistry affects material demand per kWh10, see Supplementary Table 4, and the gravimetric energy density of the battery46, see Supplementary Table 1, which affects the car’s mass in running order for a given battery capacity. Further, the volumetric energy density also differs between different battery technologies. In our scenarios, we assume that the potentially larger battery pack volume needed for an LFP battery as compared to an NMC battery, when assuming the same range, comes at the expense of a smaller cabin and/or trunk volume. Hence, the assumed battery chemistry leaves other aspects of the vehicle design characteristics intact (e.g. frontal area, aerodynamics, glider, and drivetrain mass). Note also that we assume the battery lifetime to be equal to the vehicle lifetime and that both are negatively affected by the higher annual driving intensity assumed for shared cars29.
Vehicle energy efficiency
The specific energy used in an electric car depends on (i) the car’s total mass, (ii) the car’s frontal area and the aerodynamic drag, (iii) the rolling resistance, (iv) the energy recovered through regenerative braking, (v) powertrain losses, and (vi) the additional energy use needed to power cabin heating/cooling, infotainment systems, and the driving behavior20,21. The average specific energy use in 2022 was 220 W h km-1, based on manufacturers’ data47 for electric cars sold in Sweden. The specific energy use has been adjusted for 25% higher energy use to account for real-world driving conditions. This can be compared to a 19% discrepancy between measured specific energy use and declared specific energy use based on the WLTP for BEVs used in the Netherlands48. We assume a slightly higher discrepancy due to the colder weather conditions in Sweden, which requires larger levels of energy use for achieving an acceptable level of thermal comfort in the cabin.
We use a model20,21 following the worldwide harmonized light vehicle testing cycle (WLTC) to estimate the energy use per km for future cars, including the impact of energy efficiency measures. Car design has a notable impact on aerodynamic drag; for example, the drag can be reduced by redesigning the shape of the tail section and rounding the nose of the car49. Reductions in rolling resistance—through larger rim sizes, shallower thread depth, and lower speed ratings—could result in a 40% decrease in the rolling resistance coefficient50,51. Regenerative braking also contributes to reducing the overall energy use and depends on the route, the capacity of the drivetrain, and the charging/discharging efficiencies of the battery20,21. Note that the assumed 25% adjustment to account for real-world driving conditions implies large reductions in energy use for heating/cooling in the low material demand scenario when the energy use for propulsion is reduced. For example, heat pumps, and other new heating technologies, can reduce power demand for cabin heating20,52,53, but achieving the implied reduction will likely require additional measures, such as localized heating20 and improved insulation54,55.
Downsizing of cars
The size of both conventional and electric cars has been increasing globally44. The average mass in running order of new cars in Sweden has increased from 1566 kg in 2014 to 1834 kg in 2022, see Supplementary Fig. 1. While this trend could be partly explained by a shift towards electric cars and plug-in hybrid electric cars, a similar trend is also shown for the individual cars with different drivetrains, see Supplementary Fig. 1, confirming a trend towards heavier cars that dates back at least to the 1970s56. Reducing the mass in running order could be a measure to reduce material demand since the mass in running order affects the specific energy use and, hence, the battery capacity required for a given driving range. Reduced average mass in running order can be achieved through lightweight materials in the vehicle design57 and by users buying smaller cars58. Several strategies for using lightweight materials are already available—a trend not only driven by sustainability efforts but also by costs and performance without compromising structural safety59.
We assume a reduction in glider mass of 15% due to lightweight materials already in the reference scenario20, achieving an average glider mass of 1275 kg (i.e., the mass of the body and chassis, excl. engine, drivetrain, and battery). As low material demand measures, we consider the combined effect of reduced vehicle size, from large vehicles on average to lower medium20, and reduced glider mass of 25% due to lightweight materials20,60, resulting in a mass of 863 kg. The lower medium vehicle size also is assumed to have a smaller frontal area, 2.2 m2 compared to 2.4 m2 for the large car20, which contributes to reduced drag and lower specific energy use.
The model also accounts for the added mass of the battery in response to the assumed range and the analyzed battery chemistry since the gravimetric energy density varies between battery chemistries.
Reduced driving range
Insufficient range is seen as an obstacle to electric car adoption and is likely related to psychological factors61. Hence, tailoring charging to the user’s travel patterns could reveal a potential reduction in battery sizes. The average driving range in 2022 for new electric cars sold in Sweden was 355 km (adjusted with 25% higher energy use to account for real-world driving conditions)47. We assume that cars with high engine power can be used as a proxy for a luxury market segment and available statistics show that there is no marginal increase in range with increasing engine power above a certain level, see Supplementary Fig. 2. A driving range of 400 km aligns with the average driving range of new electric cars sold in Sweden in 2022 with a higher engine power than 200 kW and higher mass in running order than 1800 kg. Hence, we assume that the demand for further range saturates at 400 km in the reference scenario.
The need for large battery sizes could be limited by dense access to fast chargers along major highways27 or technologies for charging while driving, such as inductive charging on electric roads26 or, potentially, wired peer-to-peer charging62. As a low material demand measure, we assume that the driving range could be halved, which is in line with the impact of implementing electric roads on 25% of national and European roads in Sweden (eq. to around 4000 km)26 or of dense access to fast chargers along major highways, based on results for Seattle27. This assumption should be seen as a proxy for a future development where demand for battery capacity is reduced by a large-scale expansion of fast charging and/or electric roads that make it possible for users to achieve their trips without worrying about their driving range and where the fast charging or charging while driving does not lead to major battery degradation. The assumed driving range not only affects the battery size but also the specific energy use and the mass in running order of the car due to the reduction in battery capacity needed.
Car sharing
The Swedish car fleet, with 5.8 million cars in 2022, has historically been dominated by cars owned or leased by individuals63. The introduction of connected and autonomous cars could enable both the sharing of cars and rides, where they can reduce the required fleet size needed to supply a given travel demand64. However, shared cars would be driven more intensely, which could result in shortening their lifetime in the fleet29. As a low material demand measure, we assume that a shared autonomous car could replace five individually held cars, which is consistent with a simulation study on vehicle sharing in Gothenburg65. We assume that sharing will eventually be fully adopted in larger cities, municipalities within commuting distance of larger cities, and medium-sized towns. We do not consider car sharing to be an option in the reference scenario.
Reduced car travel demand
Demand per capita for passenger car travel in Sweden has been relatively stable during the last two decades, see Supplementary Fig. 3. Nevertheless, the Swedish Transportation Administration66 projects a 21% increase in the annual travel demand by passenger car per capita in 2050 compared to the 2022 level. However, measures such as improved public transport systems, teleworking32, and societal lifestyle trends may reduce the demand for passenger car travel33. Walking, cycling, and public transport can replace passenger cars and reduce car travel demand by up to 10%, remote teleworking two days a week for half the people who commute can decrease the demand for car travel by another 5%, and, in addition, some longer leisure trips could be shifted to long-distance public transport options or fully omitted resulting in car travel demand reductions of up to 9%35. These changes could take place due to lifestyle changes and/or increased cost of car usage, for example, due to km-taxes, high battery prices, and/or high electricity prices35.
We assume that travel demand by passenger car follows governmental projections in the reference scenario. As a low material demand measure, we consider a reduction in travel demand by passenger car per capita by 21% in 2050 compared to the 2022 level. Such a reduction in travel demand is large but on par with the Swedish Transport Administration’s low passenger car demand pathway66. While this measure is assumed to increase demand for public transport, buses in particular, Sweden exhibits a notably low occupancy rate for buses, which indicates a potential for increased bus travel without increasing bus traffic35.
Future material demand reduction potentials and impact on battery capacity
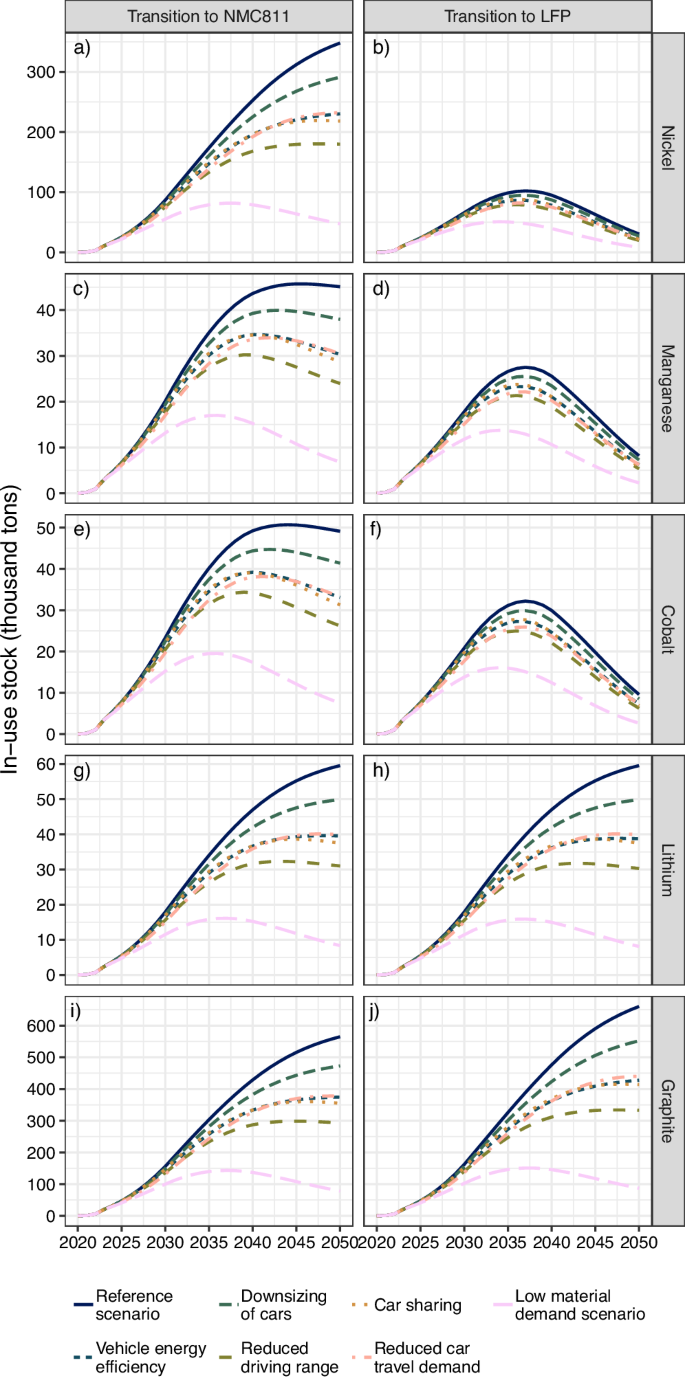
The cumulative demand, representing the cumulative total inflow of material into the electric car fleet for the range of materials considered in the analysis, is shown in Fig. 2 and Supplementary Table 7. The in-use stock of material is the material that is tied up in the Swedish car fleet at a given moment in time and represents the minimum amount of material that would be required for the fleet, see results in Fig. 3 and Supplementary Table 8. The difference between the cumulative demand and the in-use stock is the amount of material originating from the Swedish car fleet that becomes eligible for recycling. We assume that the share of electric cars in new car sales will approach 100% in 2030, which is in line with the governmental proposals for rapid electrification of the passenger car fleet62,67.
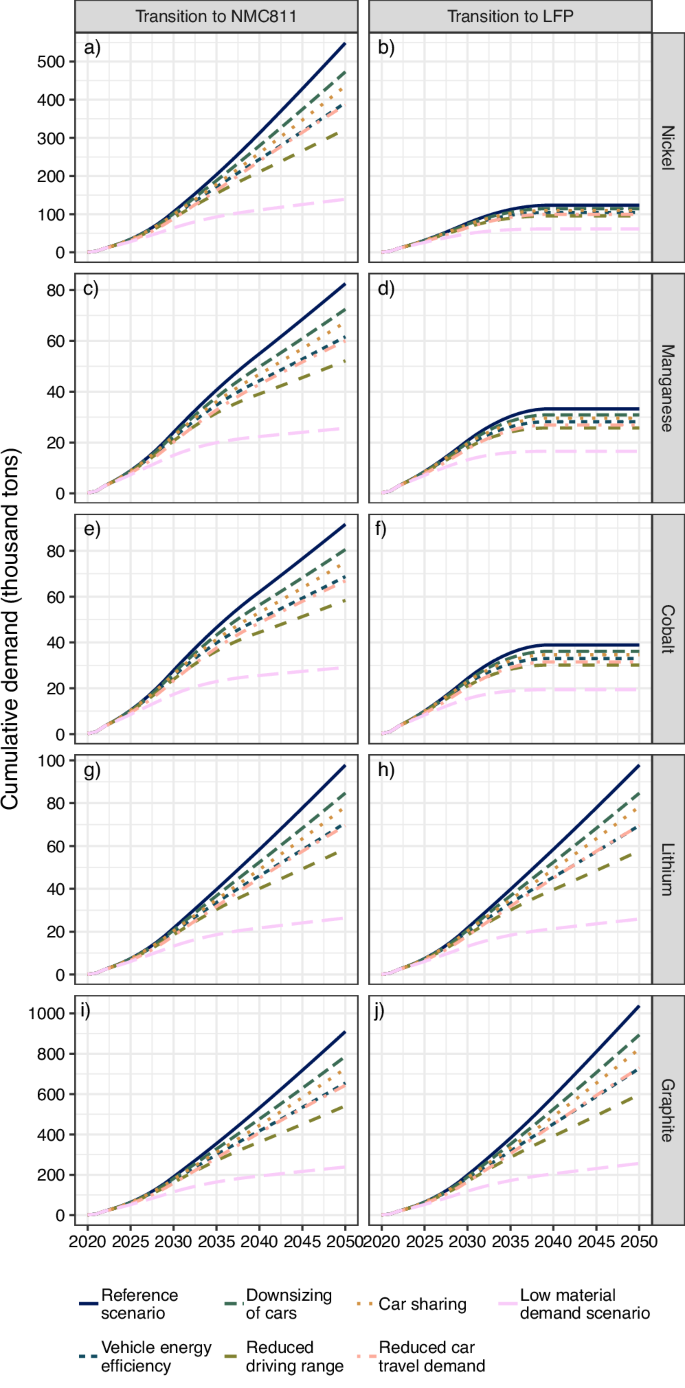
Results for the materials nickel (a, b), manganese (c, d), cobalt (e, f), lithium (g, h), and graphite (i, j), for each of the battery chemistry pathways: transition to NMC811 (a, c, e, g, i) and transition to LFP (b, d, f, h, j). The analyzed scenario is given by the line type.
Results for the materials nickel (a, b), manganese (c, d), cobalt (e, f), lithium (g, h), and graphite (i, j), for each of the battery chemistry pathways: transition to NMC811 (a, c, e, g, i) and transition to LFP (b, d, f, h, j). The analyzed scenario is given by the line type.
In the battery chemistry pathway that transitions to NMC811, the cumulative demand and the in-use stocks increase for all metals in the reference scenario, with the exception of the in-use stock of manganese and cobalt, and are likely to continue increasing after 2050, see Fig. 2 and Fig. 3. The stagnation and eventual decrease of the in-use stock of manganese and cobalt is a result of the shift to the nickel-rich NMC811. In the battery chemistry pathway that transitions to LFP, a stagnation in cumulative demand for nickel, manganese, and cobalt is observed around 2035 following the phase-out of NMC batteries in new sales. For this pathway, the in-use stock subsequently decreases as vehicles with NMC batteries are retired. This implies that the annual demand (inflow) for the material as input to new battery production needed for the Swedish fleet is smaller than the material in cars that reach end-of-life (outflow), see Supplementary Figs. 4-6.
By 2030, reduced travel demand has the strongest cumulative demand reduction potential (16–17%, depending on material) followed by reduced driving range (14–16%), vehicle energy efficiency (9–10%), car sharing (6–7%), and downsizing of cars (4–5%), see Supplementary Table 7. The relative reduction potentials are within these ranges for both battery chemistry pathways. However, the absolute reduction is larger for nickel, manganese, and cobalt in the battery chemistry pathway that transitions to NMC811, while the opposite applies to graphite. By 2050, reducing driving range has the strongest cumulative demand reduction potential (36–42%), followed by reduced travel demand (27–30%), vehicle energy efficiency (25–30%), car sharing (18–21%), and downsizing of cars (12–14%). However, these results do not apply to nickel, manganese, and cobalt in the battery chemistry pathway that transitions to LFP. For those materials, the impacts of the measures are notably reduced although the ranking remains.
Similar reduction potentials are shown for the in-use stock by 2030, see Supplementary Table 8. By 2050, the in-use stock reduction potential of reduced driving range is as high as 47–50% for all materials in the pathway that transitions to NMC811 as well as for lithium and graphite in the pathway that transitions to LFP. Car sharing is ranked as the second most impactful measure with an in-use stock reduction potential of 36–37%, which is larger than the reduction potential observed for this measure in the cumulative demand (18–21%). This can be explained by car sharing reducing the size of the fleet but increasing the annual travel distance by cars used for sharing, which causes a reduction in the vehicle lifetime, thereby increasing the turnover rate. Vehicle energy efficiency is the third-ranked measure with an in-use stock reduction potential of 33–35%, followed by reduced travel demand (32–33%) and downsizing of cars (16%). For the battery chemistry pathway that transitions to LFP, the reduction potentials are slightly lower for nickel, manganese, and cobalt for all measures.
The combined impacts of all measures in the low material demand scenario show reduction potentials by 2030 of 36–40% for the cumulative demand and 34–37% for the in-use stock. By 2050, the results vary depending on the battery chemistry pathway, where cumulative demand could be reduced by 68–75% and the in-use stock by 85–87% for all materials in transition to NMC811 as well as for lithium and graphite in transition to LFP. For nickel, manganese, and cobalt in the pathway that transitions to LFP, the reduction potentials are somewhat lower, where the cumulative demand could be reduced by 50% and the in-use stock by 72%.
We analyze our results’ sensitivity to changes in the following assumptions: (i) phaseout year of internal combustion engines (based on existing EU regulation68), (ii) capacity of shared cars to replace conventional ones, (iii) assumed increase in specific energy use to adjust for real-world conditions, (iv) vehicle range, (v) implementation year for analyzed measures, and (vi) car size in the future. Details on the changed parameters are provided in Supplementary Table 6. The in-use stock of materials in 2050 is the most sensitive to larger car sizes in the future, which applies to all materials, both battery chemistry pathways, and all scenarios except the combined low material demand scenario, see Supplementary Fig. 7. The low material demand scenario, combining the impact of all measures, is generally less sensitive to these changes in assumptions. The implementation year for analyzed measures also has a notable impact on the in-use nickel, manganese, and cobalt stocks in the pathway that transitions to LFP. The cumulative material demand until 2050 is also sensitive to larger car sizes in the future, leading to a notable increase in cumulative demand, as well as the phaseout year of internal combustion engines, leading to a notable decrease in cumulative demand, see Supplementary Fig. 8. Similar to the in-use stock of materials, the implementation year for analyzed measures also has a notable impact on the in-use nickel, manganese, and cobalt stocks in the pathway that transitions to LFP.
While car sharing and reduced travel demand affect the size of the fleet and how the fleet is used, the remaining measures each have a direct impact on the battery capacity of new vehicles and affect the interplay between measures. We illustrate this by ranking the impact on battery size of different combinations of measures (Fig. 4). The ranking of different measures’ impacts on battery capacity shows that the individual measure with the strongest impact is reductions in the driving range followed by energy efficiency improvements. The relative impacts of lightweight materials (−5%) and smaller cars (−14%) are the same for any assumed range or battery chemistry, whereas the absolute contribution to reducing battery capacity is lower when the range requirement is reduced. In combination with energy efficiency, the relative impacts of lightweighting and smaller cars are also reduced. Note that the trade-off in increased battery capacity due to lower gravimetric energy density when switching to the less material-intense LFP chemistry is relatively small and could potentially be compensated for by implementing lightweight materials alone.
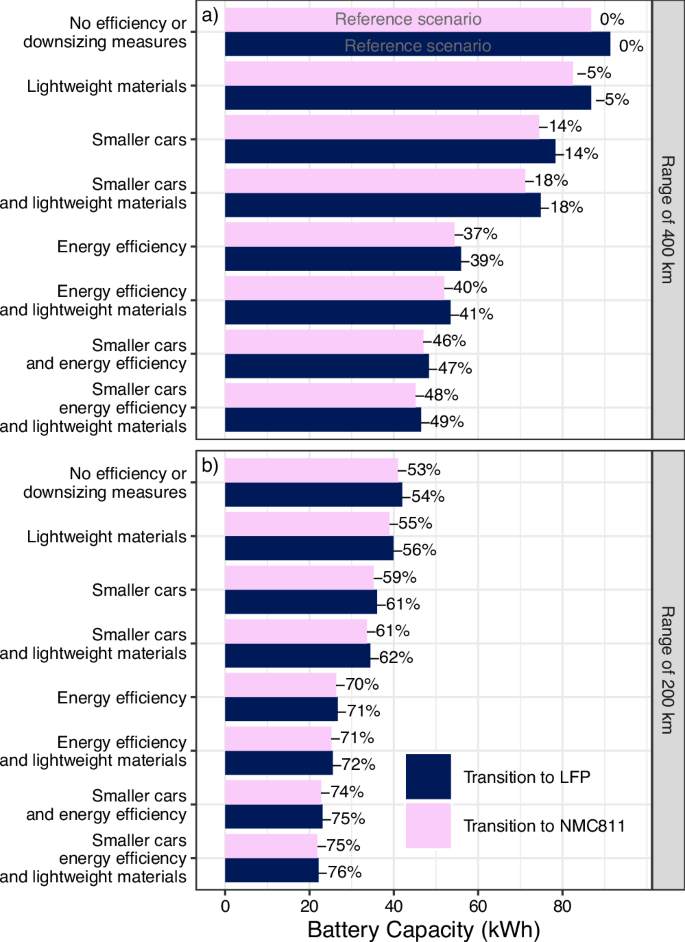
The estimated battery capacity for an average car (x-axis) is shown for each considered measure (y-axis), and battery chemistry (color). a Results for a range of 400 km. b Results for a range of 200 km. The estimated change in battery capacity as compared to the reference scenario is provided as a percentage next to each bar.
Raw material availability and sustainability
The cumulative material requirements until 2050 can be seen as a range for each scenario as well as for quantifying the impact of each measure when implemented in isolation, see Fig. 5. The higher value in the range represents the total cumulative demand of raw materials for electrifying the car fleet, regardless of source. The lower value in the range, equal to the in-use stock, is the minimum total demand for virgin raw materials that would be required even if all material available from vehicles that reach end-of-life would be used in the production of new cars with no or negligible losses. This does not mean that it is possible to reach 100% recycling efficiency but rather illustrates that a large inflow of raw materials to the Swedish system will inevitably be required.
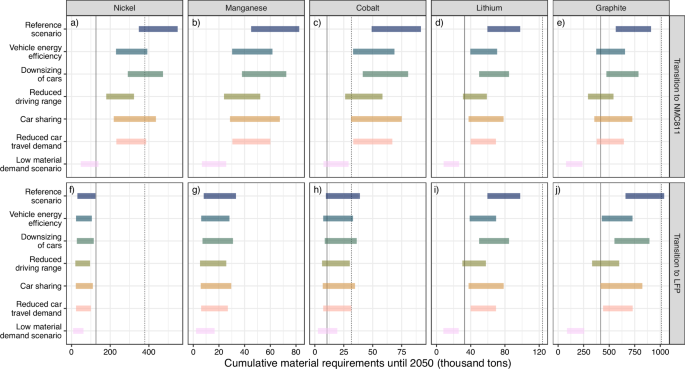
The results are provided for materials nickel (a, f), manganese (b, g), cobalt (c, h), lithium (d, i), and graphite (e, j), for each of the battery chemistry pathways: transition to NMC811 (a, b, c, d, e) and transition to LFP (f, g, h, i, j). The results are here depicted as a range for each scenario, where the in-use stock is the lower value, and the cumulative demand is the higher value. This range can be interpreted as the minimum material requirements if all material available from retired vehicles is used in new production (i.e., the existing stock of material) and the maximum material demand follows the cumulative inflow to the Swedish car market. For each material, an equal per capita share of the material’s reserve (solid lines) and resource (dashed lines) is provided for comparison. Note that the equal per capita shares of the manganese reserves and resources exceed the range of the graph, see Table 2, and are therefore excluded. Note that these estimates only include natural graphite.
The results in Fig. 5 show that the measures to reduce battery material demand can be as important as recycling in reducing the material requirements until 2050. In fact, the cumulative material demand in the low material demand scenario results in substantially lower material requirements than could even be achieved by high levels of recycling of materials in the reference scenario, except for nickel, manganese, and cobalt in the battery chemistry pathway that transitions to LFP. In other words, all measures combined can for these materials achieve notably larger reductions in demand for virgin raw materials than the quantities becoming available for recycling. The fact that recycling processes always come with losses further stresses the importance of the low material demand measures analyzed here. It is, however, important to point out that the impacts of the measures are less important for reducing the demand for nickel, cobalt, and manganese if the battery industry decides to abandon the NMC-based battery technology.
To contextualize our results, we compare the cumulative material requirements to an equal per capita share of the global reserves and resources for each material, represented by the vertical lines in Fig. 5 and Table 2 (see Methods for a description of how this is calculated). This comparison is under the assumption that these materials would only be used for batteries in passenger cars, while demand for these materials also exists for other purposes that may grow as well.
The reference scenario is within the equal per capita share of the material resources for manganese, lithium, and graphite (although barely for graphite in the pathway that transitions to LFP). For cobalt and nickel, the equal per capita share of material resources is exceeded in the reference scenario for the pathway that transitions to NMC811 and barely exceeded also for cobalt for the pathway that transitions to LFP. For the pathway that transitions to NMC811, some measures (i.e., reduced driving range, reduced car travel, and vehicle energy efficiency) can individually reduce the cumulative material requirements enough for nickel, but no measure achieves this for cobalt. With all measures combined, cumulative material requirements are within an equal per capita share of the material resources in both battery chemistry pathways and for all assessed materials. Staying within an equal per capita share of the reserves is shown to be more difficult. This level is exceeded in the reference scenario for all materials except manganese and nickel in the pathway that transitions to LFP. Combining all measures achieves the required level or reductions for lithium and graphite, whereas individual measures fall short. However, for cobalt in both battery chemistry pathways and nickel in the pathway that transitions to NMC811, it will be difficult to stay within an equal per capita share of the material reserves.
We do not argue that an equal per capita share of a certain reserve or resource necessarily represents a fair distribution of the resource and rather serves as an indicator of the relative use of a certain material in a country compared to the available supply. A discussion on the fair distribution of these resources should not be based solely on a per capita allocation but should also take into account sustainability challenges across material supply chains69,70, geopolitical risks71, and the role of markets and property rights72. It is also important to note that estimated global reserves should be seen as a snapshot of current conditions and are dynamic over time as resources are converted to reserves with changing economic and technological circumstances or further exploration, while reserves could also become unusable if Environmental, Social, and Governance risks are uncovered70.
From a European perspective, decreasing the reliance on these materials could have a large impact on the required imports of primary and refined materials. Only small fractions of the European demand for these materials are also extracted or refined within the European Union, except for some nickel3. Hence, reducing demand will likely also be important for reducing dependence on imports as well as limiting the need for new mining both within Europe and in other parts of the world.
Discussion
Predicting, projecting, or forecasting future demand for raw materials is difficult, not to say impossible. The complexity of such an analysis can lead to the creation of an endless number of possible scenarios, sometimes leading to hundreds of possible outcomes being explored10. It has been argued that different studies of future demand are often inconsistent and lack a real-world context73. Hence, an important aspect of studies that attempt to understand future demand pathways is to focus on exploring the impact of specific measures that could be implemented to limit the demand for raw materials.
We add perspectives on the future material demand for the electrification of passenger car fleets by explicitly highlighting the impact of different measures that can reduce the material demand for nickel, manganese, cobalt, lithium, and graphite. This is a critical issue for policy consideration in the transition to net-zero greenhouse gas emissions over the coming decades38. While achieving these emission targets is vital to mitigating severe climate change and adhering to the Paris Agreement, it is equally important to minimize socioecological impacts and avoid over-reliance on limited resources for the transition41.
In addition to the raw materials considered in our study, concerns have been raised regarding the need for phosphorus for LFP batteries74. While we do not analyze phosphorus demand explicitly, we recognize that widespread use of LFP could lead to non-negligible demand for phosphorus with associated potential challenges in ramping up phosphorus production. Note though that the measures analyzed would lower the demand for all battery materials, including phosphorus, regardless of chemistry.
We believe that analyzing the complete required material flows, without subtracting any hypothetical future material coming from recycling, is important for several reasons. First, the materials will initially need to come from virgin resources, even if a recycling industry would in fact be swiftly built out. Second, there is no guarantee that a majority of the raw materials used in batteries will be available for the battery industry. In fact, a large number of potential barriers to the circular system surrounding electric car batteries exist, including environmental, economic, and regulatory challenges75. Third, most of the potential material flows from recycled batteries will not become available for recycling until large amounts of electric cars reach their end-of-life, which is not likely to happen until the 2040s.
We show that the material demand can be decreased with orders of magnitude with other measures that result in either decreasing the number of cars in the fleet or the battery capacity per car. However, realizing these measures could be challenging since many of the analyzed measures are related to behavior, habits, and norms regarding car ownership and expected performance76, in addition to institutional barriers (i.e., investments and access to charging infrastructure) and lack of incentives (i.e., for downsizing cars, increasing efficiency beyond cost-effective measures, car sharing, and reduced travel demand)77. Vehicle energy efficiency, car sharing, and ride-sharing may also induce rebound effects, making them less effective, which have not been considered in this study. Note also that this study does not consider how the analyzed measures may influence vehicle-specific or system-level costs.
Hence, if reductions in the expected material demand are deemed necessary, public interventions may be needed to achieve these shifts on top of the existing EU regulation on battery recycling78 and the proposed regulation on public charging availability79. Such interventions could include incentives for vehicle energy efficiency and downsizing, enhanced requirements on public charging availability and support for such a development, and adjusted vehicle and/or vehicle use taxation to support teleworking and mode shifts. However, the consequences of such policy interventions in the short term need to be assessed based on more detailed analyses than the explorative scenarios developed in this study. To support such interventions, additional studies or governmental assessments are needed that take local conditions and support among the public into account.
Methods
Vehicle stock turnover model
The Swedish vehicle fleet is modeled using the Vehicle Turnover model Assessing Future Mobility services (V-TAFM)40, including assumptions on future travel demand, occupancy rate, annual mileage, and expected vehicle lifetime. Here, the model is further extended to account for car sharing in different geographical regions (i.e., cities, suburban and rural areas). Car-sharing options are likely to result in more intense car usage per year, which may impact the lifespan of the vehicle29. Hence, V-TAFM has been updated with a semi-empirical lifetime-intensity model, using the elasticity design with a Weibull distribution29.
The model is a stock-flow simulation that aims to match the travel demand, ({D}_{{{rm{T}}}}left(y,zright)), in the year, y, and for residents in a geographical zone, z, with the supply of travel services provided by the sum of all car types, c, in the fleet in the year, y: ({sum}_{c}Sleft(y,z,cright)). The car types considered include internal combustion engine vehicles (ICEVs), PHEVs, individually owned battery electric vehicles (BEVs), and shared autonomous battery electric vehicles (shared BEVs). The geographic zones in the model are large cities (A1), commuting municipalities near large cities (A2), medium-sized towns (B3), and other areas (B4-B5, C6-C9), based on the classification published by the Swedish Association of Local Authorities and Regions80. A large city has a population of above 200,000 residents, a commuting municipality near a large city is a municipality where more than 40% of the inhabitants commute to a large city, while a medium-sized town has a population of above 40,000 residents. We only consider car sharing in these zones. Although car-sharing pilots have been conducted in Swedish rural areas, they show low participation and mainly aim to reduce transport poverty rather than reducing car ownership81. Hence, we do not consider car sharing as an option in rural areas.
The supply of travel services is given by the travel range of vehicles already in the fleet, (hat{S}left(y,z,cright)), and the annual travel range, (dleft(tau ,cright)), at vehicle age, (tau =0), of the new cars sold, (Nleft(y,z,cright)), in the year, y, to meet the travel demand:
and
where the share of different car types in new car sales, ({N}_{{{rm{S}}}}left(y,z,cright)), is given by the pace of electrification and introduction of shared autonomous cars. The share of electric cars in new car sales is assumed to increase linearly from 2022 levels, based on sales statistics82, to 100% by 2030, based on the governmental proposals for rapid electrification of the passenger car fleet67, or 2035, based on the implied phase out year for internal combustion engines in the EU regulation68 (analyzed as one of the sensitivity cases, see Supplementary Table 6). The share of PHEVs in the new car sales are also phased out by the year given above. For scenarios with car sharing, the fraction of potential car owners that adopt a sharing service instead of a new car after retiring an old car follows a Gompertz curve with the inflection point at 2030 and growth rate of 20%, resulting in 37% and 98% of the potential new cars being directed towards sharing in 2030 and 2050, respectively, in geographical zones, z, where car sharing is considered.
The travel range of a car is assumed to decrease as the car grows older and is estimated by
where (tau) is the age of the car, b is the rate of decline in annual driving distance, ({d}_{0}) is the initial annual driving distance, ({bar{d}}) is the mean annual driving distance, (s) is the sharing capacity and (epsilon) the empty travel factor that depends on the car type, c. ({d}_{0}) is assumed to be 17,800 km40 and ({bar{d}}) is assumed to be 12,700 km. For ICEVs, PHEVs, BEVs, the sharing capacity and empty travel factor are both equal to 1. For shared BEVs the sharing capacity is assumed to be 5, meaning that one shared BEV is supplying travel demand equal to 5 individually owned cars65 (other assumptions are included in the sensitivity analysis, see Supplementary Table 6), and the empty travel factor is assumed to be 1.2, meaning that using shared BEVs results in 20% farther distance driven empty to pick up passengers28,65.
The travel range of vehicles already in the fleet is estimated by combining Eq. (2) and Eq. (3) for previous years:
where a semi-empirical model based on a Weibull distribution is used to account for vehicles that have already been retired. The cumulative probability function, ({{{Phi }}}_{W}left(tau ,cright)), provides the probability that a vehicle of age, (tau), and type, c, is retired and is defined as follows.
where (lambda left(cright)={lambda }_{0}{left(s(c)cdot epsilon(c) right)}^{varepsilon }) and (kleft(cright)={k}_{0}{left(s(c)cdot epsilon(c) right)}^{varepsilon beta }). The parameters used for the semi-empirical model are ({lambda }_{0}=18.046), ({k}_{0}=3.518), (varepsilon =-0.65094), and (beta =0.51109), which are based on a calibration on Swedish vehicle retirement data for the period 2014–201829. The battery lifetime is assumed to be equal to the vehicle lifetime29.
Raw material flows for electric vehicles
The material flows into, ({F}_{{{rm{in}}}}left(h,{y}right)), and out of, ({F}_{{{rm{out}}}}left(h,{y}right)), the passenger car fleet, for material, h, and year, y, are defined as
and
where (ileft(h,y,theta right)) is the material intensity for the material, h, in the year, y, and battery chemistry, (theta). The probability density function, ({phi }_{{{rm{W}}}}left(tau ,cright)), is used to estimate the share of cars sold in year, (widetilde{y}), that would be retired at year, y. The battery capacity per car is (Bleft(y,cright)=rleft(yright)cdot Eleft(r,yright)), where (rleft(yright)) is the range for cars manufactured in year, y, and (Eleft(r,yright)) is the energy use per driven km for a given range for cars manufactured in year, y. A separate module estimates the energy use per driven km, see next section. For PHEVs, the battery capacity per car is assumed to be constant at 12 kW h. Note that mild hybrid electric vehicles are not considered in this study.
The probability density function for the Weibull distribution is defined as follows.
The results are presented in terms of cumulative raw material requirements for two extreme cases, one where no recycling occurs, ({D}_{{{rm{M}}}}left(h,yright)), (called cumulative demand in the main text) and one where recycling is implemented without losses or any time delays (equal to the material in the in-use vehicle stock), ({D}_{{{rm{Mr}}}}left(h,yright)).
and
Vehicle energy use module
A separate module is used to estimate the energy use per driven km, (Eleft(r,yright)), for an electric car manufactured in the year, y, and a given vehicle range, r, using the worldwide harmonized light vehicles test cycle (WLTC). The mathematical formulation below, based on Björnsson and Karlsson21 and Cox et al.20, is discretized and solved numerically for the year 2040 based on the parameters provided in Supplementary Tables 1–3. The energy use per driven km is linearly interpolated between 2022 and 2040. Range and vehicle energy use in 2022 are based on averages reported by manufacturers47 for electric cars sold in Sweden and adjusted real-world driving conditions, see below.
We establish a relationship between the vehicle range, r, and mass (i.e., mass in running order), m, to account for the influence of battery size:
where mg is the mass of the glider, CLW is the relative mass reduction due to the use of lightweight materials, me is the mass of the engine and drivetrain (assumed to be 67 kg), md is the mass of the driver and some luggage (assumed to be 100 kg), E(m) is the average energy use per driven km as a function of the total mass, m, and ρe is the gravimetric energy density of the battery.
The power at the wheels, (P(t,{m})), is estimated as a function of time, t, and mass, m:
where a(t) is the acceleration and v(t) is the speed, both at the time, t; Cd is the aerodynamic drag coefficient, g is the acceleration due to gravity, AF is the frontal area of the vehicle, ρair is the density of air, and Cr is the rolling friction coefficient. Note that we do not include power changes for inclines since the WLTC assumes a flat surface.
The energy use per driven km, E(m), is estimated by
where CRW is a factor that accounts for real-world driving conditions (i.e., inclines and declines, heating and cooling of the cabin, and infotainment systems), ηe is the electric engine efficiency, ηd is the drivetrain efficiency, ηbd is the battery discharging efficiency, ηbc is the battery charging efficiency, and DWLTC is the total distance of the WLTC.
The speed, v(t), and acceleration, a(t), for each time step, t, are provided by the WLTC. The acceleration due to gravity, g, is 9.82 ms−2 for Swedish conditions83. The factor accounting for real-world conditions, CRW, is assumed to be 1.25 due to real-world driving conditions not accounted for in the WLTC, energy used for cabin heating/cooling, additional passengers, and infotainment systems (other assumptions are included in the sensitivity analysis, see Supplementary Table 6).
Equal per capita share of resources and reserves
A country’s equal per capita shares, Rc, of worldwide reserves or resources, Rw, for each material considered are estimated according to Eq. 4, in line with the equal cumulative per capita approach used by Robiou du Pont et al.84 for allocating national carbon budgets.
where Pc is the country’s population and Pw is the world population in year, y, which are summed over the period 2020–2050. Swedish population projections are based on Statistics Sweden’s estimates85 and global population projections are based on the Worldbank’s estimates86. The worldwide reserves and resources of each respective material are from the United States Geological Survey87 (except for the manganese resource88).

Responses