Digit regeneration is expedited in LG/J healer mice compared to SM/J non-healer mice
Introduction
More than 2 million people in the United States live with limb loss, which may arise from traumatic injury or illnesses such as diabetes, cancer, and vascular disease1,2. In addition to permanent physical disability, lower extremity amputees face social stigma, depression, and a lifetime direct healthcare cost of $870,0003,4. Prostheses enhance limb function, but the range of motion can be limited by device structure and comfort5. Currently, no interventions can successfully preserve or recover the range of motion after limb loss, and importantly, no strategies can restore the lost digits and limbs. As such, the ability to biologically regenerate missing limbs would significantly improve patient outcomes.
The ability to heal or regenerate injured tissues and organs in vertebrates is largely species-dependent6,7 (due to adaptive evolution 8) and generally decreases with advancing developmental stage, such as age9 or life cycle10. While humans exhibit limited regeneration of composite musculoskeletal tissues, there is evidence for fingertip regrowth following injury, suggesting an innate regenerative ability11,12. To this end, the murine digit has emerged as a powerful model for investigating potential mechanisms of mammalian limb regeneration13,14,15,16. After removing the tip of the terminal phalanx (P3) bone, stem/progenitor cells form a ‘blastema’, and selectively proliferate and differentiate to regrow the lost tissues, including bone, marrow, dermis, epidermis, and nail13. This response depends on the amputation level, such that removing the distal tip of P3 (up to 1/3 length) results in complete tissue restoration. In contrast, more proximal amputations (>2/3 P3 length) lead to fibrotic scarring without bone regrowth17,18,19. The early stages of regeneration are characterized by the resolution of inflammation, stem/progenitor cell activation, and extracellular matrix remodeling within the regenerate13. Bone regeneration depends on osteoclast-mediated degradation and extrusion of necrotic bone, followed by the proliferation and differentiation of osteoprogenitors, and finally, by the distal outgrowth of mineralized tissue20. Therefore, the ability of the local quiescent cell population to expand and undergo osteogenesis is crucial for a successful regenerative outcome in this model.
Regenerative capacity is also influenced by genetic variations among inbred mouse strains, with MRL/MpJ ‘healer’ mice demonstrating faster digit regrowth than C57BL/6 mice after P3 amputation21,22. Likewise, the LG/J strain (healer; bred for large size), a close relative of MRL/MpJ mice, exhibits enhanced regeneration of ear wounds and articular cartilage compared to the SM/J strain (non-healer, bred for small size)23,24,25,26. There is a wealth of information regarding the genetic loci associated with the differential healing properties of LG/J and SM/J mice, making them valuable models to probe the genetic mechanisms underlying the response to injury25,27. Studies with intercross mice that contain varying levels of LG/J and SM/J genetic backgrounds indicate that susceptibility to post-traumatic osteoarthritis and ectopic calcification depends on the genetic contribution of the parental strains24,28. For example, kinesin family member 26B (Kif26b), a highly conserved intracellular motor protein that regulates cell adhesion, migration, and tissue morphogenesis during development29,30,31, was identified as a genetic locus linked to enhanced tissue mineralization in LG/J mice28,32. Mouse strain-dependent genetic variations also manifest as global transcriptomic differences in primary chondrocytes, with LG/J cells showing enrichment in genes associated with cartilage development and SM/J cells exhibiting upregulation of inflammation-related genes33. Similarly, the MRL/MpJ mouse is protected from post-traumatic osteoarthritis and exhibits decreased levels of inflammatory cytokines in response to injury34,35. Importantly, the propensity for ear wound healing and cartilage regeneration is positively correlated, suggesting that there may be an intrinsic, heritable regenerative ability applicable to multiple tissue types24. However, whether this differential healing response between the LG/J and SM/J inbred mouse strains also translates to composite tissue regeneration after digit tip amputation remains elusive.
In this study, we investigated the regenerative response of LG/J and SM/J mouse strains to digit amputation at different levels of the P3 bone. We hypothesized that enhanced regenerative and mineralizing capacity of LG/J mice will expedite the restoration of digit tissues compared to SM/J mice. Using live-animal microcomputed tomography (microCT) imaging and a variety of in vivo labeling and histologic techniques, we tracked the trajectory of regeneration for up to 112 days post-amputation (DPA), demonstrating significant differences between the two mouse strains.
Results
Bone regeneration is accelerated in LG/J mice compared to SM/J mice
To evaluate the potential regeneration of composite musculoskeletal tissues in LG/J and SM/J mice, we conducted bilateral amputation of hindlimb digit tips at two different levels. We used longitudinal microCT scans to assess bone morphology over the time course of regeneration (Figs. 1, 2). MicroCT measurements over time showed that the rate and extent of terminal phalanx (P3) bone regeneration depended on genotype and amputation level. Both LG/J and SM/J digits consistently responded to distal regenerative (Regen) amputation (~25% P3 length removal) with controlled bone degradation and extrusion of the remaining bone fragment (Fig. 1b). At 12 DPA, P3 volume and length for both strains were reduced to ~50 and 40%, respectively, of the pre-amputated (baseline) state (Fig. 2a, b). This initial histolysis was followed by osteogenesis contiguous with the degraded bone stump, which consistently occurred by 14 DPA in LG/J mice but was not observed in SM/J mice until one week later. LG/J mice exhibited significantly greater bone volume and length than SM/J mice by 21 DPA (p < 0.05), a trend that persisted throughout the study. By 28 DPA, P3 length had exceeded the pre-amputated state in LG/J mice, whereas SM/J mice required 56 days to restore P3 length fully. At 56 DPA, LG/J mice recovered 174% and 125% of the pre-amputated P3 volume and length, respectively, compared to 131 and 98% for SM/J mice. Bone formation occurred primarily in the first 8 weeks after distal amputation, with marginal increases in P3 volume and length thereafter.
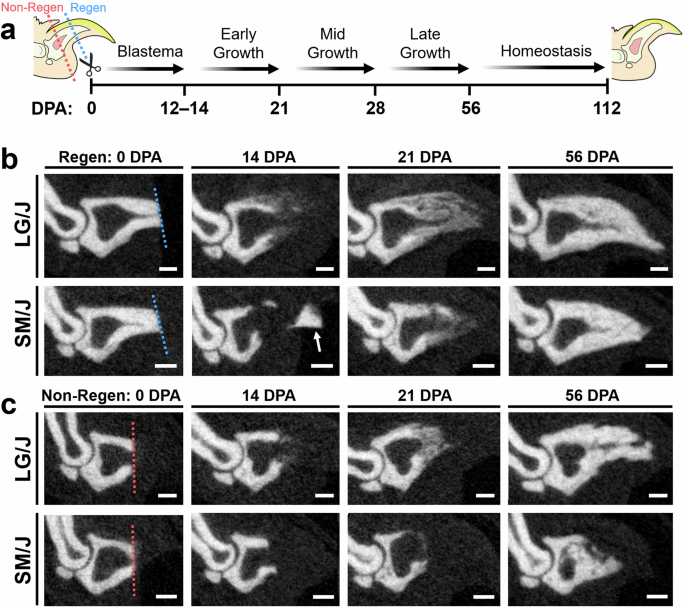
a Experimental schematic shows amputation planes for regenerative (Regen; blue dotted line) and non-regenerative (Non-Regen; red dotted line) digits and time points (days post-amputation; DPA) for microCT imaging. Sequential microCT images of the amputated terminal phalanx bone (P3) at various DPA for b Regen and c Non-Regen digits of LG/J and SM/J mice. The dotted line shows the amputation plane. The arrow shows an extruded bone fragment. Scale = 0.25 mm.
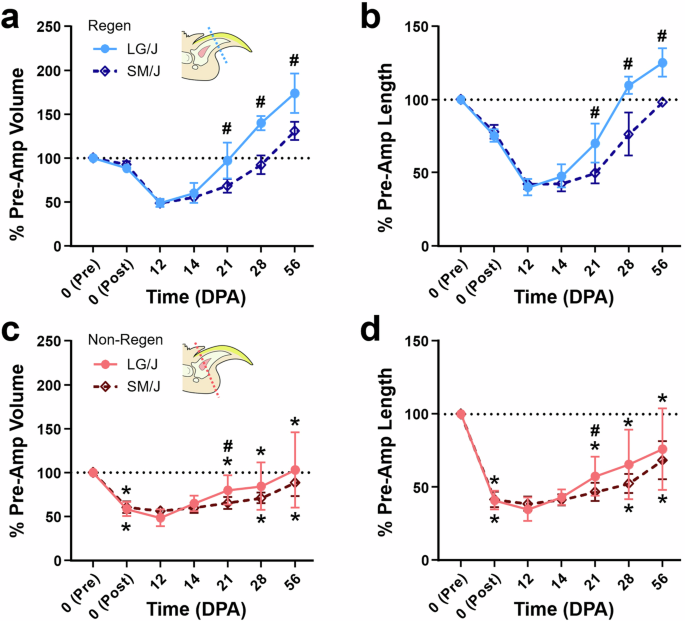
a % P3 volume and b length for Regen digits and c volume and d length for Non-Regen digits of LG/J and SM/J mice at various DPA (n = 8–16 digits/strain/time/group from 4–8 mice/strain/time, mean ± SD). The black dotted line shows a pre-amputated state. #p < 0.05 vs. SM/J. *p < 0.05 vs. Regen.
In contrast, proximally amputated (~60% P3 length removal) non-regenerative (Non-Regen) digits for both mouse strains showed minimal bone remodeling and incomplete regeneration of digit tissues. Osteogenesis initiated at the amputated bone surface and was variable within each strain, with some digits exhibiting morphological defects, such as incomplete closure of the marrow cavity and irregular contours (Fig. 1c). Non-Regen digits for LG/J and SM/J mice recovered 76 and 68% of the pre-amputated P3 length by 56 DPA, respectively (Fig. 2c, d). Importantly, a quarter of LG/J Non-Regen digits reached their pre-amputated length by 56 DPA, which was not observed for any SM/J Non-Regen digits.
Next, we used sequential time course data from individual samples to calculate the daily rate of change in bone volume and length at various regenerative stages, including Blastema (either 0–12 or 0–14 DPA), Early Growth (either 12–21 or 14–21 DPA), Mid Growth (21–28 DPA), Late Growth (28–56 DPA), and Homeostasis (56–112 DPA) (Figs. 3 and S1). Bone regrowth for both strains occurred most rapidly during the Early and Mid Growth stages (Fig. 3a, b), with LG/J mice exhibiting significantly faster gains in volume and length than SM/J mice during Early Growth (p < 0.05). For both strains, the rates of change in bone volume and length were greater for Regen digits than Non-Regen digits during the Mid Growth stage (p < 0.05). Interestingly, bone regrowth was shifted dorsally compared to the pre-amputated bone contours for Regen digits but followed the original contours for Non-Regen digits, a change that was prominent in LG/J mice (Fig. 3c). Unlike amputated digits, adjacent uninjured control digits did not exhibit significant increases in P3 volume or length compared to baseline (0 DPA) until 56 DPA (Fig. S2, p < 0.05). At 112 DPA, uninjured digits of LG/J mice exhibited 107 and 103% of the baseline P3 volume and length, while uninjured digits of SM/J mice were 113 and 105% of baseline P3 volume and length (Fig. S2e, f).
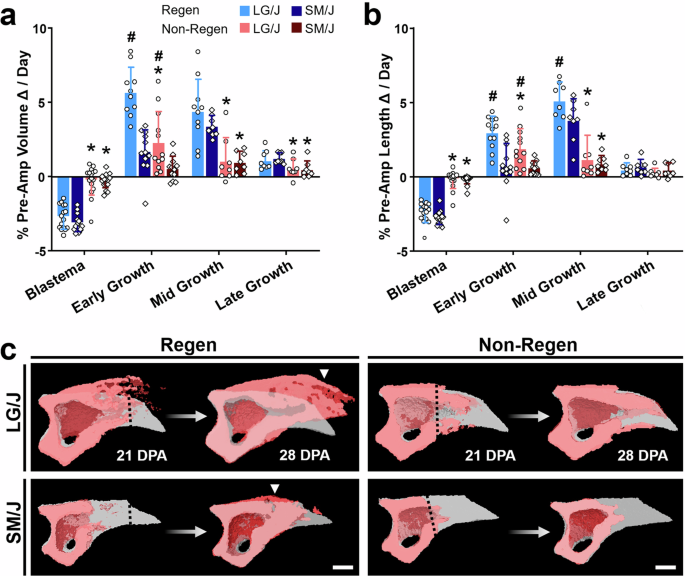
a Rate of change in % P3 volume and b length for Blastema (0–12 or 0–14 DPA), Early Growth (12–21 or 14–21 DPA), Mid Growth (21–28 DPA), and Late Growth (28–56 DPA) (n = 8–16 digits/strain/time/group from 4–8 mice/strain/time, mean ± SD). #p < 0.05 vs. SM/J. *p < 0.05 vs. Regen. c 3D microCT images show P3 sagittal cross-sections during Mid Growth (red), overlaid with the pre-amputated state (gray). The dotted line shows the amputation plane. Arrowhead shows bone overgrowth. Scale = 0.25 mm.
LG/J mice regenerate highly porous and vascularized bone
H&E and Picrosirius Red staining of histological sections revealed similar bone and soft tissue morphology between uninjured LG/J and SM/J digit tips (Fig. S2a, b). After distal amputation, Regen digits of LG/J mice showed expedited blastema formation and enhanced angiogenesis compared to SM/J mice by 12 DPA (Fig. 4a). LG/J mice also showed accelerated collagen deposition compared to SM/J mice, producing a network of highly vascularized, woven trabeculae contiguous with the bone stump by 21 DPA (Figs. 4c and S3). Regen digits of SM/J mice revealed the persistence of inflammatory cells with multilobular nuclei (neutrophils) and reduced angiogenesis at 12 DPA, as well as decreased collagen production and less developed CD31-positive neovasculature at the bone stump interface at 21 DPA. Both LG/J and SM/J mice restored the bone and soft tissues of distally amputated digits by 56 DPA, with LG/J digits exhibiting more porous bone filled with blood vessels (Fig. 4b, d). The regenerated bone of LG/J Non-Regen digits exhibited greater contour irregularity compared to LG/J Regen digits at 56 DPA (Fig. 4d), but by 112 DPA resembled the pre-amputated state (Fig. S1). However, Non-Regen digits of SM/J mice demonstrated minimal bone formation at 56 DPA (Fig. 4d), leading to disproportionately greater soft tissue outgrowth by 112 DPA (Fig. S1). Interestingly, vascular structures in the blastema were aligned in the direction of bone outgrowth at 21 DPA for Regen digits of both genotypes as well as for the LG/J Non-Regen group, suggesting that angiogenesis and osteogenesis may be coupled during digit regeneration (Fig. S3).
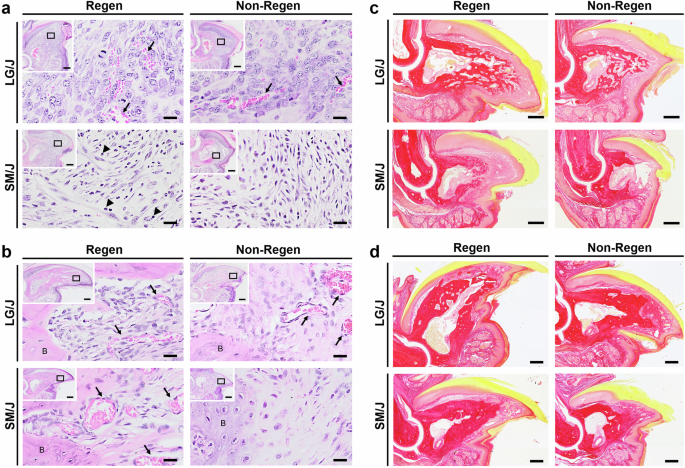
a H&E staining of the blastema at 12 DPA and b of the bone and soft tissue interface at 56 DPA of LG/J and SM/J digits. Inset indicates magnified region location at the bone/blastema interface. Arrows and arrowheads point to areas of angiogenesis and neutrophils with multilobular nuclei, respectively. Scale = 20 µm (inset scale = 0.2 mm). c Picrosirius Red staining shows collagen deposition during early growth at 21 DPA and d during late growth at 56 DPA. Scale = 0.2 mm.
Enhanced proliferative and osteogenic capacity contribute to expedited bone regeneration in LG/J mice
Next, we applied EdU and Calcein labeling to track the contribution of proliferating cells to blastema formation and bone formation, respectively. Continuous EdU administration for five days prior to sacrifice identified dividing cells during that period, whereas a single administration of Calcein labeled mineralizing tissue two days before sacrifice (Fig. 5a). EdU labeling of Regen digits at 14 DPA demonstrated a significantly higher density of proliferating cells in the mesenchymal tissues compared to uninjured controls at baseline (Figs. 5 and S2c). The proliferating cell density of the blastema was similar for Regen digits of LG/J and SM/J mice, whereas LG/J mice exhibited increased blastema cell proliferation compared to SM/J mice for Non-Regen digits (Fig. 5d, p < 0.05). To further probe the source of osteoprogenitor cells in the blastema, we analyzed cell proliferation within the dorsal periosteal (cortical surface), endosteal (endocortical surface), and marrow compartments (Fig. 5b). Cell proliferation was increased in the periosteal and endosteal compartments for Regen digits compared to the baseline for both mouse strains (Fig. 5d, p < 0.05). Importantly, proliferation was enhanced in the periosteum of LG/J mice compared to SM/J mice for both Regen and Non-Regen digits. Calcein labeling was localized to areas of EdU staining, indicating that the proliferating cells participated in new bone formation (Fig. 6b). Interestingly, cell proliferation in the endosteum and marrow increased over time in Non-Regen digits of LG/J mice, which compensated for the attenuated periosteal response (Fig. 6c). Finally, we examined the expression of Runx2, an essential osteogenic transcription factor36, and Kinesin Family Member 26B (Kif26b), a motor protein linked to heterotopic ossification28,32. Runx2 transcripts and Kif26b protein were abundant in the dorsal periosteum, endosteum, and blastema of Regen digits for both mouse strains and correlated with early osteogenic activity in those regions (Figs. 7 and S4). In contrast, while Runx2 and Kif26b were present in the Non-Regen digits of LG/J mice, they were severely attenuated in the Non-Regen digits of SM/J mice. In addition, a basal level of Kif26b was detected in the periosteum and endosteum of uninjured LG/J digits, which was absent in SM/J digits (Fig. S2g, h). Taken together, these data suggest that LG/J mice exhibit an enhanced regenerative response after digit amputation compared to SM/J mice due in part to the robust proliferative and osteogenic capacity of osteoprogenitor cells derived from the periosteum.
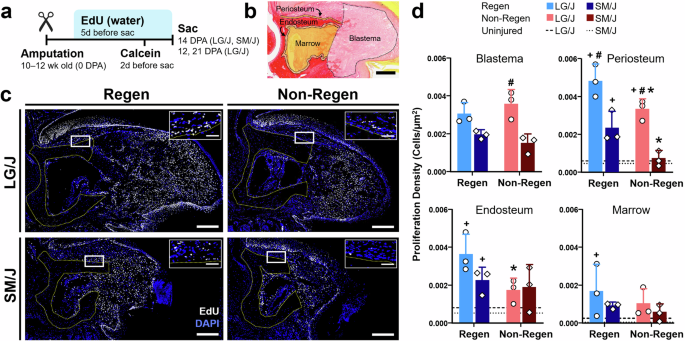
a Timeline of EdU and Calcein administration following digit amputation. b Picrosirius Red-stained section at 14 DPA illustrates the periosteum, endosteum, marrow, and blastema regions for EdU analysis. Scale = 0.2 mm. c EdU staining at 14 DPA reveals proliferating cells (white) in Regen and Non-Regen digits of LG/J and SM/J mice, with nuclei counterstained with DAPI (blue). The yellow dotted line shows the amputated bone stump. Box indicates periosteal region shown in the inset, with bone below the dotted line. Scale = 0.2 mm (inset scale = 50 µm). d Proliferating cell density at 14 DPA within the blastema, periosteum, endosteum, and marrow compartments (n = 3 digits/strain/time/group from 3 mice/strain/time, mean ± SD). Dashed and dotted lines indicate baseline proliferation of uninjured LG/J and SM/J digits, respectively. #p < 0.05 vs. SM/J. *p < 0.05 vs. Regen. +p < 0.05 vs. Uninjured (0 DPA).
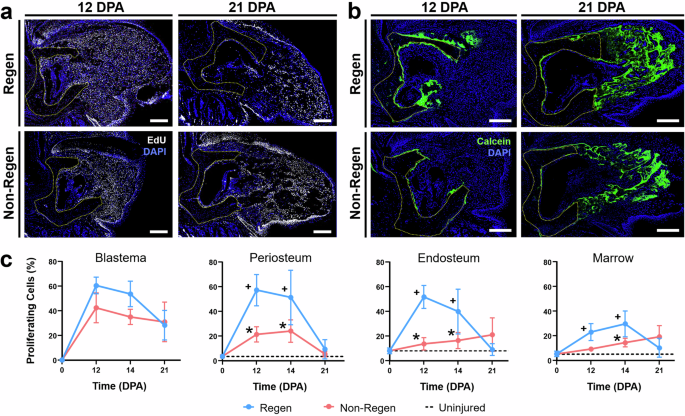
a EdU and b Calcein staining at 12 and 21 DPA reveals proliferating cells (white) and newly mineralized tissue (green) in Regen and Non-Regen digits of LG/J mice, with nuclei counterstained with DAPI (blue). The yellow dotted line shows the amputated bone stump. Scale = 0.2 mm. c % of proliferating cells at various DPA within the blastema, periosteum, endosteum, and marrow compartments of LG/J digits (n = 3 digits/strain/time/group from 3 mice/strain/time, mean ± SD). Dashed lines indicate baseline proliferation of uninjured digits. *p < 0.05 vs. Regen. +p < 0.05 vs. Uninjured (0 DPA).
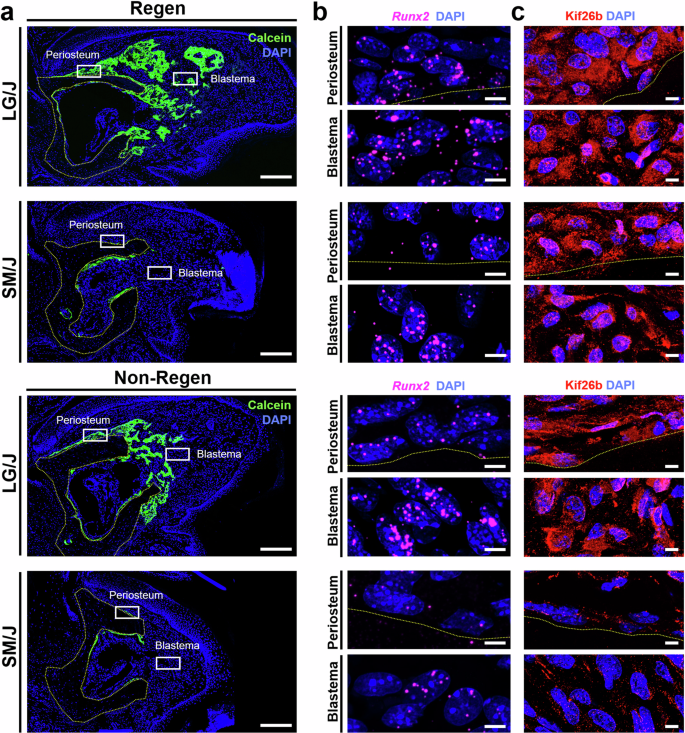
a Calcein staining at 14 DPA shows newly mineralized tissue (green) in Regen (top) and Non-Regen digits (bottom) of LG/J and SM/J mice, with nuclei counterstained with DAPI (blue). The yellow dotted line shows the amputated bone stump. Boxes indicate corresponding regions shown in (b, c). Scale = 0.2 mm. b RNA FISH targeting Runx2 (magenta) and c immunostaining for Kif26b (red) in the periosteum and blastema at 14 DPA, with bone below the dotted line. Scale = 5 µm.
Discussion
LG/J healer mice are known for their enhanced wound healing abilities following trauma, such as joint destabilization, or tissue resection like ear puncture23,24,26,37,38. In this study, we demonstrate that LG/J mice also possess a superior regenerative response compared to SM/J non-healer mice after level-dependent amputation of the terminal phalanx (P3) bone. These findings support the hypothesis that the genetically heritable, regenerative phenotype of LG/J mice37,38 applies to various musculoskeletal injuries, including digit tip amputation. Accelerated digit bone regeneration is associated with expedited proliferation and osteogenic differentiation of mesenchymal stem/progenitor cells, which become activated upon injury. Notably, the periosteum of LG/J mice exhibited significantly higher cell proliferation rates after amputation compared to SM/J mice. Consequently, LG/J mice demonstrated accelerated bone regrowth from ~2 to 4 weeks post-amputation compared to SM/J mice, resulting in a greater accretion of mineralized tissue. Since the uninjured P3 bone length of LG/J mice was ~5% longer than their SM/J counterparts, LG/J mice had to compensate for a greater loss of tissue mass. Interestingly, LG/J mice consistently over-compensated the regenerated bone volume and length after distal (Regen) amputation, primarily in the dorsal cortical region where periosteum-derived cells are activated. While previous studies show that the regenerated bone volume exceeds that of unamputated controls in various adult mouse strains14,39, the significant increase in regenerated bone length appears unique for LG/J mice. This imperfect regeneration may be due to rapid cell proliferation at early time points, coupled with a lack of robust mechanisms that prevent overgrowth. However, the rate of bone outgrowth in LG/J mice after 28–56 DPA was comparable to SM/J mice, indicating that outgrowth is ultimately limited.
LG/J and SM/J inbred mouse strains are often used to investigate the genetic determinants of complex traits23,24,25,27,28,33,40. Previous genetic linkage studies have reported strain-dependent gene regulation after injury, encompassing genes involved in cell cycle progression, cell adhesion, matrix remodeling, angiogenesis, and developmental pathways such as canonical Wnt/β-catenin signaling25,27. The enhanced bone regeneration observed in this study is congruent with quantitative trait loci mapping analysis of LG/J and SM/J mice, revealing variations in genes associated with osteoblast metabolism (Ptprz1), skeletal development (Wnt16), and bone mineral density (Cped1) that are thought to contribute to the larger tibial size of LG/J mice41. In this study, the increased expression of Runx2 and Kif26b of LG/J osteoprogenitor cells in the periosteum, endosteum, and blastema suggest that they are primed to be more osteogenic than SM/J cells within the same tissues. Elevated Kif26b expression in stem/progenitor cells may stimulate cell proliferation and osteogenic gene expression, potentially impacting the Wnt/β-catenin signaling pathway32,42. Kif26b also governs endothelial cell migration and sprouting, which is crucial for angiogenesis30. Overall, this suggests that cellular and molecular mechanisms contributing to development may affect regeneration later in adulthood, although poorly controlled cell division and differentiation can drive malignancy42. Genetic variations can also influence regeneration by indirectly impacting physiology on a systemic level. For example, SM/J mice exhibit an elevated immune response43 and a predisposition to glucose intolerance and diabetes compared to LG/J mice44, which may negatively affect wound healing45. Additionally, non-genetic factors such as gut microbial composition46, mechanical loading47, and animal age9 can modulate regenerative outcomes.
Interestingly, the LG/J strain also exhibited enhanced regenerative ability after P3 amputation at more proximal (Non-Regen) levels, whereby LG/J Non-Regen digits recovered greater percentages of their pre-amputated bone volume and length at 21 DPA compared to SM/J mice. This may be partly attributed to the higher level of cell proliferation in the blastema and periosteum of LG/J mice. Similarly, there is a positive correlation between the proliferative capacity (Pcna gene expression level) of connective tissue cells in LG/J mice and the regenerative capacity of articular cartilage in the knee joint, both of which were decreased in SM/J mice26. Nonetheless, both LG/J and SM/J mice failed to fully restore the P3 length in all cases, indicating that the anatomical threshold between regeneration and scarring is similar between strains. The attenuated response of Non-Regen digits is likely due to a reduced pool of periosteal progenitors, such that partial regrowth is primarily mediated by the remaining endosteal/marrow cells. A recent study showed that osteoprogenitors from the P3 periosteum and endosteum/marrow contribute to the blastema, and that periosteal removal reduces bone formation along the proximal-distal and dorsal-ventral axes20. Depletion of the nail matrix after proximal amputation also disrupts epithelial-mesenchymal Wnt signaling, resulting in defective bone outgrowth48. To this end, expanding the remaining progenitor cell pool via exogenous growth factor delivery holds promise for enhancing bone regeneration after proximal amputation18,49,50.
While we observed enhanced digit regeneration in LG/J mice compared to their SM/J counterparts, additional studies are required to elucidate the exact mechanisms underlying these responses. For example, it is necessary to determine whether the accelerated bone regeneration in LG/J mice is linked to the genetic variations of select osteogenic genes or broader systemic differences, such as that of the immune response. This work also focused exclusively on LG/J and SM/J parental strains and did not examine the effect of genetic contribution using LG/J and SM/J intercross mice. Furthermore, it remains unknown whether the enhanced regenerative potential of LG/J mice is due to cellular properties, extracellular matrix features51, or both. Functional assessment of the proliferative and osteogenic capacities of osteoprogenitor cells derived from the periosteum of LG/J and SM/J mice, as well as cell transplantation between mouse strains at different amputation levels, will be pursued in future studies to answer this specific question. Lastly, while a minimum of three animals per group was quantified for time points up to and including 56 DPA, additional mice should be evaluated at 112 DPA to fully capture the biological variation between replicates at homeostasis. A better understanding of the source(s) of stem/progenitor cells, as well as what signals promote and/or inhibit their activity, will enable us to implant engineered cells that stimulate composite musculoskeletal regeneration at the amputation site. In the long term, applying the knowledge gained from this research to more proximal digit and/or limb amputation models50 could lengthen the amputated stump bone to enable a better fit for prosthetics. Such outcomes will significantly enhance the quality of life for patients with extremity injuries.
Methods
Mouse model of digit amputation
To evaluate mouse strain-dependent capacity for composite tissue regeneration, we performed bilateral amputation of hindlimb digits at either distal or proximal levels using 10 to 12-week-old LG/J and SM/J mice (n = 8 mice/strain; 5 females, 3 males per strain; bred in-house). All experiments were approved by the Institutional Animal Care and Use Committee of Washington University in St. Louis and followed the recommendations in the Guide for the Care and Use of Laboratory Animals of the National Institutes of Health. Mice were anesthetized with isoflurane, subjected to amputation of digits 2 and 4 of each hindlimb under a dissection microscope (Leica M320, Leica Microsystems GmbH, Wetzlar, Germany), and perioperatively given sustained-release Buprenorphine (0.5 mg/kg subcutaneously) for analgesia. Regenerative (Regen) and Non-Regenerative (Non-Regen) conditions were established on each limb by removal of ~25% (distal amputation) or ~60% (proximal amputation) of the length of the terminal phalanx bone (P3), respectively (n = 2 digits/group/mouse; Fig. 1a)14. The uninjured digit 3 of the same limb acted as an intact control. Mice were permitted free cage activity until sacrifice. Animals were euthanized via CO2 narcosis at either 12, 14, 21, 56, or 112 days post-amputation (DPA), which was carried out by institutional policy for the humane sacrifice of animals.
A separate cohort of LG/J mice was used to determine differences in cell proliferation and bone mineralization for Regen and Non-Regen digits at 12, 14, and 21 DPA, with uninjured digit 3 acting as 0 DPA controls (n = 3 mice/time; 10 to 12-week-old males; bred in-house). SM/J mice were used to compare these outcomes between mouse strains at 14 DPA during blastema formation (n = 3 mice; 10 to 12-week-old males; bred in-house). To label proliferating cells starting 5 days before sacrifice, mice were given drinking water supplemented with 0.2 mg/mL 5-ethynyl-2’-deoxyuridine (EdU; Invitrogen, Carlsbad, CA) and 5% sucrose (Sigma-Aldrich, St. Louis, MO), which was replaced daily until euthanasia (Fig. 5a). Two days before sacrifice, Calcein (0.25 mg/mL; Sigma-Aldrich, St. Louis, MO) was administered intraperitoneally to label mineralizing bone. Animals were euthanized at the end time point as previously described.
In vivo imaging and analysis
Digits were imaged by in vivo microcomputed tomography (microCT) pre- and post-surgery at 0 DPA (n = 16 digits/strain/group from 8 mice/strain) to quantify P3 volume and length (9 µm resolution, 200 µA, 50 kV, 1 mm Al filter, 47° rotation/step; Bruker SkyScan 1176; Bruker Corporation, Billerica, MA). Longitudinal scans were performed to capture five regenerative stages: Blastema at either 12 DPA (n = 6 digits/strain/group from 3 mice/strain) or 14 DPA (n = 10 digits/strain/group from 5 mice/strain), Early Growth at 21 DPA (n = 12 digits/strain/group from 6 mice/strain), Mid Growth at 28 DPA (n = 8 digits/strain/group from 4 mice/strain), Late Growth at 56 DPA (n = 8 digits/strain/group from 4 mice/strain), and Homeostasis at 112 DPA (n = 4 digits/strain/group from 2 mice/strain). Both 12 and 14 DPA scans were included in the Histolysis stage to account for variability between animals of the same genetic strain. MicroCT scans were processed using an established Bruker pipeline to isolate and reconstruct binarized 3D images of the P3 bone14. The volume and length of the P3 bone were measured for each digit using Bruker CTAn software (Bruker Corporation, Billerica, MA), where the length was calculated as the average of two linear measurements made from the proximal to distal edges in the mid-sagittal plane. Next, the rate of change in volume and length over time for each regenerative stage was calculated using values from sequential scans of individual digits (n = 4–16 digits/strain/time/group from 2–8 mice/strain/time). Five stages were analyzed: Blastema (either 0–12 or 0–14 DPA), Early Growth (either 12–21 or 14–21 DPA), Mid Growth (21–28 DPA), Late Growth (28–56 DPA), and Homeostasis (56–112 DPA). Image registration of P3 volumes from 0 DPA and subsequent time points was achieved with Bruker CTVol software (Bruker Corporation, Billerica, MA) to visualize morphometric changes in the mid-sagittal plane over time.
Histological and immunohistochemical analysis
After sacrifice, harvested digits were fixed in 10% Neutral Buffered Formalin (VWR International, Radnor, PA) overnight, washed in phosphate-buffered saline (PBS; Gibco, Grand Island, NY), decalcified using 10% Ethylenediaminetetraacetic acid (Corning Inc., Corning, NY), and processed for histology (n = 2–4 digits/strain/time/group from 1–2 mice/strain/time). Samples were stored at 4 °C until sectioning. Mid-sagittal paraffin sections (5 µm thickness; Leica RM 2255, Leica Microsystems GmbH, Wetzlar, Germany) were stained with Hematoxylin (Poly Scientific R&D Corp., Bay Shore, NY) and Eosin (Sigma-Aldrich, St. Louis, MO) (H&E) to visualize cells and matrix, and with Picrosirius Red (PSR; Sigma-Aldrich, St. Louis, MO) to assess collagen deposition. Slides were imaged with a bright field microscope at 10X and 20X magnification (Olympus VS120; Olympus Corporation, Tokyo, Japan). A polarized light filter was applied to slides stained with Picrosirius Red14. To detect Kif26b protein expression, paraffin slides were deparaffinized and rehydrated prior to antigen retrieval with Proteinase K (10 μg/mL; Abcam, Waltham, MA) and blocked with 10% normal goat serum at room temperature for 1 h. Sections were incubated overnight at 4 °C with rabbit anti-Kif26b primary antibodies (1:50; 17422-1-AP, Thermo Fisher Scientific, Waltham, MA), followed by washing and incubation for 1 h with Alexa 594-conjugated secondary antibodies (1:200; ab150080, Abcam, Waltham, MA). After another wash, slides were counterstained with Fluoro-Gel II with 4,6-diamidino-2-phenylindole (DAPI; Electron Microscopy Sciences, Hatfield, PA) to visualize cell nuclei. Slides were imaged at 63X magnification with an oil immersion objective using a confocal laser scanning microscope and Airyscan detector (Zeiss LSM 880; Carl Zeiss AG, Oberkochen, Germany; 405 nm for DAPI and 561 nm for Kif26b). Maximum projections of stitched z-stacks (0.16 µm z-step; ~5 µm total thickness) were used for analysis. To label neovasculature, immunohistochemistry was performed for the endothelial marker CD31, also known as platelet endothelial cell adhesion molecule-1 (PECAM-1). Paraffin slides were deparaffinized and rehydrated prior to antigen retrieval with sodium citrate buffer containing 0.05% Tween 20. Endogenous peroxide was quenched using 3% H2O2 in PBS. Sections were blocked with 2.5% normal goat serum at room temperature for 45 min and then incubated overnight at 4 °C with rabbit anti-CD31 primary antibodies (1:500; ab182981, Abcam, Waltham, MA), followed by washing and incubation for 30 min with horseradish peroxidase-conjugated secondary antibodies (ImmPRESS HRP Goat Anti-Rabbit IgG Polymer Detection Kit, Vector Laboratories, Inc., Newark, CA). The ImmPACT DAB Substrate Kit (Vector Laboratories, Inc., Newark, CA) was used to detect CD31 staining. Slides were counterstained with Methyl Green and imaged with a bright field microscope at 4X and 20X magnification (Echo Revolution; Discover Echo, Inc., San Diego, CA).
Visualization and analysis of in vivo markers
To visualize in vivo markers of cell proliferation and tissue mineralization, harvested digits were fixed in 4% paraformaldehyde (Electron Microscopy Sciences, Hatfield, PA) overnight and incubated in 30% sucrose at 4 °C for 48 h. Digits were embedded in optimal cutting temperature compound (Sakura Finetek USA, Inc., Torrance, CA) and stored at −80 °C away from light until sectioning. Frozen blocks were sectioned in the sagittal plane to 8 µm thickness using a cryostat microtome (Leica CM3050 S, Leica Microsystems GmbH, Wetzlar, Germany). An adhesive tape (Cryofilm Type 2 C(9); Section Lab Co. Ltd., Yokohama, Japan) was applied to the cutting surface to facilitate the sectioning of mineralized tissues, which adhered to the tape surface without disrupting morphology52. The sections were attached to glass slides using a chitosan (Sigma-Aldrich, St. Louis, MO) adhesive applied to the underside of the tape, which was set overnight. Cryosections were stored at 4°C until use. Adjacent mid-sagittal tissue sections were used to evaluate mineralization (Calcein labeling) and cell proliferation (EdU incorporation). The Click-iT EdU Cell Proliferation Kit (Invitrogen, Carlsbad, CA) was used per the manufacturer’s instructions to visualize proliferating cells over the 5-day period before sacrifice (n = 3 digits/strain/time/group from 3 mice/strain/time). Briefly, tape-mounted sections were hydrated in PBS, permeabilized using 0.5% Triton X-100 (Sigma-Aldrich, St. Louis, MO), and incubated with the kit reagents and Alexa Fluor 647 dye. Sections were washed in PBS, counterstained with DAPI (Sigma-Aldrich, St. Louis, MO), mounted using ProLong Gold Antifade Mountant (Invitrogen, Carlsbad, CA), and stored at 4 °C away from light until imaging. To visualize mineralizing tissue, tape-mounted sections were hydrated in PBS, counterstained with DAPI, and mounted as previously described. All samples were imaged at 20X magnification using a confocal microscope (Zeiss LSM 880; Carl Zeiss AG, Oberkochen, Germany; 405 nm for DAPI, 488 nm for Calcein, and/or 633 nm for EdU). Maximum projections of stitched z-stacks (1 µm z-step; ~10 µm total thickness) were used for analysis. To quantify cell proliferation, images in the DAPI and EdU channels were binarized using Zeiss Zen software (Carl Zeiss AG, Oberkochen, Germany). The percentage of actively proliferating cells was defined as the area of EdU-positive cells (areas containing signals from both DAPI and EdU channels) divided by the total area of the DAPI signal. This value was calculated for four distinct regions in the digit cross-section using Fiji53: (1) dorsal periosteum (region lining the dorsal P3 exterior, extending 20 µm from the cortical bone surface), (2) endosteum (region lining the interior P3 surface, extending 20 µm from the endocortical surface into the marrow space), (3) marrow space (region within the medullary cavity, excluding the endosteum), and (4) blastema (mesenchymal tissue distal to the bone stump) (Fig. 5b).
RNA fluorescence in situ hybridization (FISH)
To visualize messenger RNA expression of the osteogenic transcription factor Runx2, formalin-fixed paraffin sections (5 µm thickness) were deparaffinized, treated with hydrogen peroxide, and subjected to target retrieval using a steamer and protease digestion. RNA FISH was performed using the RNAscope Multiplex Fluorescent V2 Assay (Advanced Cell Diagnostics, Newark, CA) according to the manufacturer’s instructions14. Briefly, the tissue sections were incubated in a hybridization oven with the RNAscope mouse Runx2 probe (Advanced Cell Diagnostics, Newark, CA), followed by probe signal amplification and conjugation with a fluorophore (Opal 650; Akoya Biosciences, Inc., Marlborough, MA). Afterward, sections were counterstained with DAPI and mounted as previously described. RNAscope 3-plex positive and negative control probes provided by the manufacturer were run with each experiment on additional samples to ensure quality control. Slides were imaged at 63X magnification with an oil immersion objective using a confocal laser scanning microscope and Airyscan detector (Zeiss LSM 880; Carl Zeiss AG, Oberkochen, Germany; 405 nm for DAPI and 633 nm for Runx2). Maximum projections of stitched z-stacks (0.16 µm z-step; ~5 µm total thickness) were used for analysis.
Statistical analyses
Significance was assessed using GraphPad Prism 10 (GraphPad Software, Boston, MA) by two-way ANOVA or by fitting a mixed model to handle missing values, with Tukey’s post hoc test (p < 0.05) to compare the effects of genotype and amputation level on bone morphology, growth rate, and/or cell proliferation at each time point. Digits from a minimum of two individual mice were assessed per strain/time/group to account for biological variation for all quantitative analyses. Data were shown as mean ± standard deviation unless stated otherwise.

Responses