Stroke-induced neuroplasticity in spiny mice in the absence of tissue regeneration
Introduction
Stroke is currently the second leading cause of death in adults over the age of 40 and a leading cause of disability in the world, and will continue to remain a major concern as the average population age increases1,2. In an ischemic stroke, oxygen and nutrients are prevented from reaching the impacted neural tissue due to a blockage in a blood vessel. This leads to a cascade of events over days to weeks, including neuronal cell death, neuroinflammation, glial scarring, angiogenesis, and neurogenesis3. The only approved clinical interventions for acute stroke are intravenous thrombolysis with recombinant tissue-type plasminogen activator (tPA) and mechanical thrombectomy. Both treatments must occur rapidly following a stroke for successful removal of the blood clot and are only available to a small number of patients due to variability in occlusion time and size of the blood vessel and increased risk of intracerebral hemorrhage associated with tPA and the likelihood of vessel perforation during mechanical clot retrieval4. Presently, no methodology exists to restore lost neural tissue, and patients have limited functional recovery. Thus, the development of novel stroke therapies focused on regenerating neural tissue and restoring long-term functionality by restoring lost tissue and/or enhancing neuroplasticity will be highly beneficial to affected individuals while reducing costs to the healthcare system5.
Traditional rodent models, including mice (Mus musculus) and rats (Rattus norvegicus), have provided invaluable biochemical and behavioral insights into the brain’s response to stroke6. These rodents do not regenerate lost tissue following stroke damage, but instead mount a robust neuroinflammatory response followed by the formation of an astrocyte scar around the lesion site7,8. This is despite a pro-regenerative response where neural stem/progenitor cells proliferate and differentiate into neuroblasts that migrate to the damage site9,10,11. Typically, rodents develop impairment in sensorimotor behavioral tests after injury compared to baseline assessments, such as decreased exploration in an open field, frequent circling, and moderate neurological deficits for more than 21 days12,13,14. While these studies have been incredibly informative to stroke research, there are multiple limitations to using these models. One limitation is that the cerebral vasculature of most rodents is very uniform15, which may provide reliable and consistent results in the laboratory, but fails to accurately represent cerebral vasculature and stroke heterogeneity in humans, thereby negatively impacting therapeutic efficacy6,16. Additionally, common rodent models do not possess attributes that protect them from stroke, such as neuroprotection of damaged tissue, regeneration of lost neuronal tissue, or restoration of brain functional connectivity17,18. This highlights a need to study non-traditional animal models that possess endogenous neuroprotective or compensatory attributes to stroke or better model the stroke heterogeneity seen in patients.
Spiny mice (Acomys cahirinus) are desert rodents native to Africa19,20. Many species in this genus, including cahirinus, have the unique ability among mammals to regenerate their skin in the absence of fibrotic scarring21,22,23. They are also capable of regenerating other tissues, including muscle, kidney, hair follicles, and the ear cartilage24,25,26,27. Recently, studies on the regeneration of the spinal cord following both hemi-section and full transection show that this regenerative capacity extends to the central nervous system (CNS) with little to no glial scarring28,29. Interestingly, they have significant hind-limb motor recovery within 8 weeks, and they recover bladder control two days after spinal cord injury suggesting that functional recovery might occur prior to regeneration; however, this was not directly assessed28,29. Additionally, Acomys have been shown to have rapid functional recovery in the heart where they have improved ejection fraction and recovery with differential scarring compared to Mus after myocardial infarction30,31,32. To date, no studies have examined the response of Acomys to ischemic stroke. It is known that Acomys has variability in their cerebral vasculature with three separate variants of the circle of Willis in these animals: variant 1, completely closed circle for 25% of animals; variant 2, incomplete circle with opening on caudal side for 33% of animals; variant 3, lack of a circle with openings on rostral and caudal sides for 42% of animals33. This variability is in contrast to the uniform cerebral vasculature seen in common rodent models, and better represents the heterogeneity of cerebral vasculature that occurs in patients15. While the unique regenerative capacity and heterogeneous cerebral vasculature of Acomys make additional research desirable, there are limitations to the species as a model including small litter sizes (1–3 pups), a longer gestation time (~40 days), and an increased interval to sexual maturity compared to other common laboratory rodents, such as Mus musculus, that make research in Acomys comparatively challenging34. An additional constraint inherent to Acomys studies is the lack of validated research tools ranging from antibodies to behavioral paradigms.
For this study, we investigated the functional recovery and neural regenerative capacity of Acomys following a transient ischemic stroke, which is one of the models that most closely mimics human stroke35,36. Acomys showed rapid functional behavioral recovery (i.e., low to absent neurological deficit scores and circling behavior and open field behavior similar to baseline) following this injury despite a failure to regenerate neural tissue with the presence of a glial scar as assessed by MRI and histological analysis. To ascertain the basis for this functional recovery, we generated an MRI-based Acomys cahirinus brain atlas and used this new resource combined with resting state functional MRI (rsfMRI) analysis to demonstrate that neuroplasticity may be responsible for their remarkable post-stroke recovery. We observed no significant changes within the whole brain connectome from baseline to 28 days after injury, contrasting with the impaired human brain connectome observed following a stroke18. However, similar to humans37,38,39 key brain regions in Acomys transitioned into new neural hubs. Thus, the Acomys stroke model provides a unique resource for further studies on both behavioral recovery and brain connectivity.
Results
Ischemic stroke induction in Acomys
Acomys have recently been shown to regenerate parts of their CNS with little to no glial scarring and rapid behavioral recovery after both a hemi-section and full transection of the spinal cord28,29. To better understand the neural resilience and regenerative potential of Acomys in the brain, we performed middle cerebral artery occlusions to model a stroke in 6–8 month-old Acomys. To assess the feasibility of these stroke models, the infarct volumes were assessed at 48 h after either 1 h-tMCAO or pdMCAO via cresyl violet staining (Supplementary Fig. 1a, b). The tMCAO model had an infarct of 5–22% of the hemisphere primarily in the striatum (Supplementary Fig. 1c), while the pdMCAO model had less damage with an infarct in the cortex, around 5% of the hemisphere at 48 h post injury (Supplementary Fig. 1d). We elected to perform the tMCAO model for future surgeries due to the increased damage size and the clinical relevance to patients experiencing spontaneous recanalization or those receiving tPA treatment and/or mechanical thrombectomy40. All stroke experiments in this study, excluding Supplemental Fig. 1b, d, were done with animals experiencing 1 h tMCAO surgery. A brief visual description of our short-term and long-term experiments is provided (Fig. 1a). Infarct size was analyzed from the increased blood-oxygen-level-dependent (BOLD) signal from the MRIs and confirmed a unilateral stroke injury as well as noted variability in the size of the injury (Fig. 1b). During surgery, cerebral blood flow (CBF) was monitored and recorded via laser Doppler flowmetry, and we noted a substantial variation in CBF response to occlusion (Supplementary Fig. 1e). This variability is attributed to the damage location, which is more striatal and hippocampal rather than cortical as visualized via MRI (Fig. 1c). Due to the inconsistency of the CBF recordings, we monitored initial circling behavior of animals during the occlusion period and immediately after removal of the occlusion (Supplementary Fig. 1f) for evidence of successful occlusion. A representative video of one Acomys circling is provided (Supplementary Movie 1). This variability was attributed to variation in the Acomys circle of Willis vasculature33. The post-surgery survival rate was 66% (n = 21), with the majority of deaths occurring within the first two weeks after surgery (Fig. 1d). One animal died from seizures, while the others developed fluid-filled lungs as detected by necropsy. Weight was monitored every day for the first two weeks and weekly afterwards until the experimental endpoint. Of the animals that survived, the majority returned to within 5% of their baseline weight within the first two weeks, with one exception that took nine weeks (Fig. 1e). To investigate the recovery of Acomys, neurological deficits (ND, Supplementary Table 1) were recorded; where a score of 0 indicates no deficit and a score of 3 indicates a humane endpoint due to extreme deficits. While all Acomys transitioned from an ND of 0 to 1 on the day of surgery, many returned to an ND of 0 at 24 h post-surgery with a slight rebound at 48 h in a subset of animals (Fig. 1f). Two animals reached an ND of 3, one of our humane endpoints, and were marked as dead in the figure due to euthanasia. No animals reached an ND of 4 and the remainder of dead animals were found deceased. Interestingly, some animals were found dead after exhibiting an ND of 0 the previous day, while a number of animals had successful remediation of an ND of 1 (Supplementary Fig. 1g).
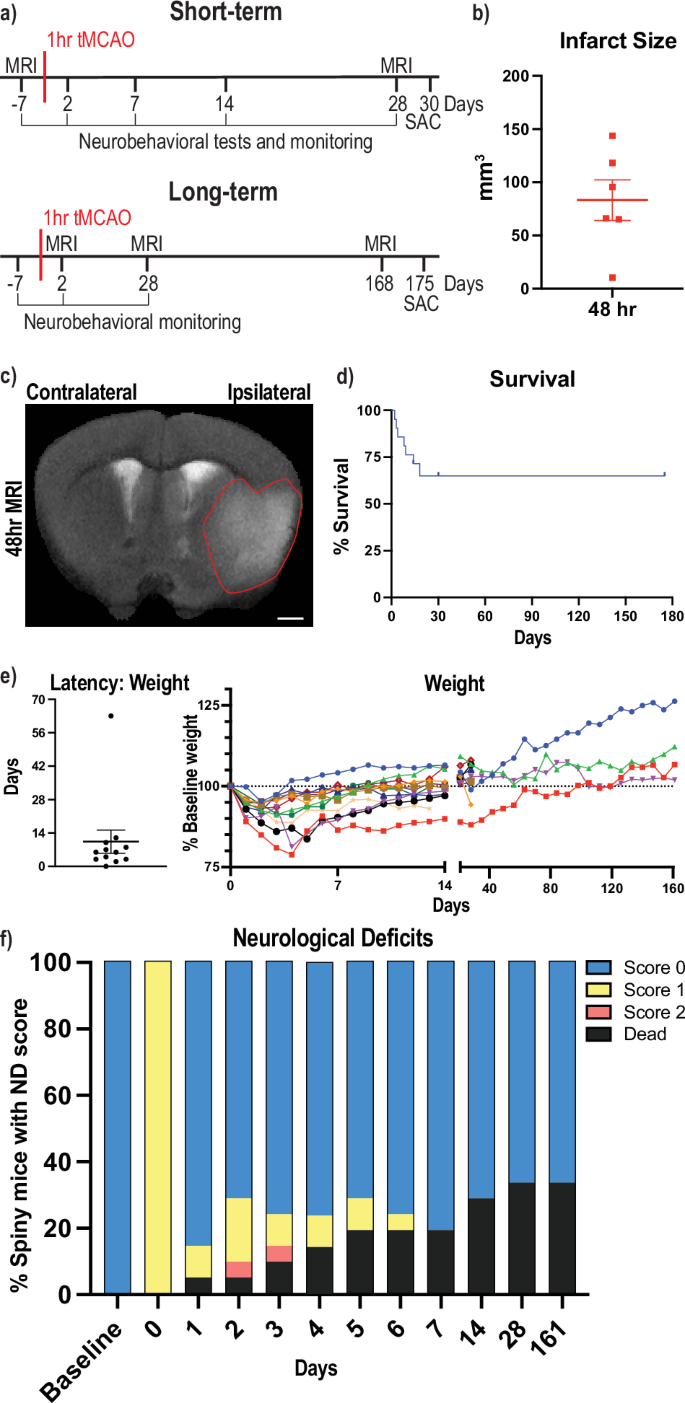
a Brief description of the different experimental paradigms with short-term studies on top and long-term studies below. Numbers represent days post transient middle cerebral artery occlusion (tMCAO) surgery, SAC = sacrifice at experimental endpoint. b Quantification of infarct size from MRI images in mm3 on the ipsilateral (damaged) hemisphere at 48 h post tMCAO. c Anatomical magnetic resonance brain image (MRI) of Acomys 48 h following tMCAO surgery. Representative image of the brain is shown and infarct region outlined. Scale bar = 1 mm. d Percent animal survival at 14, 30, and 175 days. e Latency (days) to return to 95% baseline weight post-surgery (left) and individual animal weights (right, colored lines) as a percentage of pre-surgery weight. Dotted line represents 100% baseline weight across time. f Neurological deficits as a percentage of animals falling into each category (n = 21 animals per time point).
Acomys fail to regenerate stroke-damaged brain regions
Since Acomys are characterized by scarless regeneration of injured tissue, we investigated if the animals had similar ability to regenerate their brain after tMCAO-induced stroke. Due to the variability in the injured region, we utilized non-invasive longitudinal MRIs to track damage progression in individual animals. Two experiments were performed tracking animals from baseline to 4 weeks post injury (wpi) and another from 4 wpi to 24 wpi. Baseline MRIs showed no damage in animals before surgery with the white (BOLD) signal indicating ventricular cerebrospinal fluid (CSF) (Fig. 2a). A representative image of an animal 4 wpi shows substantial damage to the striatum, hippocampus, piriform cortex, and amygdala where the cavities left by damaged brain tissue has been filled with CSF (Fig. 2b). The same animal scanned at 24 wpi showed similar if not increased damaged areas with time (Fig. 2c). To validate that the BOLD signal was CSF, cresyl violet staining was performed on all Acomys brains at 25 wpi (a representative image is provided), and confirmed that the damaged brain region matches what was observed by MRI and filled with CSF (Fig. 2d). Additional cresyl violet stains were performed at 30 days post injury (dpi) that confirmed the BOLD signal is CSF (Supplementary Fig. 2a). The short-term experiment showed that damage was present at 4 wpi (n = 6) with increases in the percentage of ventricles on the ipsilateral hemisphere, although there were two animals that did not show any damage via MRI (Fig. 2e). In the long-term experiment, there was a significant change in the percentage of ventricle area on the ipsilateral hemisphere over time (Fig. 2f). Additionally, both the total brain size and percentage of the brain that was healthy significantly decreased from baseline to 28 dpi with both trending down from 28 dpi to 168 dpi (Supplementary Fig. 2b, c). Accordingly, the estimated infarct size increased from baseline to 28 dpi and trended towards increased estimated infarct size from 28 dpi to 168 dpi (Supplementary Fig. 2d). MRI scanning parameters for all types of scans are provided (Supplementary Table 2).
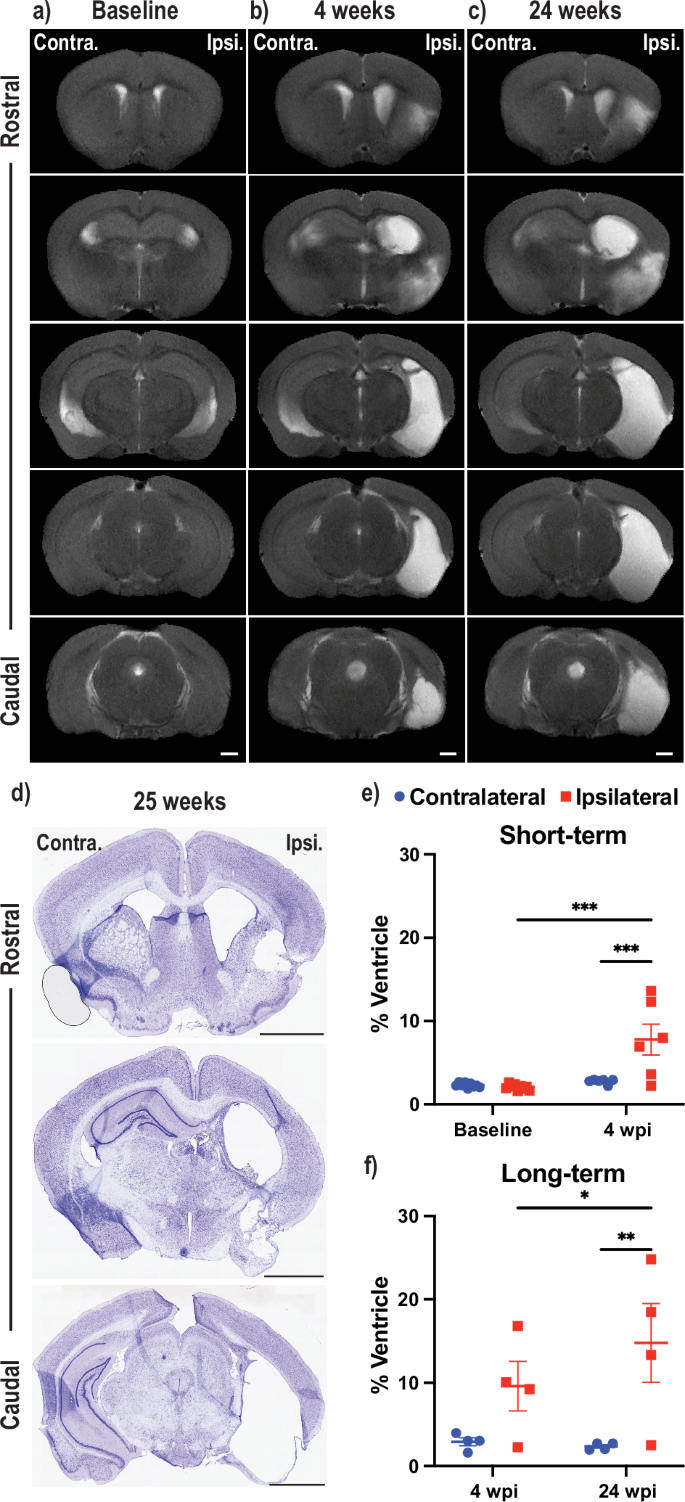
Anatomical MRIs of representative Acomys brains at baseline (a, left column) to assess the uninjured brain followed by scans at 4 weeks post injury (wpi) (b, middle) and 24 wpi (c, right, scale bars = 1 mm). d Cresyl violet staining of the animal (b, c) is shown one week after its final MRI. Scale bars = 2 mm. Two longitudinal experiments (baseline to 4 wpi, e), top; 4 wpi to 24 wpi, f), bottom) with volume of the contralateral and ipsilateral ventricle as a % of the total hemisphere volume assessed by MRI. e = mixed-effects model with Tukey correction for multiple comparisons (***p < 0.001). f 2way ANOVA repeated measure with Tukey correction for multiple comparisons (*p < 0.05, **p < 0.01).
Neuroinflammation, glial scarring, and neurogenesis post-stroke responses
In order to further assess the non-regenerative response in the post-stroke spiny mouse brain, we performed various immunohistochemical analyses to investigate how different cell types responded to the insult. Previously, the innate immune system has been implicated in the regenerative ability of Acomys, which exhibit low levels of inflammation after injury41. Therefore, we investigated if microglia/macrophages were responding to the damaged area using an antibody against ionized calcium-binding adaptor molecule 1 (IBA1), a marker for microglia and macrophages. Additionally, to corroborate our MRI findings of failed regeneration, we stained for NeuN, a marker of neuronal nuclei to measure neuronal damage. Representative whole brain images at 2 dpi depict an early neuroinflammatory response in the ipsilateral hemisphere with no significant loss of neural cells (Fig. 3a). Enlarged sections comparing the contralateral and ipsilateral hemispheres highlight these findings (Fig. 3b, c). At 30 dpi, Acomys showed an increase in IBA1-positive cells in the ipsilateral hemisphere in brain regions that were consistently damaged in our injury model (Fig. 3d). Neuroinflammation was prominent in regions that were severely damaged, such as the hippocampus, as well as less affected regions including the striatum/piriform cortex (Fig. 3e, f). Representative images of the uninjured and 175 dpi brains and enlarged images are also provided (Supplementary Fig. 3a–f). Analysis based on NeuN staining shows a decrease in the size of the dentate gyrus (DG) on the ipsilateral compared to the contralateral hemisphere at 30 and 175 dpi. At 30 and 175 dpi timepoints ipsilateral DG size decreased compared to the ipsilateral DG at baseline and 2 dpi animals by roughly 50% on average normalized to the contralateral DG (Fig. 3g). Additionally, analysis of the regions of activated, ameboid, microglia/macrophages revealed an increased neuroinflammatory response on the ipsilateral compared to the contralateral hemispheres at 2, 30, and 175 dpi. There was also an increase in microglia/macrophages in the ipsilateral hemispheres at 2 dpi and 30 dpi compared to the baseline ipsilateral hemisphere as well as a decrease in microglia/macrophages in the ipsilateral hemispheres from 2 dpi to 175 dpi (Fig. 3h). We noted variability in neuroinflammation out to 175 dpi, with two animals maintaining activated microglia/macrophages around damaged areas, striatum and hippocampus, while others had remediation of activated microglia/macrophages (Fig. 3h, Supplementary Fig. 3d–f). As noted previously, two Acomys did not show stroke-induced damage by MRI at 28 dpi (Fig. 2e), but these animals did show a high level of neuroinflammation in the ipsilateral hemisphere in the striatum, amygdala, and hippocampus (Fig. 3h). Interestingly, robust IBA1 expression rarely overlapped with NeuN positivity but did overlap with fractured NeuN positive signal in the hippocampus. However, we also observed increased microglial/macrophage activation around intact neuronal nuclei in the two animals with no gross structural damage as visualized by MRI (Fig. 3d–f, Supplementary Fig. 3d–f). Unfortunately, a reliable immunohistochemical method does not exist to clearly differentiate histologically between activated microglia and macrophages42,43. Therefore, the observed neuroinflammation may contain some macrophages that infiltrated the brain after damage to the blood-brain barrier from the ischemic induction.
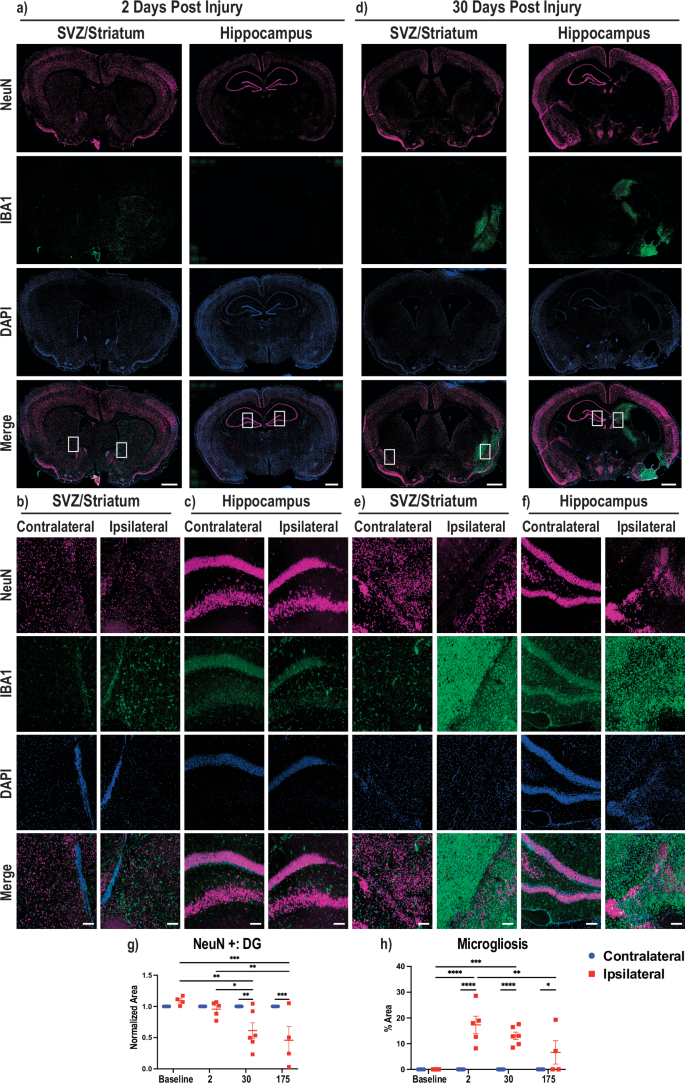
Immunofluorescence was performed on 30 µm thick brain slices. a Brain sections at 2 dpi stained for NeuN (top, magenta), IBA1 (second, green), DNA/DAPI (third, blue), and merged (bottom). Two representative brain regions with the left depicting the SVZ, striatum and cortex and the right hippocampus, midbrain, and cortex. The ipsilateral hemisphere is the right hemisphere and the contralateral is the left, and boxed areas denote regions used for enlargement. Enlarged images of areas of NeuN positive cells and microgliosis are provided showing SVZ/striatum (b) and hippocampus (c) at 2 dpi. d Same description as (a), except for 30 dpi. Enlarged images of areas with NeuN loss and microgliosis are provided showing striatum/piriform cortex (e) and hippocampus (f). g Quantification of the dentate gyrus of the hippocampus measured by NeuN-positive cells with each data normalized to the contralateral dentate gyrus in the same animal. h Quantification of the area of amoeboid microglia/macrophage activation as a percentage of the area of the brain hemisphere. All quantification shown at four timepoints from uninjured (baseline) to 2, 30, and 175 dpi where blue circles denote the contralateral hemisphere and red squares denote the ipsilateral hemisphere. Whole brain scale bars = 1 mm, Zoom scale bars = 100 µm. 2way ANOVA performed with Tukey correction for multiple comparisons (*p < 0.05; **p < 0.01; ***p < 0.001; ****p < 0.0001).
Since the brain failed to regenerate in Acomys, we performed immunohistochemistry on multiple brain slices following stroke induction to determine if glial scarring was present with the failed regenerative response. Specifically, we stained for neural stem cells/neural progenitor cells (NSC/NPCs), neuroblasts, and astrocytes using antibodies against SRY-box transcription factor 2 (SOX2), doublecortin (DCX), and glial fibrillary acidic protein (GFAP), respectively. Representative whole brain images at 2 dpi showed no noticeable changes to NSC/NPCs, astrocytes, or neuroblasts between the contralateral and ipsilateral hemispheres (Fig. 4a). Enlarged images of the ipsilateral and contralateral SVZ and DG from the whole brain images are provided (Fig. 4b, c). At 175 dpi, Acomys appeared to have increased ipsilateral SOX2 and DCX staining, indicating increased NSC/NPCs and neuroblasts in both the subventricular zone (SVZ) and the hippocampus with robust astrocyte staining on the ipsilateral side forming a glial scar around the damaged area (Fig. 4d). Enlarged images further confirmed ipsilateral increases in SOX2, DCX, and GFAP in both the SVZ and DG of the hippocampus (Fig. 4e, f). Representative images of the brains in uninjured and 30 dpi animals, together with enlarged images highlighting the SVZ and DG of the hippocampus, were also obtained (Supplementary Fig. 4a–f). Analysis of the area of astrogliosis, or activated astrocytes to represent glial scarring, was performed as a percentage of the total hemisphere area. This analysis showed an increase in the astrogliosis area in the ipsilateral compared to the contralateral hemisphere at 30 and 175 dpi. Additionally, we noted an increase in astrogliosis in the ipsilateral hemisphere at 30 and 175 dpi compared to the ipsilateral baseline and 2 dpi animals (Fig. 4g). NSC/NPC cells were quantified in the DG by co-positive GFAP/SOX2 expression, and we observed an increased average of NSC/NPCs in the ipsilateral DG compared to the contralateral DG at 30 and 175 dpi. Moreover, the ipsilateral NSC/NPC average number increased at 30 dpi in the DG compared to the baseline, and there was also an increase in the 175 dpi DG compared to all other ipsilateral DG time points (Fig. 4h). In the SVZ, changes in NSC/NPC area only increased in the 175 dpi ipsilateral SVZ compared to the contralateral SVZ as well as the ipsilateral SVZ of all other timepoints (Supplementary Fig. 4g). In summary, NSC/NPCs were increased in the DG at 30 dpi and both the DG and SVZ at 175 dpi. While not quantified, we also observed that there were NSC/NPCs present in the peri-lesion area in the ipsilateral hemisphere in both the striatum and hippocampus at 30 dpi and 175 dpi. Neurogenesis was evaluated by neuroblast number in the DG and there was an increase in ipsilateral neuroblast number compared to the contralateral hemisphere at 30 and 175 dpi (Fig. 4i). These same changes were found in neurogenesis in the ipsilateral SVZ at 30 and 175 dpi (Supplementary Fig. 4h). Additionally, these results were also observed in the animals that did not show damage via MRI at 28 dpi (Fig. 4g–i, Supplementary Fig. 4g, h). We also determined that the neuroblasts at 30 and 175 dpi migrated to the glial scar, which has been reported previously in other rodent models of tMCAO stroke10,11,44,45 (Fig. 4d–f, Supplemental Fig. 4d–f). In summary, our immunofluorescence studies demonstrated failed regeneration in these animals characterized by a robust neuroinflammatory and glial scar response together with attempted regeneration at 30 and 175 dpi. Details on antibodies used are provided in Supplementary Table 3.
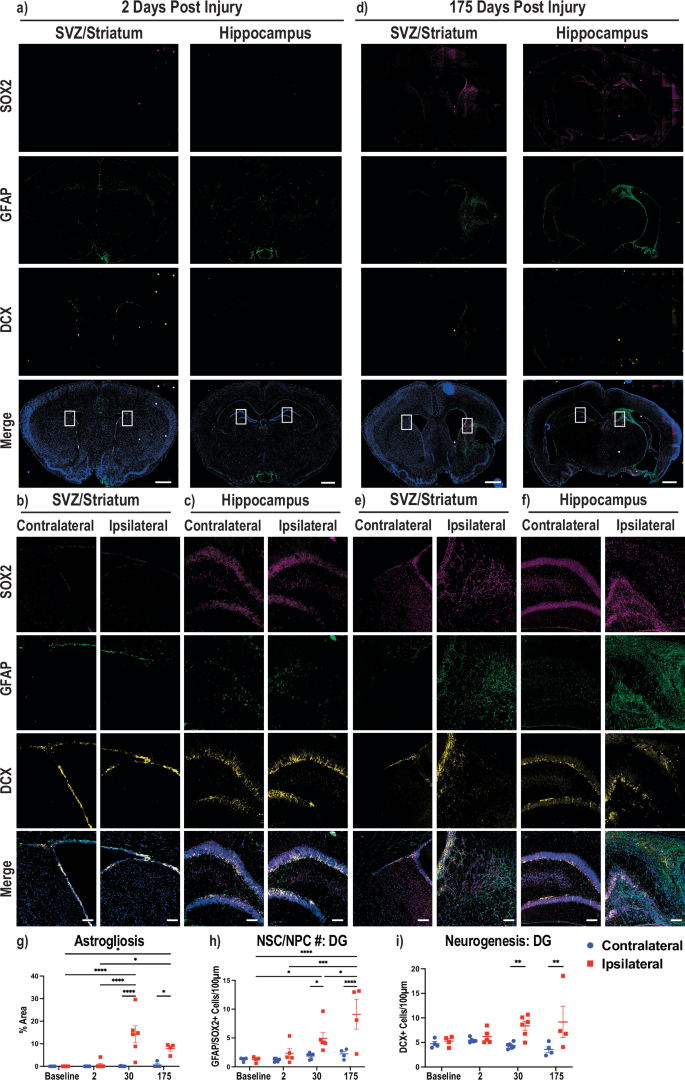
Immunofluorescence was performed on 30 µm thick brain slices. a Brain sections at 2 dpi stained for SOX2 (top, magenta), GFAP (second, green), DCX (third, yellow), and merged with DAPI in blue (bottom). Two representative brain regions with the left depicting the SVZ, striatum and cortex and the right hippocampus, midbrain, and cortex. The ipsilateral hemisphere is the right hemisphere and the contralateral is the left, and boxed areas denote regions used for enlargement. Enlarged images of areas of glial scarring and neurogenesis are provided showing SVZ/striatum (b) and hippocampus (c) at 2 dpi. d Same description as (a), except for 175 dpi. Enlarged images of areas with glial scarring and neurogenesis are provided showing SVZ/striatum (e) and hippocampus (f). g Quantification of the area of activated astrocytes (astrogliosis) as a percentage of the area of the brain hemisphere. h Quantification of the number of GFAP/SOX2 co-positive cells per 100 µM of the dentate gyrus. i Quantification of the number of DCX positive stains per 100 µM of the dentate gyrus. All quantification shown at four timepoints from uninjured (baseline) to 2, 30, and 175 dpi where blue circles denote the contralateral hemisphere and red squares denote the ipsilateral hemisphere. Whole brain scale bars = 1 mm, Zoom scale bars = 100 µm. 2way ANOVA performed with Tukey correction for multiple comparisons (*p < 0.05; **p < 0.01; ***p < 0.001; ****p < 0.0001).
Rapid post-stroke behavioral recovery
Reports of functional recovery in Acomys following spinal cord injury (SCI) and the rapid remediation of ND scores from 1 to 0 by 24 h post injury led us to investigate multiple metrics for behavioral recovery. Few behavioral paradigms are optimized for Acomys, so we utilized home-cage behavior and open field tests46,47,48. We attempted to perform the corner test as well, but this test was not informative as Acomys learned to escape the testing apparatus either by burrowing out the side or climbing to the top both before and after stroke. Instead, we analyzed multiple open field metrics that showed quick remediation of circling except for one animal as measured by % turning clockwise, and we did not observe statistically significant differences in average speed, total distance traveled, or time in center even at 2 days post injury (Fig. 5a). Since we could not observe detriments in Acomys at 2 dpi via open field, we analyzed them in their home-cage at time points closer to the injury and representative movies are available. Supplementary Movie 2 shows two animals the night before tMCAO stroke surgery (baseline) interacting with each other and includes a chasing event. In comparison, Supplementary Movie 3 shows the same two animals on the night of the stroke injury (0 dpi) with less overall movement. Supplementary Movie 4 shows the same animals the following night (1 dpi) with both animals moving and interacting with each other more frequently where we observe a striking behavioral recovery within 48 h post-surgery. An example of the Acomys home-cage with lines depicting the separate regions of the cage (Supplementary Fig. 5a) and our specific ethogram for this study (Supplementary Table 4) are provided. Home-cage behavioral analysis reinforced the ND observation that Acomys have early detriments shortly after injury but recover rapidly to an unaffected state. We observed an increase in time spent circling at night and day with remediation of these impairments within the first week (Fig. 5b). At night, we noted a detriment in movement at 0 dpi that is quickly remediated by 1 dpi and maintained out to the first week. Additionally at night, we observed a detriment in climbing at 0 dpi that was not observed at later timepoints (Fig. 5b). In these studies, the animal depicted by the red circle died between days 4 and 6, so there is no data on day 6. Additionally, there was no data for the animals depicted by brown and orange on day 4 because they were not recorded. These same two animals tended to be more active than the others at baseline because they were initially pair-housed, but both of these animals lost their cage mate to death in the days after surgery. There was a significant decrease in drinking from baseline to 6 dpi at night and no change during the day (Supplementary Fig. 5b). We did not observe significant changes in the number of rearing events throughout these time points at night or day (Supplementary Fig. 5c). During the daytime, we did not detect any detriments except circling, presumably because the animals are primarily sleeping during this time (Supplementary Fig. 5d, e). Cumulatively, these results indicated an earlier post-stroke impairment that quickly remediates by 48 h.
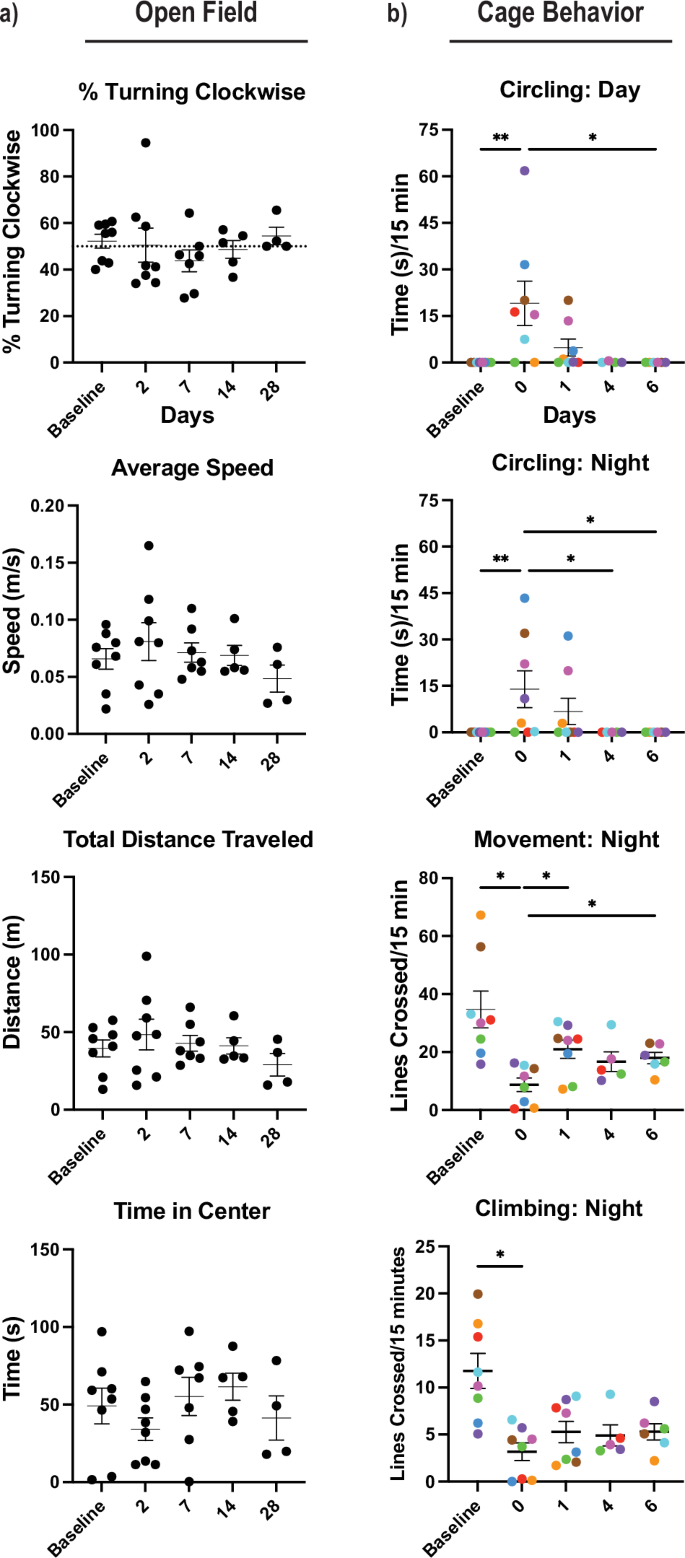
a Open field tests included % turning clockwise, average speed (m/s = meters/second), total distance traveled (m = meters), and time in center (s = seconds). b Cage behavior was recorded at baseline and 0–6 days post-injury animals during the dark and light cycle, including metrics for movement, climbing, and circling. Circling is recorded in time (s = seconds), movement is recorded as the number of lines crossed in the cage, and climbing with number of lines crossed ascending and descending in the cage. Cage behavior was represented as the average of actions in 15-min recordings (min = minutes). Circling = Kruskal-Wallis nonparametric test performed (*p < 0.05, **p < 0.01). All other behavior = mixed-effects model with Tukey correction for multiple comparisons (*p < 0.05, **p < 0.01).
Generation of an MRI brain atlas for Acomys cahirinus
Because brain tissue regeneration failed to account for the observed post-stroke behavioral recovery, we investigated the possibility that redistribution of neural activity from the contralateral hemisphere compensated for the injury and contributed to the rapid behavioral response. To address this possibility, we first developed an MRI-based neuroanatomical atlas for Acomys. High-resolution ex vivo MRI scans of eight Acomys were performed and combined to generate a representative Acomys brain depicted as sagittal sections from the temporal cortex to the midline (Fig. 6a), horizontally from dorsal to ventral (Fig. 6b), and coronally from rostral to caudal (Fig. 6c). After generating this representative brain atlas, we utilized previously published resources including the Acomys histological brain atlas49, the Allen Mus brain atlas50, and the Mus MRI brain atlas51 as reference guides for the generation of our atlas. Our MRI Acomys brain atlas was overlaid on a representative brain scan which is shown coronally from the olfactory bulbs to the cerebellum/brainstem (Fig. 6d). Additionally, a three-dimensional shell was generated from our base scans for use in rsfMRI analysis (Supplementary Fig. 6a, b). A list of all brain regions mapped is included in Supplementary Table 5.
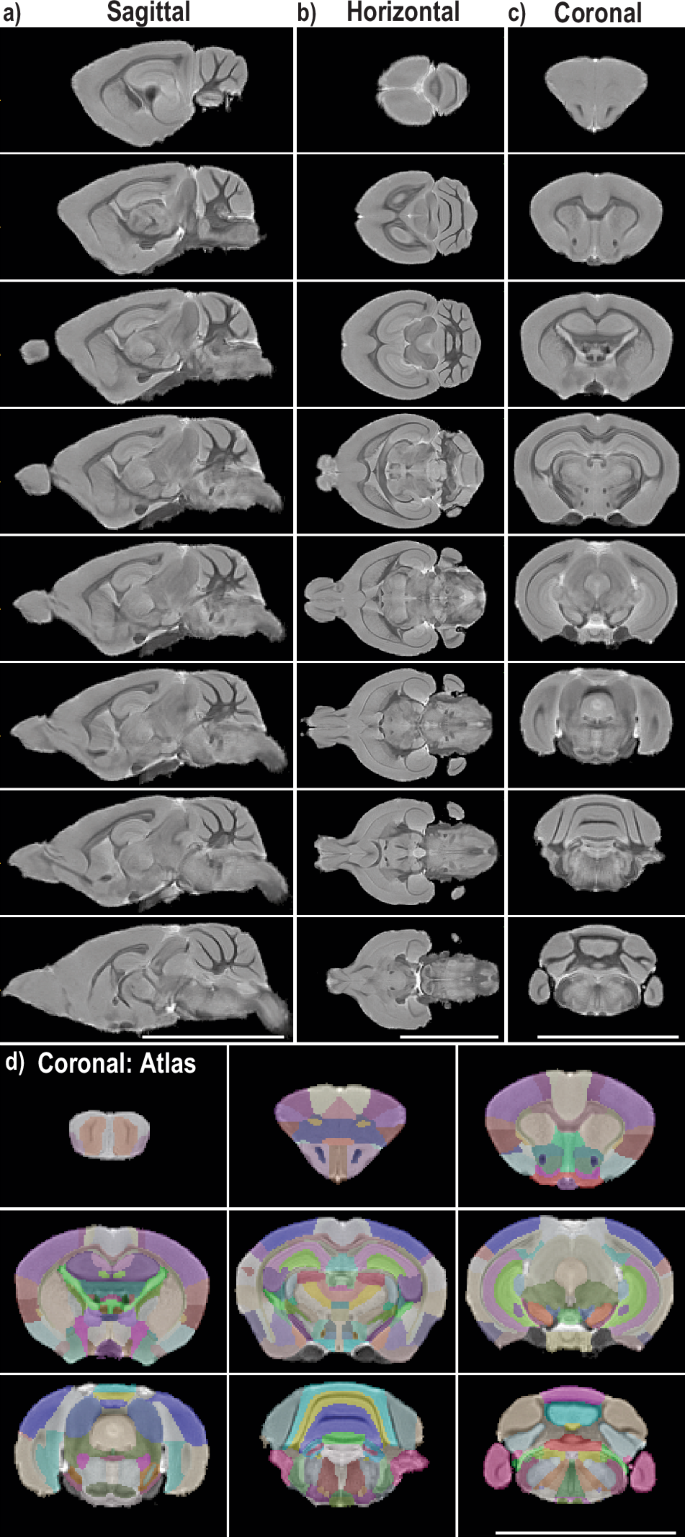
High-resolution ex vivo MRI scans were performed on multiple animals (n = 8) and combined to generate a three-dimensional Acomys brain. a Representative images of sagittal slices are depicted from the exterior of the brain to the midline. b Representative images of horizontal slices from the top to the base of the brain. c Representative images of coronal slices from the frontal cortex to the cerebellum/brainstem. d The atlas was overlaid with 30% opacity on top of the above coronal slices with one additional slice of the olfactory bulbs.
Rewiring of the brain after injury
To investigate the potential for neuroplasticity in Acomys following an ischemic stroke, multiple rsfMRI scans were performed prior to and following the tMCAO-induced stroke injury. Connectome analysis, in combination with our MRI atlas, was used to assess post-stroke global topological changes. Since proper mapping of brains with post-stroke pseudocysts to atlases can be difficult, we validated that our atlas was at a high enough resolution to have brains accurately map to our atlas (Supplementary Fig. 7a). Representative images of the average connectomes of the Acomys at baseline and 4 wpi are shown, where 80 nodes (40 per hemisphere) throughout the brain were analyzed (Fig. 7a). A redistribution of connections (lines) and node strength (spheres) is seen at 4 wpi with various changes in both the contralateral and ipsilateral hemispheres (Fig. 7a). The average global network metrics were quantified by analyzing the area under the curve of various functional assessments, and no changes were seen in global network metrics at 4 wpi compared to baseline assessing network efficiency, characteristic path length, strength, clustering coefficient, transitivity, assortativity, Louvian modularity, and the small world index, although we do note a trend towards increased small world index at 4 wpi (Fig. 7b, Supplementary Fig. 7b). The original curves are provided (Supplementary Fig. 7c), and while we detected some significant differences early on in % edge density, this effect is lost as the % edge density increases and the analysis becomes more stringent, except for the lambda analysis, where a significant effect was seen overall between baseline and 4 weeks. In order to better understand how it is possible for the Acomys brain to experience minimal global changes to the network after a stroke, we analyzed the participation coefficients (pc) of individual regions of both hemispheres. The participation coefficient is a measure of how much a node interacts with other nodes outside the immediate network. At the whole hemisphere level, there is an increase in the pc of the contralateral hemisphere with no change in the ipsilateral hemisphere (Fig. 7c). As anticipated, we observed a decrease in the ipsilateral hippocampus node 3 pc, presumably from the injury, and a concordant increase in the adjacent node on the contralateral hemisphere (Fig. 7d). Interestingly, there was not an increase in the contralateral striatum pc even though there was a decrease on the ipsilateral side (Fig. 7e). This led us to investigate nearby regions that were uninjured to see if compensation was occurring in different regions. Interestingly, there was an increase in the pc of the contralateral substantia nigra with no change in the ipsilateral (Fig. 7f). Details on node locations are provided in Supplementary Table 6.
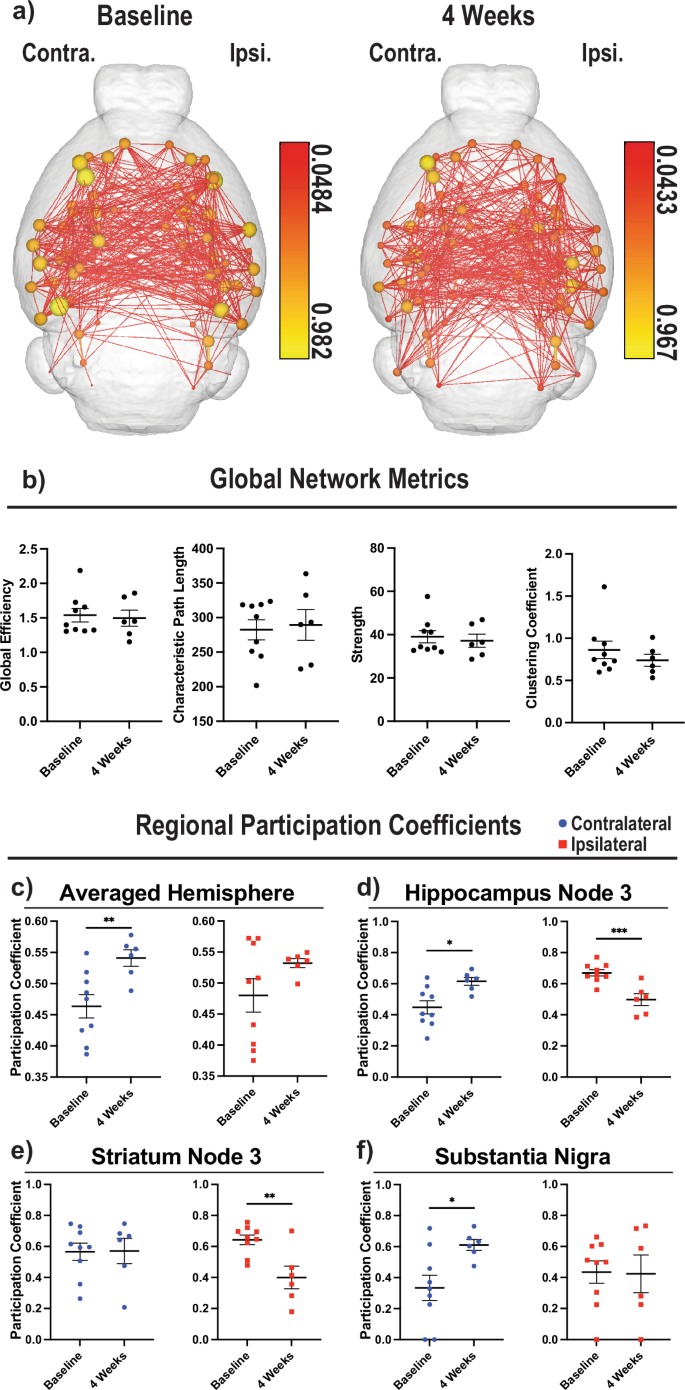
a Average connectome images from 80 nodes for baseline (left, n = 9) and 4 wpi (middle, n = 6). Reference bars for nodes for each time point are given (right of each image). The contralateral hemisphere is the left side of the brain and the ipsilateral hemisphere is the right. b Four representative global connectome analysis are provided including global efficiency, characteristic path length, strength, and clustering coefficient, respectively from left to right. c The participation coefficients from all 40 nodes in each hemisphere were averaged and then compared between baseline and 4 wpi. d The participation coefficients of the third node in the hippocampus are depicted comparing between baseline and 4 wpi. e Same as (d) but looking at the third node of the striatum. f Same as (d), but looking at the substantia nigra. c–f Blue circles denote contralateral hemisphere and red squares denote ipsilateral hemisphere. Unpaired t-test used for analysis (*p < 0.05; **p < 0.01; ***p < 0.001).
Based on these findings, we investigated whether there were any regions that were dynamically altered at 4 wpi to identify any primary hubs of neuroplasticity. We observed changes in both the ipsilateral and contralateral hemispheres in multiple regions assessing participation coefficient, node strength, node degree score, node between centrality, within module z degree score, node Eigenvector centrality, and clustering coefficient (Supplementary Fig. 8a–g). Interestingly, six regions were the most consistently altered across multiple metrics. The contralateral posterior thalamic area had an increase in node strength, node degree score, participation coefficient, and node between centrality (a measurement of the likelihood of the node being a hub) (Fig. 8a). The substantia nigra had additional changes in node strength, node degree score, node Eigenvector centrality (an additional measurement of the likelihood of the node being a hub), and node between centrality (Fig. 8b). Interestingly, the medial amygdaloid area had changes both contralaterally in node strength, node degree score, and node Eigenvector centrality as well as ipsilaterally in the participation coefficient and within module z degree score (Fig. 8c, Supplementary Fig. 8e). Surprisingly, we detected alterations in the flocculus of the cerebellum both contralaterally and ipsilaterally in node strength, node degree score, node Eigenvector centrality, participation coefficient (contralaterally), and node between centrality (ipsilaterally) suggesting a role for cerebellar compensation (Fig. 8d). Ipsilaterally, we observed consistent increases in the caudal insula in the within module z degree score, node degree score, node Eigenvector centrality, and a trend in node between centrality (Fig. 8e). Finally, we also observed consistent changes in the contralateral medial geniculate in participation coefficient, node strength, and node degree score (Supplementary Fig. 8a–c). Analysis of the opposite hemispheres for the metrics in the main figure are provided (Supplementary Fig. 8h–m). In summary, many brain regions showed altered activity and connections in response to the stroke injury at 4 wpi with a preference towards contralateral alterations with notable ipsilateral regions changing as well.
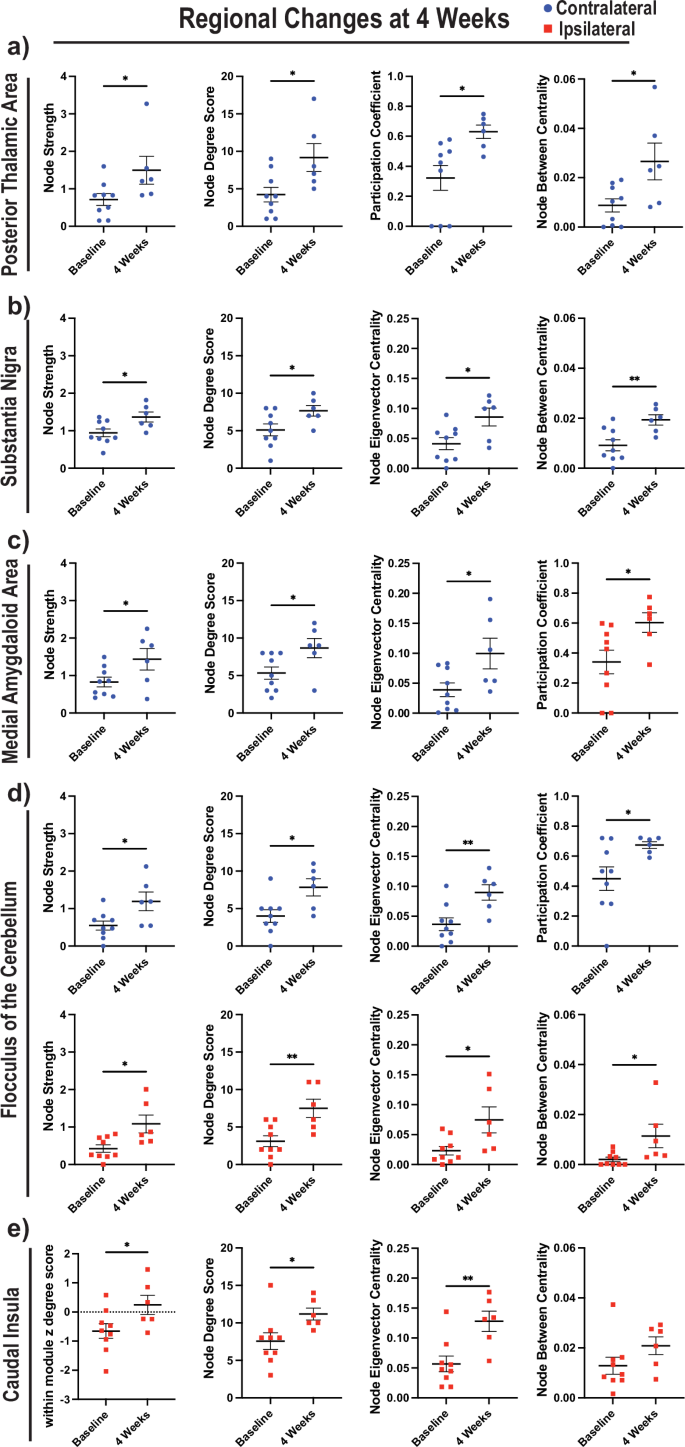
Blue circles denote the contralateral hemisphere and red squares denote the ipsilateral hemisphere. a Four parameters comparing baseline to 4 wpi are given for the posterior thalamic area, including node strength, node degree score, participation coefficient, and node between centrality. b The same as (a), except assessing the substantia nigra and replacing participation coefficient with node Eigenvector centrality. c The same as (b), except assessing the medial amygdaloid area and replacing node between centrality with participation coefficient. d The same as (b), except assessing the flocculus and replacing node between centrality with participation coefficient in the contralateral hemisphere. e The same as (b), except assessing the caudal insula and replacing node strength with within module z degree score. Unpaired t-test used for analysis (*p < 0.05; **p < 0.01).
Discussion
Prior to this study, a stroke injury had not been performed in Acomys to test the possibility that this highly regenerative mammalian model might show an enhanced regenerative response to this severe CNS injury. Here we report that either permanent or transient ischemic stroke protocols are effective in injuring the Acomys brain. However, Acomys show no evidence of regeneration in the damaged area even at ~6 months post-tMCAO stroke injury but instead trend towards more disseminated damage with time, which is consistent with what is seen in patients and other rodent models17,52. This is in stark contrast to the observed spinal cord regeneration in Acomys which showed minimal glial scarring, minimal neuroinflammation, efficient axon regeneration and neuroblast migration into the damaged site28,29. Notably, we see rapid functional recovery which is in accordance with the spinal cord injury studies, where they reported rapid bladder control after injury28,29. Additionally, this functional recovery with scarring has similarities with what has been reported after heart injury where there was initially impaired functionality with a rebound of improved ejection fraction, vascularization, less scarring, and improved preservation of tissue30,31,32.
A limitation of this study is that Acomys cannot be directly compared to other rodent models, such as Mus, due to variability of the cerebral vasculature between species33, leading to differences in infarct size and location across species. Interestingly, we observed three distinct damage levels in our studies that could reflect the three types of circle of Willis architecture33. An informative extension of these studies would be to evaluate another type of injury with more control over damage size, such as traumatic brain injury (TBI), to assess the regenerative, neuroprotective, and/or neuroplasticity characteristics of Acomys. Additionally, the pdMCAO model showed less damage at 48 h post injury. Future studies should evaluate the functional recovery and regenerative response in spiny mice post pdMCAO injury. Another limitation of these studies is that isoflurane has effects on neurovascular coupling, which can decouple neuronal and blood flow responses. This can have an overall effect of reducing the fMRI signal. However, these effects of isoflurane are observed at higher concentrations (~2.0%) than used in this study53,54. Unfortunately, it is very difficult to have large animal numbers for spiny mice due to low breeding and the available animals for the atlas were primarily female. Despite this difference, we confirmed that the male brains still mapped accurately to the atlas despite this difference (Supplemental Fig. 7a). An additional limitation is the difficulty of lesions to map properly to MRI brain atlases, even though we see efficient large-scale mapping in our study. To account for this, quantification of lesion sizes was done manually and not through the atlas to account for possible small-scale inaccuracies, and the atlas was only used as a guide for locating large regions of interest. We performed four different types of analysis to quantify atrophy/infarct size (Fig. 2e, f; Supplemental Fig. 2b–d) including % Ventricle, estimated infarct, brain size, and % healthy brain. While these quantification analyses agree with each other, we feel that % Ventricle most accurately reflects the change in pseudocyst size over time.
To better understand why the Acomys brain was unable to regenerate stroke-induced CNS damage, we first tested whether the tMCAO stroke procedure blocked the generation of new neurons. Histological and MRI assays showed that the tMCAO stroke damaged area included both the SVZ and hippocampus, both neurogenic niches in the adult rodent55. The SVZ is of particular interest because Acomys have significantly more neural progenitor cells compared to Mus, which could be involved in potential neural regeneration56. Expectedly, increased numbers of NSC/NPCs and neuroblasts were detected in these regions at 30 dpi and 175 dpi, indicating that a regenerative attempt occurred following stroke injury but failed. Acomys are unique among adult mammals for having scar-free regeneration in the spinal cord28,29, similar to axolotl, lamprey, zebrafish, and Xenopus, which all lack the formation of a glial scar upon injury57,58,59,60. Thus, we tested if post-stroke scarring occurred and found that prominent astroglial scarring surrounding the damaged tissue was present at 30 dpi and persisted out to 175 days. This response likely contributed to the failed regeneration we observed since glial scars have been shown to inhibit axon regeneration in other rodents61,62,63,64. Additionally, we noted robust microglial/macrophage activation at the injury site suggesting that microglia/macrophages were primarily involved in clearing the damaged tissue. Interestingly, some regions that did not show damage via MRI also showed neuroinflammation, indicating that these microglia/macrophages may have preserved tissue that experienced a less severe ischemic insult. As dampened immunological responses have been previously implicated in Acomys tissue regeneration41, it is possible this robust inflammatory response in the brain is contributing to failed regeneration. Our analysis is in line with other published data in rodent models showing post-stroke neuroinflammation, glial scarring, neural loss, and neurogenesis responses7,8,9,10,11. While our results demonstrate that the Acomys brain did not regenerate following a severe transient ischemic and reperfusion injury, regeneration may be observed following a less severe permanent occlusion injury.
The ability to compare tissue regions where regeneration is successful versus where it fails should inform future studies designed to reveal the underlying mechanisms that allow adult Acomys to regenerate specific neural tissues. Indeed, further studies focused on the characteristics of astrocytes and microglia in the failed regenerative response reported here compared to successful spinal cord regeneration may elucidate mechanisms underlying glial scarring and failed regeneration. Additionally, the peripheral immune response has been heavily implicated in post-stroke injury and recovery, and future studies investigating the peripheral immune system in Acomys are necessary to elucidate the positive and negative impacts that may be occurring8,65,66,67,68. Specifically, investigating leukocyte levels in the brain both acutely and chronically is a promising avenue of research to better understand the potential interplay between functional recovery and immune cell infiltration in Acomys. However, glial scarring and increased neuroinflammation may not be the only reasons for failed regeneration. It has been proposed that regenerating the brain requires a complex series of events including, but not limited to, vascular rewiring of the damaged area, reactivation of neurodevelopmental cues, and a proper balance between neurorestorative and apoptosis factors69,70,71. Further studies investigating the differences between the spinal cord injury and stroke lesion may provide more details on the factors involved in the Acomys spinal cord pro-regenerative microenvironment.
In striking contrast to the failed post-stroke tissue regenerative response, we observed a remarkable degree of behavioral recovery using multiple behavioral paradigms, which is in agreement with previously reported spinal cord injuries28,29, and our results suggested that neuroplasticity might facilitate this rapid functional recovery. Interestingly, this is in contrast to open field and other behavioral paradigms in mice where there is a significant decrease in movement from baseline to 48 hr. However, heterogeneity in cerebral vasculature between species, leading to different injury location and size, in addition to procedural differences in filament size, occlusion time, and neurological deficit parameters make direct comparisons impractical12,13,14. To assess the possibility of neuroplasticity, we performed rsfMRI, which required the development of an MRI-based brain atlas for Acomys cahirinus. The rsfMRI on Acomys at various time points revealed striking compensatory responses throughout the brain to the extent that there was no statistical difference between global network metrics. Interestingly, both patients and common rodent models see a decrease in these metrics post-stroke suggesting that Acomys is uniquely able to recover connectome functionality; however, future studies are necessary to clarify this18. While there was a preference for contralateral changes in network metrics, we also detected multiple ipsilateral brain regions increasing their connections and activity in response to stroke. Other rodent studies have conflicting fMRI data on contralateral and ipsilateral compensatory roles presumably due to differences in anesthetics, timing, fMRI protocol and surgical procedure72,73,74,75. Indeed, the size and location of the stroke lesions have been associated with differential patterning of the connectome in rats76. This makes comparisons between studies and species challenging; however, improved interhemispheric connections in the chronic phase after stroke have been associated with improved functional connectivity77,78. In our study, regions that were the most dynamically altered included the contralateral posterior thalamic area, medial geniculate, substantia nigra, medial amygdaloid area, flocculus, and the ipsilateral insula, medial amygdaloid area, and flocculus. These brain regions had increased strength and likelihood of becoming hubs suggesting that they are transitioning to novel functional hubs in response to the stroke injury. Interestingly, this could explain how there was no detriment to global neural networks as various regions throughout the brain appear to be compensating for the loss of tissue. We propose the neuroplasticity observed post-stroke is playing a role in the rapid behavioral recovery of Acomys, and further investigation into these brain areas post stroke may elucidate novel pathways underlying neuroplasticity. While the mechanisms underlying these alterations in the connectome remain unknown, multiple hypotheses might explain this result. One possibility is that new axons or synapses are developing after injury to elicit these connectome alterations, but this is unlikely due to the speed at which we recorded functional recovery. Alternatively, there may have been connections that existed prior to injury that were strengthened following injury. This hypothesis is consistent with the recovery timeline, and our rsfMRI results provide target brain regions to investigate mechanisms underlying this neuroplasticity. Future studies investigating changes in synaptic densities and fiber density histologically in the new neural hubs of activity may help characterize and elucidate mechanisms underlying this neuroplasticity. Furthermore, studies utilizing brain slice cultures in combination with electrophysiology in acute stroke and sham Acomys with more behavioral paradigms may help to further characterize the mechanisms underlying this neuroplasticity.
Although there have been studies into neural network changes post-stroke in humans and a few studies in rodents, the mechanisms contributing to these changes are poorly understood. Human recovery post-stroke is incredibly variable depending on the size and location of the lesion. Some studies have used fMRI or positron emission tomography (PET) to monitor brain connections during motor recovery, which typically occurs 3–6 months post-injury37,38,39,75,79,80,81,82,83,84,85. From these studies, it has been proposed that there is a two-phase connectome recovery starting with the recruitment of existing neural networks via disinhibition of the contralateral hemisphere, followed by focusing of connections as relearning occurs80,82,86,87,88. Improved motor outcomes in patients have been associated with the transition of the connectome to a more focused state86,87. While there appears to be a shift towards increased activity of contralateral connections early on in human patients, this is altered to include ipsilateral changes and bilateral cerebellar activation over time during the focused phase37,38,39. The connectome studies of traditional laboratory rodents, Mus and Rattus, are few with variability due to differences in stroke models and anesthetic procedures across studies75. The magnitude of changes in rodents is less than what is observed in humans and the role of cerebellar compensation is unclear75. In our Acomys studies, we detected bilateral compensation at 4 wpi, suggesting that they have entered the focusing phase of neuroplasticity. Interestingly, compensation occurs in the cerebellum, which is consistent with patient compensation. Additionally, we do not see any global changes to the connectome after stroke, which is different from both patients and Mus18, and suggests an improved method of compensation in Acomys. This combination of neuroplasticity recovery and patterning provides a foundation to understand the potential for enhanced neuroplasticity in Acomys with the increased likelihood that it will translate to humans. Further studies into this neuroplasticity response in both the Acomys brain and possibly in the spinal cord could ultimately lead to therapeutic benefits for patients with severe CNS injuries.
Methods
Animals
Male Acomys were used from a colony established by Dr. Malcolm Maden at the University of Florida. Throughout the experiments, the Acomys were kept in a temperature and humidity-controlled room on a 14-h light and 10-h dark cycle with ad libitum feeding and weekly mealworm food supplementation. Procedures performed on animals were approved by the University of Florida Animal Care and Use Committee (Protocol #202110361 and #202107707) and in accordance with the NIH Guide for the Care and Use of Laboratory Animals as well as the United States Department of Agricultural standards of Laboratory Animal Use. Euthanasia was performed following isoflurane anesthesia via inhalation prior to cardiac puncture and perfusion with phosphate-buffered saline (PBS) followed by perfusion with 4% paraformaldehyde (PFA) in PBS. Animals were initially anesthetized at 2% isoflurane until unresponsive to a toe pinch with steady respiration, and then transitioned to 1–1.5% isoflurane during the procedure while ensuring good respiration and no response to a toe pinch. This euthanasia method was chosen for optimal brain structural and cellular preservation.
Induction of transient focal ischemia
Male Acomys aged six to eight months were subjected to a 1 h transient focal cerebral ischemia via intraluminal occlusion of the right middle cerebral artery (MCAO), as has been reported previously in Mus13,14,89. In short, animal temperatures were maintained at 37 °C using a heating pad. Acomys were initially anesthetized at 3% isoflurane in medical grade oxygen and maintained at 1.5–2% isoflurane during the procedure. A midline vertical incision in the neck was made to expose the right common carotid artery (CCA), external carotid artery (ECA) and the internal carotid artery (ICA). A Doccol Corporation silicone rubber-coated monofilament was used for occlusion (Cat #602256) with a filament size of 6–0, diameter of 0.22 ± 0.02 mm, and length of 5–6 mm with a total length of 20 mm. The filament was advanced slowly into the ICA (about 9–10 mm from the carotid bifurcation) until mild resistance was felt. At this point cerebral blood flow (CBF) was recorded through the skull and measured for reduction via laser Doppler flowmetry. CBF response to occlusion was highly variable between Acomys (Supplementary Fig. 1a), and thus animals were determined to have a successful occlusion if post-operation circling behavior toward the contralateral side occurred, and the brains were later assessed histologically via cresyl violet stain to confirm that a stroke had occurred. The animals were then removed from anesthesia and recovered in a temperature-controlled chamber during the occlusion period. Following 1 h of occlusion, the filament was gently removed to allow for reperfusion. The incision was closed, and the animal was allowed to recover as stated above. Animals were given three doses of a local anesthetic, either ropivacaine or bupivacaine (1 mg/kg each), during the procedure. One dose was delivered to the head before the incision and one to the neck prior to the incision. The final dose was delivered to the neck after the incision was closed and before anesthesia ended. Animals receiving a sham surgery experienced the entirety of the tMCAO protocol, except after exposure of the CCA, ECA, and ICA, no silicone probe was inserted. Additionally, no probe was removed after the 1 h occlusion time.
Induction of permanent distal middle cerebral artery occlusion
Male Acomys were also subjected to permanent distal middle cerebral artery occlusion (pdMCAO) using electrocautery of the M1 segment of the MCA. Anesthesia, anesthetics, and recovery are the same as the tMCAO surgery. Artificial tear ointment was applied to the eyes of each mouse for protection and lubrication. A skin incision was made between the eye and the left ear under a stereomicroscope. The temporal muscle was retracted to locate the left MCA via skull transparency. A small round craniotomy (~1–1.5 mm in diameter) was carefully performed between the zygomatic arch and the squamosal bone to expose the MCA using a surgical drill burr (Cat. No. 726066) connected to a battery-operated Ideal Micro-Drill (Cat. No. 726065; Cellpoint Scientific, Gaithersburg, MA). Finally, two to three drops of sterile saline were applied to the target area, and the meninges covering the MCA were carefully removed with fine forceps. Before the bifurcation between the frontal and parietal MCA branches, the MCA distal trunk was occluded permanently by electrocauterization using an electrosurgical unit (Bovie Medical Corp., Clearwater, FL, USA). A clear interruption of blood flow was visually confirmed. The occlusion was checked again after 30 s, and if necessary the coagulation was repeated. After surgery, animals were allowed to recover in a temperature-controlled chamber.
Post-operative monitoring
Animals were monitored for at least 15 min each day for the first 14 days after surgery and once weekly afterwards until their experimental endpoint. During this time, animals were weighed, evaluated for any overt health concerns, and assessed on a neurological deficits (ND) scale. This scale is provided (Supplementary Table 1). For health concerns that reached an ND of 2, a veterinarian was consulted on whether to treat the animal, and an ND of 3 or higher constituted a humane endpoint requiring euthanasia. Treatments included giving impaired animals moist chow or a gel diet to assist with eating.
Magnetic Resonance Imaging (MRI)
In vivo MRIs were on an 11.1 T/40 cm Bruker Avance III HD (Magnex Scientific Ltd., Oxford, UK) magnet at the University of Florida Advanced Magnetic Resonance Imaging and Spectroscopy (AMRIS) Facility. The scanner has a Resonance Research Inc. gradient set (RRI-BFG-240/120-S6, maximum gradient strength of 1000 mT/m at 300 Amps and a 200 μs risetime RRI, Billerica, MA). The magnet was controlled by a Bruker ParaVision 6.0.1 console. Animals were anesthetized using isoflurane in pressurized air and maintained at a stable airflow rate and anesthesia level per animal (concentration ranged from 0.5 to 1.5% across mice). Acomys were scanned using a 1 h in-house custom-built linear radiofrequency coil in transceiver mode and scans were converted to NIFTI format and initially analyzed in ITK-SNAP90. Details on MRI scans performed are provided (Supplementary Table 2).
Structural analysis: To assess anatomical changes in Acomys, a T2 weighted TurboRARE scan was performed. Analysis was done in ITK-SNAP by generating segmentations of the entire brain, hemispheres of the brain, and the ventricles to assess infarct and ventricle volume. The volumes of these segmentations were recorded from ITK-SNAP by quantifying the area from all recorded MRI brain slices starting at the olfactory bulb and ending at the base of the cerebellum. Inclusion of the entire brain ensures no bias occurs in ventricle or hemisphere size based off of slices chosen for analysis. Percent ventricle was used as the primary measurement of damage across time. Ventricles were used to assess damage since there was removal of the tissue that subsequently filled with CSF. Since the damage was indistinguishable from the original ventricle we used % ventricle as our metric at 28 days and 168 days since infarct size could not be accurately recorded. Representative images were chosen across time/animal based off the surrounding neuroanatomical landmarks to ensure they are comparable as well as the numbered MRI section provided in each scan. All quantification of lesion size was performed manually due to potential small-scale inaccurate mapping of the lesions to our brain atlas. Two of the long-term animals were also scanned at 4 months post injury as a preliminary assessment to check for regeneration by eye. These timepoints were excluded since there were only two points and proper statistics could not be performed.
Resting state fMRI and analysis: To assess the Acomys connectome before and after injury, a rsfMRI scan and processing of the data was performed as previously described91. Animals for rsfMRI were anesthetized at 0.5–1.5% isoflurane at a constant airflow rate in pressurized air and longitudinal animals maintained the same isoflurane percentage in both scans to account for effects on BOLD signal. TOPUP in FSL was used to correct distortions in the SE-EPI scans92. Subsequent EPI volumes were de-warped by using opposite phase encode blip scans to estimate the susceptibility-induced off-resonance field92. Analysis of functional neural images (AFNI)93, FMRIB Software Library (FSL)94,95,96, and Advanced Normalization Tools (ANTs)97,98 were used for in house image pre-processing and analysis. Additionally, Three-Dimensional Pulsed Coupled Neural Networks (PCNN3D)99 and a soft regression approach using fsl_reglift94 were used respectively to generate masks and decrease noise in brain edges, ventricles, and large vessel regions. In order to correct for varying intensities in the T2 images due to RF field homogeneities100, the scans were cropped and N4 bias field correction was applied101. The brain maps were then registered to our novel Acomys cahirinus brain template using FSL linear registration tool (FLIRT)94. Following preprocessing steps, graph theoretical analysis was performed102.
Notable differences in our analysis and image processing compared to the referenced study are that we utilized our Acomys cahirinus brain template as opposed to the mouse brain template and our node number and size. Specifically, we analyzed 80 nodes total (40 per hemisphere) that are 0.75 mm diameter spheres centered on the voxel coordinates and recorded (Supplementary Table 6).
Functional network analysis was performed as reported103. In brief, MATLAB and the Brain Connectivity Toolbox103 were used for setting weighted matrices, and the edge densities were set in a range of 2–40% in order to calculate multiple global network metrics. These metrics include Clustering Coefficient, Characteristic Path Length, Transitivity, Global Efficiency, Louvain Modularity, and the Small World Index where a 16% threshold was utilized for all node-specific measures unless noted in the figures102,103.
3D FLASH imaging for generation of the brain atlas: Acomys (n = 8, 7 female and 1 male) were used in the generation of this brain atlas. Animals were anesthetized with isoflurane and perfused initially with PBS followed by perfusion with 4% PFA in PBS. After perfusion, the head was decapitated and the skin around the skull removed. The brain was left intact in the skull and left in 10% formaldehyde for at least two weeks at 4 °C. The brains were then transferred to 0.5% ProHance (gadoteridol Cat #N020131) in 10% formaldehyde for at least two weeks at 4 °C104. The day before scanning, the skulls were transferred to FC-40 media and left shaking overnight at room temperature. The skulls were then imaged in FC-40 media in a 11.1 T/40 cm Bruker Avance III HD magnet. Two Acomys (1 male, 1 female) previously underwent a muscle injury, and the remaining 6 animals had previously regenerated from an ear wound injury.
Mapping of the brain for the atlas: Masks of the different brain regions were made in ITK-Snap overlaid on our average Acomys brain composite image. This was done by mapping the regions previously used in the Mus MRI brain atlas51, using the Acomys histological brain atlas49 and Allen Mus Brain Atlas as our guides50,105. A list of the different regions is provided (Supplementary Table 5). We noted some inconsistencies between our MRI atlas of the Acomys brain and the histological atlas, particularly in the cerebellum, due to a lack of tissue in the histological brain atlas. In these instances, the Allen Mus Brain Atlas was used as our primary reference.
Immunofluorescence and histological staining
Acomys were perfused first with PBS, followed by 4% PFA in PBS. Perfusions were performed in anesthetized animals by cardiac puncture of the heart. After perfusion, the brains were gently removed from the skull and fixed in 4% PFA overnight at 4 °C. The following day, brains were transferred to 30% sucrose in PBS at 4 °C. After 48 h of soaking in 30% sucrose, the brains were frozen in Optimal Cutting Temperature (OCT) compound by partial submersion in 2-methylbutane chilled by liquid nitrogen. Brains were stored at −80 °C until sectioning in a cryostat at 30 μm per section and then stored on glass slides or in glycerol at −20 °C until further analysis.
Antibodies used in brain sections to assess cell type localization after injury are listed (Supplementary Table 3). Briefly, sections were rehydrated in PBS for 10 min, incubated in 10 mM EDTA (pH 6.5) in a steamer for 30 min and allowed to cool to room temperature for 20 min if previously stored on glass slides, followed by permeabilization with 0.5% Triton X-100 in PBS, followed by blocking with Background Sniper (Biocare Medical) for 1 h, and incubation with the primary antibody in Background Sniper overnight at 4 °C or for 1 h at room temperature. The next day, slices were washed in 0.1% Triton X-100 in PBS for 10 min, incubated with secondary antibody in background sniper for 1 h at room temperature, washed in 0.1% Triton X-100 in PBS for 10 min twice, incubated in Sudan Black (0.5 g/500 mL 70% EtOH) for 5 min, washed in 0.1% Triton X-100 in PBS for 5 min and sealed with NucBlue mountant. Slides were then imaged using an Echo Revolution fluorescent microscope. Images were taken at 10x and stitched together using Echo Revolution Software. Representative images were processed in FIJI using the resize plugin106.
Brain sections were stained with cresyl violet to assess damage. Sections were placed in cresyl violet solution (Cat #229630050) for 8 min, transferred to 100% EtOH for 2 min, 90% EtOH for 2 min, 70% EtOH for 2 min, Oxylene (Cat #23412-01) for 2 min twice. Slides were then sealed with Cytoseal XYL (Cat. #8312-4). Slides were then imaged with the MoticEasyScan Infinity microscope and analyzed with the software Aperio ImageScope.
Immunofluorescence quantification: All imaging quantification was performed in the program FIJI107 on uninjured (2 days after a sham surgery), 2, 30, and 175 days after injury. Dentate gyrus quantification of NeuN-positive cells was performed using the freehand tool to create a region of interest (ROI) in FIJI to encompass the entire dentate gyrus as confirmed by NeuN staining on both the ipsilateral and contralateral side. The area of these ROIs was then measured in FIJI and the contralateral and ipsilateral regions were normalized to the contralateral area for each animal to account for slight variations between slice differences. Quantifications for microgliosis and astrogliosis were performed in the same way. Briefly, the ROIs were drawn with the freehand tool in FIJI over the contralateral and ipsilateral hemispheres as well as the regions of the brain with amoeboid, activated, microglia/macrophages and activated astrocytes based on IBA1 positive and GFAP positive cells, respectively. The area for all these ROIs were then measured and the area with activated microglia/macrophages or astrocytes was then calculated as a percentage of the area of the entire hemisphere it was in. Quantifications of neural stem cell/neural progenitor cell (NSC/NPC) and neuroblasts were performed similarly. NSC/NPCs were counted by a hand counter in the dentate gyrus as cells that were co-positive for GFAP and SOX2 staining. Neuroblasts were counted the same way except for cells positive for doublecortin (DCX). The length of the measured dentate gyrus was then recorded in FIJI using the freehand line tool. Numbers of cells were then reported as the average number of cells per 100 μm of the dentate gyrus. Measuring these subtypes in the SVZ was performed by using the freehand tool in FIJI to make ROIs of positive fluorescence for either SOX2 or DCX. The area was then recorded and divided by the length of the SVZ measured, as quantified by the freehand line tool, to provide the average width of the NSC/NPCs or neuroblasts in the SVZ.
Neurobehavioral tests
The open field and corner tests were performed at specific timepoints both before (baseline) and after injury (2 d, 7 d, 14 d, and 21 d) to assess neurological functions. Additionally, home-cage behavior was assessed at various timepoints both before (baseline) and after injury (0 d, 1 d, 4 d, and 6 d) to evaluate general recovery.
Open field: To assess spontaneous locomotor activity, we utilized the open field test as previously reported in Mus13,14,89,108. Acomys were acclimated in the behavior room for 20 min prior to beginning the test. Animals were placed in an open field (40 × 40 × 40 cm) and allowed to move freely for 10 min (item # 60101, Stoelting, Wood Dale, IL, USA). 70% ethanol was used to clean the field between each session. Animal order was chosen at random each session using random.org109. Movements were recorded and tracked by a video camera over the apparatus and further analyzed by the software Any-maze. Assessments included total distance traveled, average speed, time in center, and % turning clockwise. Exclusion of animals occurred if that animal escaped the open field by jumping out and the behavioral session was not completed. Animals that died between behavioral experiments had their pre-death analysis included. One exception was an animal that showed severe movement impairment, and we were requested by veterinary staff not to perform the behavioral experiments that day and the animal was found dead the next day.
Corner test: The corner test was performed to assess neurological deficits in turning. The Acomys were placed into the same apparatus as the open field test and recorded as stated above. Once in the apparatus, a clear plastic corner (30 degrees) was placed around the animal. Acomys were recorded for either 10 min, until the animal completed 10 successful left or right turns in the corner test, or escaped the corner test, dependent on which event occurred first. Animals were assessed in the same randomized order as the open field after all open field experiments were performed. The apparatus was cleaned with 70% ethanol after each use. Data is not shown for animals that escaped the test prior to completion of testing and in the absence of corner rearing like a typical Mus.
Home-cage behavior: Home-cage behavior was recorded to evaluate the general recovery before and after injury. Acomys were left in their home-cage and recorded using infrared cameras and infrared light for nighttime observation. Analysis was performed by hand in the behavior program Behavioral Observation Research Interactive Software BORIS110 using our specific ethogram for this study (Supplementary Table 4). Analysis was performed separating out both the dark and light cycle and quantifying the first uninterrupted 15 min of each hour for a 24-h period with the exception of the day of the surgery, which was the remainder of the light period for that day after surgery. A total of 20% of all the analyses was redone by a different individual (i.e., inter-reliability) and required at least a 90% accuracy for parametric data between reviews to be deemed as “good” reliability111. The exception to this was that we had less than 90% inter-reliability for rearing analysis, which had no significant changes over time (Supplementary Fig. 5c). The hours that comprised the 20% inter-reliability were chosen randomly using random.org. Data was missing for 9 total hr of all recorded time due to the camera being turned off or the animal having a cage change performed that altered their behavior. To account for this rare occurrence, all data is presented as a frequency in 15 min. Analysis of animal recordings was performed at least 45 min after handling by either the veterinarian staff or researchers to avoid bias in behavior due to handling. No animals analyzed were excluded in these studies.
Statistical analysis
Statistical significance was determined in GraphPad Prism for parametric data by a mixed-effects model or two-way ANOVA with Tukey or Bonferroni correction for multiple comparisons test based on the experimental design as stated in the figure legends. Two-tailed T-tests were performed for paired or unpaired comparisons of two parametric groups. Statistical significance for nonparametric data was performed by a Kruskal-Wallis test and standard error of the mean was used for graphing error bars for all the figures. At least three biologically independent variables were used in all statistical analysis (*p < 0.05; **p < 0.01; ***p < 0.001; ****p < 0.0001). Randomization was performed for all behavioral studies. Blinding was attempted, however visual cues of damage present or surgical wounds and healing made this impractical.


Responses