Sediment resuspension in muddy sediments enhances pyrite oxidation and carbon dioxide emissions in Kiel Bight
Introduction
The global ocean, and coastal seas in particular, are important ecosystems for atmospheric carbon dioxide (CO2) storage through the burial of biogenic particulate organic carbon (POC) and the generation of alkalinity via carbonate dissolution, pyrite (FeS2) burial and denitrification1,2,3,4,5. Fine-grained shelf sediments and coastal blue carbon ecosystems (CBCE), such as seagrass meadows and tidal marshes, preserve large amounts of POC and are hotspots of pyrite burial6,7,8. Although CBCEs occupy only 0.2% of the ocean floor, they play a major role in the marine carbon cycle by contributing significantly to the organic carbon burial in marine environments9. Thus, the conservation and restoration of CBCEs by banning bottom trawling in these areas through the establishment of marine protected areas has recently been recognised as a potential marine carbon dioxide removal (mCDR) strategy contributing to efforts of restricting global warming below 2 °C6,7. Fine-grained shelf sediments that are not covered by vegetation also accumulate large amounts of POC10. Most of the marine POC and FeS2 burial occurs in these muddy deposits due to their much larger particle surface area5,8,10,11,12,13,14,15,16. However, coastal sedimentary environments are strongly impacted by physical disturbances caused by natural and human activities. Natural resuspension events include tidal currents, faunal activities, and storm surges, whereas human activities include bottom trawling, dredging, sediment extraction, beach nourishment, and coastal protection measures17,18,19,20,21. Resuspension events disturb the sediment seabed and expose previously buried anoxic sediments to dissolved oxygen in the water column.
It has been argued that under re-exposure to oxygen, resuspended POC may undergo faster remineralization, potentially increasing CO2 emissions to the atmosphere22,23,24,25. In addition, the oxidation of reduced sediment-bound inorganic substances (e.g., ammonium, iron, hydrogen sulphide, and pyrite) can induce strong acidification and subsequent CO2 emissions, although this aspect has received hardly any attention22,23. Laboratory incubation experiments reported similar remineralization rates of highly reactive organic matter under oxic and anoxic conditions26,27. In contrast, other studies on coastal environments showed that exposure of POC to oxygen enhances remineralization of older, poorly reactive organic material24,28. Others observed that degradation rates of fresh and aged diatoms and barley hay were several-fold higher under oxic versus anoxic conditions29,30,31. So far, these end-member studies do not provide a consistent understanding of the effect of oxic and anoxic conditions on POC remineralization in natural sediments. Rather, they indicate that additional variables such as the composition, lability, origin, and age of the organic matter govern mineralisation rates in marine sediments24,28,29,32,33,34. To evaluate whether the protection of muddy sediment deposits and CBCEs has a significant effect on carbon preservation and CO2 fluxes, it is vital to identify and quantify POC degradation pathways and associated geochemical processes triggered by sediment resuspension and oxygen exposure.
Sediment resuspension events induced by natural processes such as winds and currents may result in large-scale transport and redistribution of sediment masses depending on the hydrodynamic conditions17,35. Simulation studies on particle transport by natural process have shown that the sediment export by waves and currents were four orders of magnitude higher than anthropogenic processes such as bottom trawling17. Even cohesive muddy sediments are known to be resuspended36. The lack of concurrent measurement of natural resuspension events, such as tides and storms, makes it currently difficult to understand their impact on POC degradation. In contrast, the availability of long-term vessel monitoring data supports the study of anthropogenic sediment resuspension processes by trawling and its impact on POC degradation37,38. Several studies on sediment resuspension by bottom trawling on shelf sediments have argued that POC remineralization rates could be enhanced due to microbial and chemical processes following trawling39,40. A recent study by Sala et al.41 suggested that global trawling events would result in 0.58–1.47 Pg of aqueous CO2 release annually (equivalent to 0.16–0.4 Pg C), owing to increased POC remineralization. Various follow-up studies and reviews23,42 have questioned the accuracy of these numbers. CO2 emissions may have been over-estimated by unrealistically high POC reactivities (i.e., first-order remineralization constant) for the resuspended bulk sediment, which is typically a mixture of high, medium, and low reactive POC with variable degradation rates22,42,43.
Against this backdrop, our study aims are twofold. First, we determine whether POC remineralization is enhanced by sediment resuspension and oxygen exposure using slurry incubation experiments and modelling. Second, we investigate whether associated redox reactions, such as aerobic oxidation of reduced compounds, play a comparable role in CO2 production. The incubation experiments were performed under oxic and anoxic conditions using an agitated sediment slurry that mimics a resuspended sediment plume. The geochemical datasets derived from the incubation experiments are interpreted with a numerical reaction model to provide a better mechanistic understanding of the changes in biogeochemical processes triggered by sediment resuspension and exposure to oxygen. The results are then extrapolated with a simple box model of the sediment and water column to investigate the impact of sediment resuspension on CO2 fluxes across the sea surface.
All sediment samples were recovered from the Kiel Bight, which is a coastal shallow water area in the western Baltic Sea, NW Europe (Supplementary Fig. 1). The three sediment sampling sites, namely Boknis Eck, Aschau, and Heiligenhafen (Supplementary Fig. 1), are characterised by different grain sizes, POC contents, and variable seagrass cover (Supplementary Table 1). Fine-grained and organic-rich mud is deposited in the deeper parts of Kiel Bight (e.g., Boknis Eck, 5 wt.% C) that cover 14% of the total seafloor area (Supplementary Fig. 1 and Supplementary Table 2). The shallower parts of Kiel Bight are covered by fine sand and muddy sand (~59 % of the total area, e.g., Aschau and Heiligenhafen, each containing 1 wt.% C, respectively) (Supplementary Fig. 1 and Supplementary Table 2). Seagrass meadows are found in some coastal areas of Kiel Bight, such as Aschau44. The remaining shallow seafloor area is composed of glacial till out-crops and lag sediments due to strong bottom currents that inhibit the deposition of mud45. Natural resuspension events in this area are mainly driven by the storms and saline water inflows from the North Sea46. The deeper and more quiescent areas are dominated by continuous mud deposition with no significant natural resuspension45,47. Anthropogenic resuspension triggered by human activities such as bottom trawling have a potentially strong local impact on sediment mixing and resuspension in Kiel Bight37,38. Bottom trawling pressure varies spatially, whereby about 60% of the muddy depositional areas and 50% of the sandy areas were trawled during the year 2022 (Supplementary Fig. 2 and Supplementary Table 2).
Results
Muddy sediment with high POC content (Boknis Eck)
The unvegetated sediment at Boknis Eck is characterised as fine-grained mud (D50 = 47 μm) with a high POC content (5 wt.%, Supplementary Tables 1 and 3, and Supplementary Figs. 3 and 4). Dissolved oxygen in sediment slurry incubations was depleted quasi-exponentially, and the sediment became anoxic after 35 days, at which point dissolved inorganic nitrogen (DIN, i.e., nitrate + nitrite + ammonium) increased sharply to ~84 µmol L−1 after 95 days (Fig. 1a, b). Dissolved manganese (Mn2+) and ferrous iron (Fe2+) concentrations also increased rapidly upon the onset of anoxia (Supplementary Fig. 5a, b). SO42− and Ca2+ increased in the oxic stage and then tended to level off under anoxic conditions (Fig. 1c, d). Total alkalinity (TA) increased throughout the incubation, yet more rapidly in the presence of oxygen. By contrast, pH decreased in the oxic period from 8.1 to 6.5, whereas in the anoxic period, pH showed an increase from 6.5 to 7.0. Dissolved inorganic carbon (DIC) concentrations, derived from the measured TA and pH, showed a similar behaviour to TA. The slurry was strongly undersaturated with respect to calcite at the end of the oxic period (ΩCa = ~0.18), while the saturation state gradually increased in the subsequent anoxic period (ΩCa = ~0.21 to 0.83).
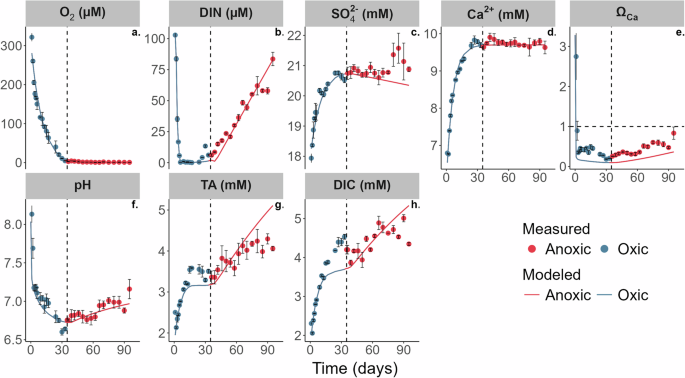
Measured (symbols) and simulated (curves) geochemistry in the oxic-to-anoxic slurry incubation (a–h). Dashed vertical lines denote the time when dissolved O2 concentrations in the slurry turned anoxic (<5 µmol L−1). The horizontal dashed line in the ΩCa plot represents ΩCa = 1 (saturation with respect to calcite). The error bars indicate the standard deviation of three replicate measurements from the same sampling day. DIC and ΩCa were derived from measured TA and pH.
Sandy vegetated sediment with medium POC content (Aschau)
Parallel oxic and anoxic incubations were performed for seagrass-covered sediments from Aschau (muddy sand; D50 = 67 µm) with a medium organic carbon content of about 1 wt.% (Supplementary Tables 1 and 3, and Supplementary Fig. 3). The geochemical profiles under oxic and anoxic incubations showed similar behaviour as Boknis Eck, whereby dissolved O2 concentrations in the oxic incubations decreased gradually throughout the whole incubation period albeit at a much lower rate (Fig. 2a). DIN concentrations in the oxic incubations increased steadily from ~19 to 127 µmol L−1. Mn2+ and Fe2+ concentrations remained below 1 µmol L−1 under oxic conditions and reached higher values under anoxic conditions (Supplementary Fig. 5f, g). SO42− concentrations increased (~18 to 19 mmol L−1) under oxic conditions and decreased gradually (~17 to 16.5 mmol L−1) in the anoxic incubations (Fig. 2c). Ca2+ increased substantially by ~2 mM under oxic conditions, and remained constant in the absence of oxygen.
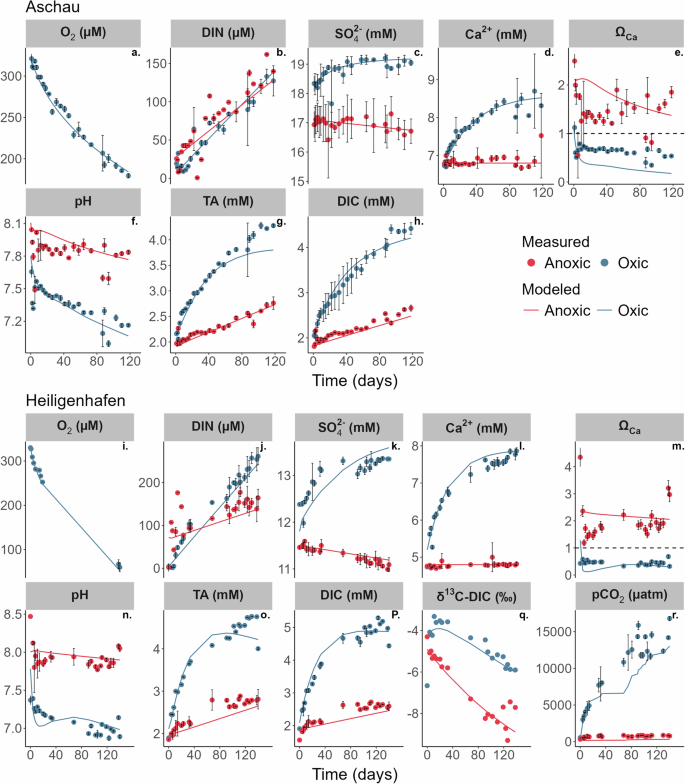
Measured (symbols) and simulated (curves) geochemistry in the oxic and anoxic slurry incubation of sediments from Aschau (a–h) and Heiligenhafen (i–r). The horizontal dashed line in the ΩCa plot represents ΩCa = 1. The error bars indicate the standard deviation of three replicate measurements from the same sampling day. DIC and ΩCa concentrations were derived from measured TA and pH.
TA and DIC (calculated) showed a greater increase in the oxic (~2.1 to 4.1 and ~2.0 to 4.5 mmol L−1) incubations compared to the anoxic incubations (~1.9 to 2.7 and ~1.8 to 2.6 mmol L−1). In the oxic incubations, pH showed a decreasing trend from 7.6 to 7.1. The anoxic incubations were more alkaline, with pH values ranging between 7.9 and 8.0. The solution was undersaturated with respect to calcite (ΩCa < 1) in the oxic incubations and oversaturated (ΩCa > 1) in the anoxic incubations.
Sandy, non-vegetated sediment with medium POC content (Heiligenhafen)
Similar to Aschau, parallel oxic and anoxic incubations were performed for sediments from Heiligenhafen (muddy sand, non-vegetated area; D50 = 71 μm), with a medium organic carbon content (1 wt.%; Supplementary Tables 1 and 3, and Supplementary Fig. 3). The dissolved O2 concentrations in the oxic incubations decreased gradually throughout the whole incubation period at a much lower extent than for both Boknis Eck and Aschau (Fig. 2i). DIN concentrations in the oxic incubations increased steadily from ~4 to 261 µmol L−1. Mn2+ and Fe2+ concentrations remained below 1 µmol L−1 under oxic conditions and rose under anoxic conditions. SO42− concentrations increased (~11 to 13 mmol L−1) under oxic conditions and decreased gradually (~11.4 to 11.0 mmol L−1) in the anoxic incubations (Fig. 2k). Ca2+ increased substantially by ~3 mM under oxic conditions, and remained constant in the absence of oxygen.
TA and DIC (calculated) showed a greater increase under oxic conditions (~1.8 to 4.7 and ~1.9 to 4.9 mmol L−1) compared to the anoxic incubations (~1.8 to 2.8 and ~1.5 to 2.5 mmol L−1). In the oxic incubations, pH decreased from 7.5 to 7.0. The anoxic incubations were again more alkaline, with pH values ranging between 8.0 and 8.1. A constant and sharp increase in measured pCO2 from ~550 to 16800 µatm was observed at Heiligenhafen in the oxic incubations, whereas pCO2 showed only a slight increase from ~330 to 780 µatm in the absence of oxygen (Fig. 2r). Calcite remained undersaturated (ΩCa < 1) in the oxic incubations and oversaturated (ΩCa > 1) in the anoxic incubations.
Model results
The numerical model fits to the Boknis Eck data were achieved using an initial age (a0) for remineralised POC of 4.3 yr for the oxic period and 4.4 yr for the anoxic period (see Eq. (13)). These translate to a mean oxic first-order rate constant (kPOC) of 0.039 yr−1 for the first 35 days when oxygen was available, and 0.037 yr−1 for anoxia (Table 1). These values are identical, given the uncertainties in the data. However, differences in a0 between the oxic and anoxic incubations at Heiligenhafen and Aschau incubations were much more pronounced. For the oxic runs, a0 was 2.46 and 1.3 yr, equivalent to kPOC of 0.08 and 0.14 yr−1 for Aschau and Heiligenhafen, respectively. For the anoxic runs, the a0 range was 4.10 and 3.18 yr−1, corresponding, to rate constants of 0.04 and 0.05 yr−1 (Table 1). Thus, kPOC was fairly uniform for all anoxic incubations but showed large variation for the oxic incubations, with Boknis Eck having the lowest oxic value. At all sites, the model predicted that carbon remineralization in oxic incubations was dominated by aerobic respiration and by sulphate reduction during the anoxic incubation, with markedly higher rates at Boknis Eck (Table 2). This is not surprising given the differences in POC content (5, 1, and 1 wt.%, Supplementary Table 1). The other POC remineralization pathways were negligible in comparison (Supplementary Table 4).
Further constraints on POC remineralization were provided by measured δ13C-DIC in Heiligenhafen slurries (Fig. 2q) that indicate that DIC in the anoxic experiments is mainly derived by POC remineralization and by calcite dissolution in the oxic experiments. δ13C-DIC values generally decreased over time and converged towards heavier values (−5‰) in the oxic incubations compared to the anoxic incubations (−8‰). The data were simulated with a δ13C-POC value of −18‰ and imposing a δ13C-CaCO3 value of 1‰48,49. The δ13C-POC fits well with published δ13C values of marine organic matter (−16 to −22‰50) and also with sediments from the southwestern Baltic Sea51,52.
Other significant reactions determined by the numerical reaction model include calcite dissolution and pyrite oxidation that were constrained by the Ca2+ and SO42− data (Table 2). Calcite dissolution rates were 4493, 226, and 358 nmol Ca g–1 d–1 at Boknis Eck, Aschau, and Heiligenhafen sediments, respectively (Table 2). Aerobic pyrite oxidation rates were 1742, 55, and 105 nmol Fe g–1 d–1. Pyrite oxidation and aerobic POC remineralization were the dominant oxygen sinks at all the study sites (Fig. 3). Pyrite oxidation is the largest sink of oxygen in the carbon-rich muddy sediments of Boknis Eck compared to the sandier sediments of Aschau and Heiligenhafen (Fig. 3 and Supplementary Fig. 6).
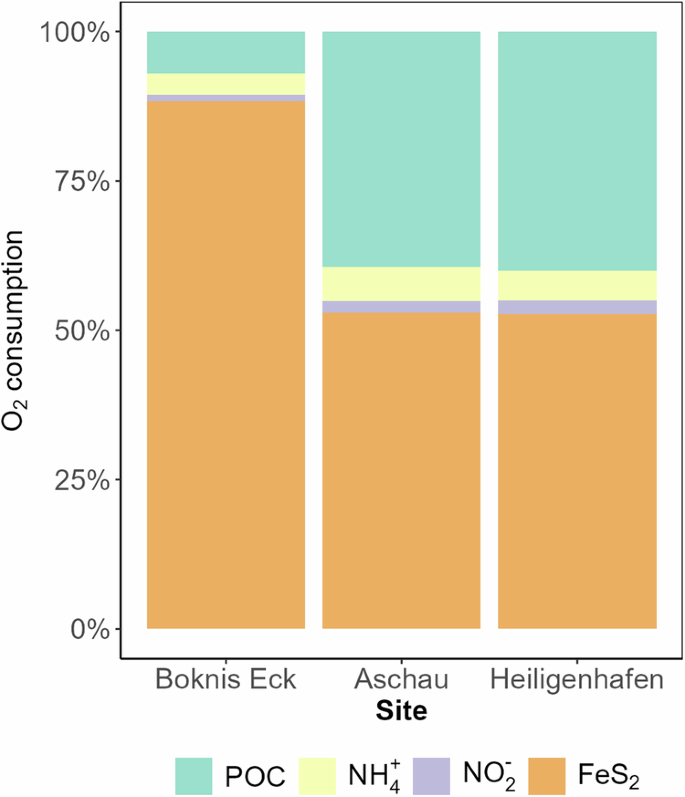
Pathways: POC: POC degradation, NH4: ammonium oxidation to nitrite, NO2: nitrite oxidation to nitrate, FeS2: pyrite oxidation).
Discussion
Effect of oxygen exposure on organic matter remineralization rates
Oxygen availability is an important factor for POC remineralization in marine sediments, alongside other variables such as POC composition, lability, and origin24,32,33,34,53,54, albeit with a certain degree of controversy. Previous studies reported that organic carbon remineralization rates under oxic conditions are higher55, lower56 or similar to anoxic conditions26,27. The data obtained here demonstrate that POC remineralization rates in the oxic incubations were approximately two-fold higher than in the anoxic incubations at Aschau and Heiligenhafen, where coarse-grained sediments are deposited (Table 2). A negligible difference between oxic and anoxic incubations was observed at Boknis Eck, where fine-grained sediments dominate. Previous studies have suggested that POC in fine-grained muddy sediments is protected against remineralization by adsorption to mineral surfaces32. This could explain the similarity of the oxic and anoxic rates at Boknis Eck. In the coarser and organic poorer Aschau and Heiligenhafen sediments, the oxygen effect is more readily manifested. Although our study sites are limited in number, our data tentatively suggest that total POC remineralization rates were controlled by the bulk POC content, whereas the difference between oxic and anoxic remineralization was controlled by grain size.
Higher POC remineralization rates under oxic conditions imply elevated CO2 emissions following resuspension events. Accurate predictions of the CO2 emitted during sediment resuspension are limited by the uncertainties in the remineralization rate constant (kPOC)22,42. The available data on the effect of resuspension on the reactivity of the carbon stock is very limited22,42,57. We determined mean kPOC values of 0.110 yr−1 under oxic conditions and 0.051 yr−1 under anoxic conditions for the two sites where parallel oxic and anoxic incubations were carried out (Table 1). It should be noted that homogenised sediment from the upper 10 cm was used in the incubations, which provides only a bulk estimate of POC reactivity over that layer, since most of it will be old, unreactive POC. This complicates comparisons with literature data on undisturbed sediments, since we do not resolve how POC reactivity decreases with depth in the sediment. The data instead highlight the larger relative differences in rate constants between oxic versus anoxic remineralization following the resuspension of anoxic sediment.
The empirical model suggests that bulk-resuspended POC has a much lower reactivity than previously assumed. Our kPOC values are two orders of magnitude lower than a previous study by Sala et al.41 that applied literature kPOC values for oxic remineralization from different oceanic regions ranging from 0.275 to 16.8 yr−1 to calculate potential CO2 emissions by trawling. Our experimentally derived mean kPOC values of bulk POC during oxic and anoxic conditions (0.11 and 0.05 yr−1) agree better with the mean value of 0.05 yr−1 suggested by Hiddink et al.42 for the bulk POC stock (0.01–0.1 yr−1) in sub-surface sediments. Similarly, in a recent study, Atwood et al.57 recalculated the CO2 emissions by trawling using a reduced global average kPOC of 0.028 yr−1, which is close to our experimentally derived value. This resulted in a lower global CO2 emission of 0.02-0.03 Pg CO2 yr−1 due to bottom trawling than previously reported by Sala et al.41 (1.47–0.58 Pg CO2 yr−1), who used a global average kPOC of 2.6 yr−1. The lower reactivity reflects the fact that surface sediments retrieved from 0 to 10 cm sediment depth contain mostly old and unreactive POC that accumulates in these deposits because it is not fully degraded under natural anaerobic conditions. The unreactive POC fractions survive aerobic microbial degradation and accumulate in anaerobic sediments while the more highly reactive fractions are rapidly consumed aerobically at the oxic surface. Therefore, it is important to consider that CO2 release induced by sediment resuspension is not governed by the total amount of POC resuspended since most of it will be poorly reactive (low kPOC). It is instead likely that only a small fraction of this poorly reactive material will be degraded under regenerated aerobic conditions.
Pyrite oxidation and carbonate dissolution induced by oxygen exposure
Our study highlights that OM degradation is not the only process that has to be considered in the context of resuspension and mCDR. The modelling results show that resuspension of anoxic sediments in oxygen-bearing bottom waters triggers a cascade of biogeochemical processes, resulting in the release of large amounts of TA. The rate of TA production is two-fold higher in the oxic incubations (~13.9 nmol cm−3 d−1) compared to anoxic (~6.7 nmol cm−3 d−1) conditions (Figs. 1–2). This is perhaps surprising because stoichiometric reasoning would predict that aerobic respiration of organic matter should release lower amounts of TA compared to anaerobic pathways58. Substantial Ca2+ production and the measured δ13C-DIC values at Heiligenhafen (Fig. 2) indicate that high rates of calcite dissolution are responsible for the TA release under oxic conditions. Under oxic conditions, aerobic respiration of organic matter (Eq. 1) generates CO2 and drives down the porewater saturation state with regard to carbonate minerals, resulting in their dissolution and TA production59. Hence, we compared TA: Ca ratios under oxic conditions to understand the impact of calcite dissolution on the total TA flux. The TA: Ca ratios under oxic conditions were ~1:1 at sandy sediment sites Aschau and Heiligenhafen (Fig. 4). For the muddy Boknis Eck, the ratio was ~0.46:1. Considering the reduced oxidation state of organic matter (see Methods), and ignoring the small contribution of phosphate to TA, these processes can be summarised as:
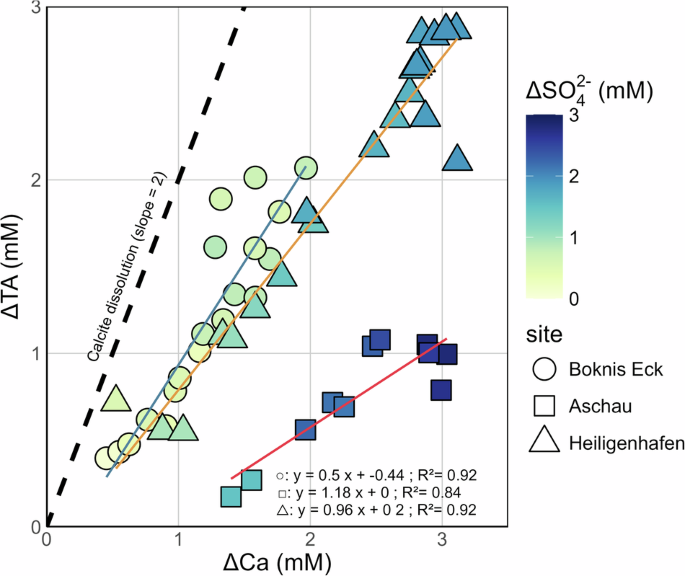
Red, blue, and orange lines show linear correlations at each site. The colour bar represents the change in SO42− concentrations during the incubations. The dashed line represents the theoretical slope for calcium carbonate dissolution. ΔTA and Ca refer to the change in concentrations from the initial values.
The small production of TA by aerobic mineralisation is due to ammonium release. Upon the dissolution of calcite, TA and Ca2+ are produced in a 2:1 ratio (Eq. 2), suggesting that the higher rate of TA production under oxic conditions was at least partly driven by calcite dissolution (Figs. 1 and 2). However, the TA: Ca ratio in our oxic incubations is below the theoretical ratio for calcite dissolution, which implies a source of Ca2+ or sink of TA. No indication for processes that produce calcium, such as silicate or apatite dissolution, could be observed in our data. Considering the increase of SO42− concentrations under oxic conditions (Figs. 1 and 2), the TA produced by calcite dissolution can be partly consumed by the oxidation of pyrite:
Oxidation of 1 mole of pyrite consumes 4 moles of TA. Hence, the observed TA: Ca ratios under oxic conditions can be explained by the net balance of aerobic respiration, calcite dissolution, and pyrite oxidation. With these processes incorporated into the model, the net effect of these reactions on the Ca2+ and TA balance is expressed by combining the modelled rates of aerobic OM remineralization, calcite dissolution, and pyrite oxidation for each site after normalisation to aerobic remineralization (Table 3). The slopes of the linear regressions in the property-property plots (Fig. 4) are consistent with the combined rates of the modelled aerobic respiration, calcite dissolution, and pyrite oxidation considering the standard error of the linear regressions in Fig. 4. Thus, the balance of these three processes is responsible for driving the evolution of SO42−, TA and Ca2+ under exposure of sediments to oxygen.
It is unlikely that the alkalinity produced in the oxic incubations by calcite dissolution will be replicated in the natural system following a sediment resuspension event. In the closed experimental vials, the acidity produced by pyrite oxidation creates favourable conditions for carbonate dissolution. In the natural system, the acidity will be rapidly dispersed in the water column by bottom currents and further buffered by the seawater carbonate system. However, it remains largely unknown whether pyrite oxidation will increase the pCO2 of the ambient seawater and, consequently, favour CO2 release from the seawater to the atmosphere.
Previous studies reported high pyrite burial rates of 1.9–18 Tg yr−1 in CBCEs5, demonstrating that oxidation of these pyrite reservoirs following resuspension has the potential for CO2 release, or reduced CO2 uptake, in these areas. Recent estimates of TA fluxes induced by pyrite burial in the Baltic Sea are ~43 Gmol yr−1 15. The incubation data and the model results highlight that anthropogenic or natural resuspension would compromise this alkalinity flux through re-oxidation of pyrite. Oxidation may take place in the water column or at the sediment surface if pyrite crystals settle to the seafloor. It is further likely that the dissolved Fe from pyrite oxidation will be oxidised back to particulate iron oxyhdroxides, and eventually accumulate again as pyrite when buried in the sediment, thus restoring alkalinisation. However, the time required for pyrite burial can range from a few years to decades, depending on various factors, including the depositional environment, sedimentation rate, and redox conditions. In contrast, pyrite oxidation may require a few days to months (Supplementary Fig. 6). To our knowledge, the impact of pyrite oxidation on CO2 budgets in frequently disturbed settings by sediment resuspension has not yet been quantified41,57. Investigation into the rates and coupling mechanisms of these processes and their inclusion in ecosystem models would be an interesting area for future work.
Impact of sediment resuspension on atmospheric CO2 uptake in Kiel Bight
To accurately quantify CO2 emissions caused by resuspension events in the natural environment, field observations are required, focusing on the frequency of resuspension events, resettling and redistribution of the sediment plumes, and the fate of the TA and strong acid produced by coupled processes described above. As an initial step in this direction, a simple box model was set up to test whether the carbon pump in Kiel Bight may be compromised by CO2 release induced by sediment resuspension and pyrite oxidation in the water column due to bottom trawling (see Methods). We selected bottom trawling as a case study for understanding the impact of sediment resuspension primarily due to the availability of relevant field data. Two types of trawling were investigated based on field observations; frequent (annual) shallow trawling where the top 2 cm of sediment are resuspended, and a single deep trawling event (top 10 cm). The latter represents the dragging of penetrating gear, such as otter boards, across the seafloor, whereas the former represents the dragging of the connecting ropes and rollers at the bottom of the trawl net. The results show that in the absence of trawling, the water column in the study area acts as a sink for atmospheric CO2 at all sites (positive CO2 flux, Fig. 5 and Supplementary Fig. 7). The decline in sedimentary POC and pyrite content of surface sediments induced by resuspension leads to changes in atmospheric CO2 fluxes and in the saturation state with respect to calcite in the water.
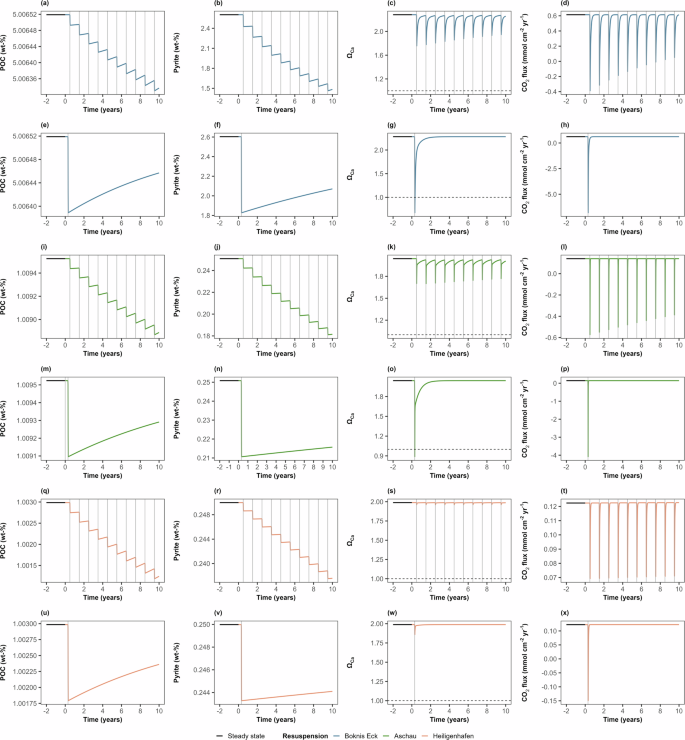
Data show POC, pyrite, ΩCa, and CO2 flux for (a–d) Boknis Eck shallow trawling, (e–h) Boknis Eck deep trawling, (i–l) Aschau shallow trawling, (m–p) Aschau deep trawling, (q–t) Heiligenhafen shallow trawling, (u–x) Heiligenhafen deep trawling. In all panels, the horizontal solid black lines show the steady state conditions prior to resuspension. Blue, green, and orange lines show the study sites Boknis Eck, Aschau, and Heiligenhafen, respectively. The vertical grey lines indicate resuspension events for shallow trawling or a single deep trawling event. The horizontal dashed lines in the ΩCa plots represent ΩCa = 1. Time is given relative to the onset of resuspension.
The major outcome of our trawling data-based modelling scenarios shows that trawling-induced resuspension significantly reduces the FeS2 stocks and releases large amounts of CO2 into the water column and the atmosphere, transforming the study sites temporarily from a sink to a source of CO2 (Fig. 5). The significant decline in the FeS2 stocks is more pronounced in the muddy sediments of Boknis Eck, as well as in the deep trawling scenarios (>10 cm), which exhibit a larger sediment penetration depth compared to shallow trawling (<2 cm). Importantly, the loss of surface stocks of POC and subsequent CO2 release is negligible compared to the decline in pyrite stocks in both deep and shallow trawling scenarios. Pyrite oxidation in both muddy and sandy sediments induces large episodic CO2 fluxes into the atmosphere and reduces the CO2 uptake efficiency of Kiel Bight as well as the mean annual uptake fluxes of atmospheric CO2 (Fig. 6). The trawling effect is, however, small due to the brief trawling period and short oxygen exposure time applied in the model (5 days) and the limited trawling frequency indicated by the data (Supplementary Table 2). The oxygen exposure time may in fact be larger than assumed in the model since a fraction of the trawled sediment may spread as a sediment plume and settle over a large seafloor area where the previously anoxic sediment is exposed to bottom water oxygen over extended periods (months to years). The changes in mean annual CO2 uptake rates (Fig. 6) should, hence, be regarded as minimum estimates. The model shows that almost the entire CO2 flux change is induced by pyrite oxidation (~99%), and this key process should be considered in future trawling and resuspension studies.
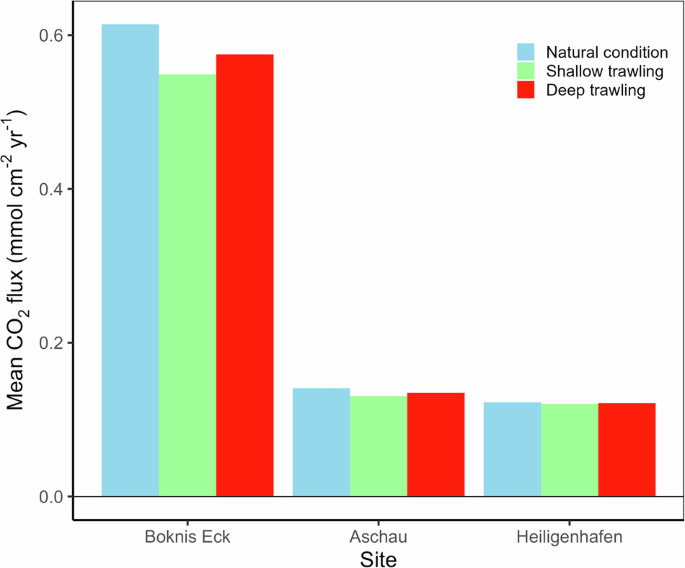
Results are shown before resuspension (blue bars), and over the following 10 years for each trawling scenario (green and red bars).
The model runs also show that deeper trawling with low frequencies (10 cm, 1 event every ten years) might cause a significant immediate impact on the sediments initially and lead to a higher subsequent CO2 release in the short term. However, more frequent shallow trawling (2 cm, 1 event per year) leads to a larger cumulative long-term impact on the sediments due to its higher frequency of disturbance, even though the individual events have a smaller immediate effect on CO2 uptake. Following deep trawling, the water column in Kiel Bight becomes undersaturated and facilitates calcite dissolution. In contrast, the bottom waters remain oversaturated with respect to calcite for all model runs with shallow trawling suggesting that the carbonate dissolution observed in our experiments will only occur under field conditions with trawling gear penetrating >10 cm of sediment, or deep natural resuspension. Upscaling of CO2 release in our muddy sediment trawling model to the fine-grained muddy areas of Kiel Bight (485 km2) indicates that the decrease in mean annual CO2 uptake in muddy areas would amount to approximately 14,000 and 8000 tonnes of CO2 yr−1 for shallow and deep trawling, respectively.
In contrast to previous work, our model is based on kinetic data derived from laboratory experiments simulating sediment resuspension. In reality, however, the impact of sediment resuspension on coastal ecosystems is highly complex23,40,42,60,61. We specifically assumed in our model that resuspension is limited to 5 days. However, the actual duration for which the resuspended sediment is exposed to oxygen whether as suspended solids or as a thin sediment layer spread over the affected area is unclear. This and other simplifications highlight that more work and detailed modelling should be conducted to consolidate our findings. Nevertheless, our combined empirical-numerical approach suggests that bottom trawling and other means of activities inducing large-scale resuspension of anoxic shelf sediments in Kiel Bight and other CBCEs may weaken the shelf carbon pump that contributes significantly to the uptake of anthropogenic CO2. Since fine-grained, mud-bearing sediments are typically enriched in POC and, more importantly, pyrite, the protection of seafloor areas where these muds accumulate could help to mitigate the effects of bottom trawling on atmospheric CO2 uptake in shelf regions.
Methods
Study area and sample collection
Kiel Bight is a narrow sub-basin in the southwestern Baltic Sea, extending from the Flensburger Fjord in the west to the Fehmarn Belt in the east (Supplementary Fig. 1). The restricted lateral water exchange with adjacent water masses and the freshwater influxes lead to brackish water conditions46. Depocenters in Kiel Bight are dominated by organic-rich muddy sediments whereas areas with no or little sediment deposition are characterised by sandy sediments46. The surface sediments are also influenced by calcium carbonate-bearing glacial tills accumulated through the erosion of coastal cliffs62.
Sediment cores were collected from three sites with variable grain sizes, POC content, and vegetation cover during two RV Littorina cruises in autumn 2021 and summer 202263 (Supplementary Table 1). Boknis Eck is a small channel of Eckernförde Bay with a mean water depth of ~28 m and salinity ranging from 18 to 2464. The surface sediment is characterised by high total organic carbon (POC) contents of 4 to 5%65. The high POC content originates from plankton and macroalgal sources as well as periods of hypoxia to anoxia that contribute to the preservation of POC during the summer months66. The oxygen penetration depth in the study area Boknis Eck is <1.6 mm during the winter months67,68. The sediment core from Boknis Eck was retrieved using a mini-multiple corer (MUC) equipped with 4 core liners (60 cm long) with an inner diameter of 10 cm. Heiligenhafen is a small, shallow bay separated by a large sand bar (‘Graswarder’). Water depth ranges from 0.8 to 7.6 m and salinity varies between 8 and 18 depending on the inflow of fully saline North Sea water69. A sediment core from the site was retrieved using a Frahmlot corer (100 cm long tube) with an inner diameter of 10 cm. The study site Aschau is a marine protected area characterised by the occurrence of sparsely populated patches of the seagrass Zostera marina44. The sediment core from here was collected by SCUBA divers using an impact-resistant PVC tube at a water depth of 3 m. The divers pounded the tube into the sediment with a rubber mallet before capping both ends and storing the core upright for transport to the shore and later to the lab.
Experimental setup
Following previous studies24,28, the upper 10 cm of the sediment cores were selected for preparing the slurrys for the incubations. Triplicate samples were taken from the sediment for the determination of porosity, POC, particulate inorganic carbon (PIC), and particulate nitrogen (PN) content. Afterward, the upper 10 cm sediment was diluted with filtered natural seawater taken at the sampling sites in a ratio of 2:1 (water: sediment) and homogenised using a magnetic stirrer. Seagrass roots, and shell fragments were removed manually. Approximately 3 g of the homogenised suspension were transferred into pre-weighed 50 mL glass incubation bottles and again diluted with ~27–30 mL of filtered seawater (0.2 µm) taken from the respective study site (Supplementary Table 5), resulting in a slurry-to-headspace ratio of 30–33 mL: 17–20 mL. The different slurry to headspace ratios resulted from the amendments on the water volume in study sites Aschau and Heiligenhafen to have more headspace gas for pCO2 sampling. For Aschau and Heiligenhafen, batches consisting of a minimum of 80 oxic and anoxic incubation bottles were prepared. For Boknis Eck, only oxic samples were prepared. Due to the high oxygen respiration rates in these samples, the Boknis Eck slurries turned anoxic after about 35 days and the experiment was continued for another 65 days to investigate the biogeochemical turnover under anoxic conditions. The incubation bottles were sealed with a rubber septum and a metal cap to allow for sampling of the headspace gas. The headspaces for the oxic and anoxic experiments were then purged with compressed air and N2 gas, respectively, for ~20 min in the laboratory. Subsequently, the bottles were placed on a mechanical shaker and continuously rotated to ensure optimal mixing of slurry and the headspace gas throughout the experiment. The experimental conditions corresponds to the bottom water temperature during sampling (Supplementary Table 5). Sampling was conducted every day during the first 10 days of the incubation, and sampling intervals were increased to 2–4 days and weekly towards the end of the incubation. At each sampling, three oxic and anoxic bottles were opened and processed to determine the temporal evolution of the headspace gas and the slurry composition. Bottles containing only gas and filtered seawater were used as controls. All slurries and controls were incubated in the dark at ~4 °C or ~12 °C for 95 to 240 days. Changes in control bottles at the end of the experiments were always <4% of initial concentrations.
Sampling and analysis
Dissolved O2 was measured at each sampling interval with a microsensor (UnisenseTM sensors Opto-50) inserted through the rubber septum. The device was calibrated using a 2-point calibration of 100% saturation using aerated seawater and with a 0% oxygen saturation solution provided by the manufacturer. Then, each bottle was opened and pH was measured immediately by inserting a pH probe calibrated using Ampy and Bis buffers70, and Tris buffers71 for the brackish water. Subsequently, ~20 mL of water was sampled from the slurry in the bottles using rhizone filters. Filtered samples were collected into a sterile 20-mL plastic bottle, and TA was analysed immediately after filtering. Sub-samples for dissolved sulphate (({{{mbox{SO}}}_{4}^{2-}})), nitrate (({{{mbox{NO}}}_{3}^{-}})), nitrite (({{{mbox{NO}}}_{3}^{-}})), ammonium (NH4+), ferrous iron (Fe2+), DIC, δ13C-DIC (Heiligenhafen only), and major cations were collected and stored refrigerated for later analysis.
Concentrations of NH4+ were analysed using a Hitachi U-5100 spectrophotometer following standard photometric procedures72. TA was analysed by titration of 1 mL sample solution with 0.02 N HCl following Ivanenkov and Lyakhin72,73. The titration vessel was constantly bubbled with argon to remove the CO2 and H2S produced during the titration.The sample measurements were calibrated relative to the IAPSO seawater standard. Subsamples for the analysis of cations were acidified with 20 μL of concentrated supra-pure HNO3 per 2 mL of water sample and were determined by inductively coupled plasma optical emission spectroscopy (ICP-OES, Varian 720-ES). SO42− concentrations were determined using ion chromatography (IC, METROHM 761 Compact conductivity mode).
Samples collected for DIC were transferred into a 1.7 mL glass vial, fixed with 10 µL saturated HgCl2 solution, and crimp sealed. DIC concentration was measured as CO2 with a multi N/C 2100 analyser (Analytik Jena) by acidifying the sample with phosphoric acid and measuring the outgassed CO2. The detection limit was 20 µM with a precision of 2–3%.
Samples for δ13C-DIC analysis were collected as described for DIC and measured at the University of Bremen by isotope ratio infrared spectrometry (IRIS; Thermo Scientific Delta Ray IRIS with URI connect and Cetac ASX-7100 Autosampler). 1 mL of sample was injected by syringe into a prepared 12-mL Exetainer® vial (Labco) containing 100 µL phosphoric acid (45%) which had been purged with CO2 free synthetic air. After equilibration overnight at room temperature, the headspace was analysed for carbon isotope ratio of CO2 against CO2 reference gas using the Delta Ray system. Results are reported in the delta notation as δ13C relative to VPDB standard.
pCO2 values in the incubation experiments with sediments from Boknis Eck and Aschau were derived from the measured TA and pH using thermodynamic equilibrium constants (total pH scale) of the carbonate system in seawater for the measured salinity and temperature following Zeebe and Wolf-Gladrow49. For sediments from Heiligenhafen, pCO2 was additionally measured in headspace samples. Before opening the slurry bottles, a triplicate of gas samples was collected at each time point using 250 µl gastight syringes inserted through the rubber septa. pCO2 was analysed using a Shimadzu GC-2014 gas chromatograph equipped with a thermal conductivity detector (TCD) and flame ionisation detector. CO2 was separated from other gases by using a HaySepQ 80/100 column (Length = 8 ft, ID = 2 mm) at isothermal conditions and helium (ALPHAGAZ 1) as carrier gas. The measured TCD signals of CO2 were calibrated against reference standards with an accuracy of ±2% (All-In-Gas, Germany).
After sampling, the slurry bottles were weighed, and the remaining slurry was freeze-dried and the solid contents were grounded. The contents of POC and PIC in freeze-dried and ground sediment samples were analysed by flash combustion using an EuroEA 3000 element analyser (EuroVector, Pavia, Italy).
The pyrite content of sediments was estimated by analysing chromium-reducible sulphur following Canfield et al.74. Liberated sulphur was trapped as zinc sulphide and analysed by photometry75. The extraction was performed on wet sediment samples. Results were converted to pyrite concentrations per dry weight of sediment using the water content. The accuracy and long-term reproducibility of the method were monitored by extracting pure pyrite mixed with quartz sand and an in-house standard (OMZ-2, Peru margin sediment).
Sediment grain size was analysed with a laser-particle-sizer (Fritsch Analysette-22 NanoTec v2007; range 0.1 to 985 μm). The organic and carbonate fractions were not removed prior to the sample treatment. Statistical analyses were performed using G2SdG, a dedicated R-package for analysing grain size distributions76. Results are presented on the gravel (>2 mm) – sand (0.0625 to 2 mm) – mud base (<0.0625 mm), defining mud as combination of silt and clay. Accuracy of measurements was ensured by regular analysis of an in-house standard.
Numerical reaction model simulation of slurry incubation experiments
A numerical box model was developed to simulate the experimental data from the incubation vials. The goal was to identify changes in biogeochemical processes triggered by resuspension and re-exposure of coastal sediments to oxic conditions. The model is an adaptation of the classical early diagenetic reaction transport models without considering transport processes77,78. The following mass balance equations were used to describe the changes in the concentration of solutes and solids over time:
In Eqs. 4 and 5, t is the time, Ci is the concentration of a dissolved species in µmol (cm3 solution)−1 and Si is the concentration of a solid species in g (cm3 slurry)−1. Rij corresponds to the rate of reaction j that consumes or produces species i. The model considered 12 dissolved species (O2, NO3−, NO2−, SO42−, total dissolved sulphide (TH2S), DIC, δ13C-DIC, TA, NH4+, Mn2+, Fe2+, Ca2+) and five solid species (particulate organic matter, iron (oxyhydr)oxide (Fe (OH)3), manganese oxide (MnO2), pyrite (FeS2), and calcium carbonate (CaCO3)). Details of modelled biogeochemical reactions, parameters and initial conditions can be found in the Supplement (Supplementary Tables 6 to 11).
Solid species contents (Sm) measured in dry weight % (wt.%) were converted to g (cm3 slurry)−1 using the following equation:
where mS (g) is the mass of dry solids in the suspension, Vsl (cm3) is the volume of the slurry.
The consumption of O2 in the experiments was considered by calculating the O2 partition coefficient between the headspace and slurry for the respective salinity and temperature (O2pc). The number of moles of O2 for both the initial headspace (H0) and slurry (So) were calculated using the following equations:
where P, T, and R are the pressure, temperature, and ideal gas constant, respectively. The O2 volume in the bottle headspace, Vho, was calculated from the headspace volume multiplied by 0.21. Osat is the equilibrium concentration of oxygen in seawater as a function of temperature and salinity79 and Vsl is the volume of the slurry. Hence, the partitioning coefficient can be calculated as:
The rate of change of O2 in the slurry is then equal to:
Calculated O2pc was approximately 18 for the three sites. In the model, this value was fine-tuned to provide optimum fits to the measured O2 data, resulting in values of 19, 24 and 21 for Boknis Eck, Aschau and Heiligenhafen, respectively.
Organic matter was defined with a carbon oxidation state of −0.45 instead of zero, i.e., more reduced than Redfield stoichiometry80. Thus, the stoichiometric composition is equal to ({{{{rm{C}}}}}_{106}{{{{rm{H}}}}}_{175}{{{{rm{N}}}}}_{16}{{{{rm{O}}}}}_{42}{{{{rm{P}}}}}_{{{{rm{e}}}}})81. POC in the model is sequentially remineralized by major pathways such as aerobic respiration, nitrate reduction, manganese reduction, iron reduction, and sulphate reduction. The remineralization of POC was defined using the power law proposed by Middelburg82:
where RPOC is the rate of organic matter degradation and kPOC is the time-dependent reactivity of POC. The factor fi is applied to convert between g (cm3 slurry)−1 and µmol (cm3 solution)−1, where AWC (g mol–1) is the atomic weight of carbon, and ϕ is the porosity of the slurry.
kPOC was defined following Middelburg82 as a function of time (t in yr) and the apparent initial age (a0, yr) of the POC. The initial age largely defines the reactivity (i.e., freshness) of POC and was used as a fitting parameter constrained mainly from O2, DIN and DIC concentrations in oxic experiments and from DIC, SO42− and NH4+ concentrations in anoxic experiments. For Boknis Eck, the initially oxic slurries turned anoxic after 35 days. A Boltzmann function was employed to change the a0 parameter from a low oxic value to a higher anoxic value to mimic the decline in reactivity under anoxic conditions (Supplementary Table 7). Mean kPOC values of bulk POC were calculated by averaging the modelled kPOC (Eq.13) over the relevant time interval.
The model includes a range of secondary redox reactions, including aerobic oxidation of ammonium, nitrate, iron, manganese, pyrite, and anammox. The model also considers the dissolution of calcite. Net calcite dissolution rates (RDiss) were quantified by fitting the model to the measured Ca2+ concentrations:
where Ca(left(tright)) is the simulated Ca2+ concentration and CaSAT refers to the apparent calcite saturation concentration, taken as the measured quasi-asymptotic value. The rate constant kCa was set to a large enough value to fit the model to the data.
Carbon isotope dynamics for POC remineralization and calcite dissolution at Heiligenhafen were modelled using the mass balance equation for concentrations and 13C-bearing species in DIC. Carbon isotope values (δ13C) in delta units (‰) relative to the VPDB scale (13C/12C = 0.011237) of compound i were employed in the model:
Since POC remineralization and calcite dissolution are associated with minimal fractionation, the rate of 13DIC production by these processes was modelled as:
where ({{{delta }}}^{13}{{{{rm{C}}}}}_{{{{rm{i}}}}}) is the isotopic composition of POC or calcite and R is the total DIC production rate from POC remineralization or calcite dissolution. ({{{delta }}}^{13}{{{{rm{C}}}}}_{{{{rm{CaCO}}}}3}) was set to 1‰48,49, whereas ({{{delta }}}^{13}{{{{rm{C}}}}}_{{{{rm{POC}}}}}) was constrained with the model.
TA, TH2S, and DIC (TCO2) were defined as follows:
The expression for TA ignores a small contribution of OH−. Each term on the right-hand side of Eq. (17) was replaced for an expression based on the total concentration of each weak acid, leading to:
where TB is the total boron concentration calculated as a function of salinity49. The thermodynamic equilibrium constants (K) were calculated on the total pH scale for the measured salinity and temperature following Zeebe and Wolf-Gladrow49 (Supplementary Table 9). The equation was solved for protons at each time step from the TA, DIC, TB, and TH2S concentrations (in mol kg−1 solution). Once [H+] is known, the concentration of CO32− was calculated, and hence the carbonate saturation state, ΩCa, as:
The stoichiometric solubility product of calcite (KSP) was calculated as a function of temperature, pressure and salinity according to Millero83.
After fitting the POC remineralization rate and Ca2+ and SO42− concentrations, the model systematically underestimated pH and overestimated DIC and pCO2 at all oxic sites (Supplementary Fig. 5). We suspect the discrepancy was due to CO2 degassing from the slurry during the filtering stage that required ~10 min per sample. We were able to simulate the measured DIC, pCO2, and pH by assuming that a fraction of dissolved CO2 had been degassed (fgas, Supplementary Table 10). Degassing depletes the sample in DIC and increases the pH due to readjustment of the carbonate equilibria. The TA of the solution is not affected by gas exsolution. By accounting for degassing, we achieved a good fit to the measured pH and derived DIC and pCO2. Our results suggest that between 60 and 80% of CO2 was lost during sample handling across all sites. The pH, DIC, and pCO2 model data in Figs. 1 and 2 show the adjusted model fits after correction to degassing. pCO2 in the anoxic bottles was low and little degassing occurred and no correction was required. It should be noted that CO2 degassing does not affect the robustness of the modelled biogeochemical reaction rates or conclusions of this study.
Coupled sediment and water column box model
A box model was set up to estimate the decline in atmospheric CO2 uptake induced by bottom trawling in muddy and sandy sediment ecosystems in Kiel Bight. The model considers the effect of pyrite oxidation and enhanced POC remineralization on DIC and TA concentrations in the water column and the CO2 exchange flux with the atmosphere. TA, DIC, pH, and carbonate saturation states in the box model were calculated similarly to the numerical reaction model (Eqs. 17–21). The coupled mass balance equations (ordinary differential equations) were solved using the method-of-lines approach. The model is described in Supplementary Tables 12–15.
The model considers POC deposition at the seabed, POC degradation and pyrite formation, burial of POC and pyrite, lateral water exchange with the surrounding area and CO2 exchange with the atmosphere. The CO2 exchange with the atmosphere was defined as:
where vp is the piston velocity (20 cm h−1 80), dsw is the density of seawater, [CO2]eq, is the CO2 concentration in seawater at equilibrium with the atmosphere and [CO2]sw is the CO2 concentration in seawater as calculated from TA and DIC. Given that lower TA and higher DIC waters (from trawling) are exported from the box model by lateral exchange and would, in theory, equilibrate with the atmosphere elsewhere, our model provides a minimum estimate of the impact of trawling on CO2 fluxes.
The model consists of a sediment box with a thickness of 10 cm and a pre-defined inventory of POC and pyrite stocks, coupled to an overlying water box with a thickness that corresponds to ambient water depth. The water box receives TA and DIC fluxes from the sediment and exchanges CO2 with the atmosphere (Supplementary Fig. 8). The parameter values such as water depth, salinity, temperature, porosity, burial velocity, sedimentary POC, and pyrite content are representative of the three study sites (Supplementary Table 1). The sediment column thickness of 10 cm is based on literature data regarding the average penetration depths of trawling gears (otter trawls: 2.4 cm; beam trawls: 2.7 cm) and dredging gears (towed dredges: 5.5 cm; hydraulic dredges: 16.1 cm) as reported by Hiddink et al. 84. The model simulation is designed as a two-step process, with an initial run reproducing the natural undisturbed system before resuspension, and a subsequent run that simulates the effect of bottom trawling.
To define the natural conditions before trawling, the model was run into a steady state representative of the average biogeochemical condition of each study site. The rate of POC degradation (RPocst) before trawling is simulated using a simple kinetic rate law as defined:
where kPoca is the first-order kinetic constant for POC degradation in each study site obtained from the anoxic sediment incubations, CPOC is the concentration of POC in the sediment and thsd is the thickness of the sediment layer (10 cm). The POC flux to the seafloor was set to a value reproducing the mean POC concentration measured at our study sites (Supplementary Table 12 and 14). The pyrite formation in the sediment was defined as:
The rate of pyrite formation (RPY) was coupled to the POC degradation rate and the corresponding stoichiometry coefficient (rpypoc) was tuned to reproduce the measured pyrite values (Supplementary Tables 13 and 14).
In the resuspension scenarios, the model accounts for two types of trawling events: deep trawling and shallow trawling. Deep trawling impacts the entire sediment column (10 cm) while shallow trawling affects only the upper 2 cm. Deep trawling represents the large disturbance caused by penetrating gear such as otter boards, whereas shallow trawling represents the dragging of the connecting ropes and rollers at the bottom of trawl net. The affected fractions of muddy and sandy ecosystems in the study area were determined using ICES Vessel Monitoring by Satellite (VMS) data37,38. The spatial extent of trawling activities on the seafloor and the mean annual intensity of trawling events were estimated by aggregating real-time data based on VMS up to 2022 and following the methods described in ICES Working group report 202437,38 (see Supplementary Table 2 and Supplementary Fig. 2). The resuspension model scenarios were simulated over a 10-year period. Data from 2019 to 2021 indicate that the fractional area of trawling activity in muddy sediments is limited to 0.62 of the total area, whereas in sandy sediments it is 0.51. The mean annual trawling intensity for shallow trawling is approximately 1 event per year, whereas for deep trawling, it is 0.07 events per year or about 10 times lower than for shallow trawling (Supplementary Table 2). To reflect real-time bottom trawling pressure data from the study area, we incorporated only one trawling event in the deep trawling models over the 10-year simulation period. Shallow trawling was simulated with 10 events across the same period, occurring mid-year. Each trawling event was set to last for 5 days to account for particle settling in the water column and consequent exposure to oxygen.
The surface sediment area in the resuspension model was divided into undisturbed and disturbed fractions. In the undisturbed fraction, processes continued as in the previous model step under natural conditions. In the disturbed fraction, however, the model simulated resuspension effects. For the disturbed area, the model incorporated enhanced POC remineralization, using the mean first-order kinetic constant for oxic POC remineralization determined from oxic incubations (kPOCox) (see Supplementary Table 14). Additionally, pyrite oxidation was included, applying a first-order kinetic constant (kPY) aligned with the mean pyrite oxidation rates measured during these oxic incubations. In shallow trawling scenarios, resuspension was limited to the top 2 cm, with the disturbed fraction in this layer undergoing aerobic POC degradation and pyrite oxidation. Anaerobic POC degradation and pyrite formation continued as before in the undisturbed 8 cm below this layer. POC and pyrite concentrations shown in Fig. 5 represent the mean contents in disturbed sediments averaged over the entire thickness of the sediment layer (10 cm). Benthic DIC and TA fluxes are averaged over the total area including disturbed and undisturbed regions in the resuspension models. In deep trawling scenarios, the entire 10 cm sediment column was subject to disturbance, and the fraction affected by trawling was exposed to aerobic POC degradation and pyrite oxidation over 10 cm depth.
Reporting summary
Further information on research design is available in the Nature Portfolio Reporting Summary linked to this article.
Responses