Sex differences in CYP450-based sodium dehydroacetate metabolism and its metabolites in rats

Introduction
Sodium dehydroacetate (DHA-Na) is a stable and effective preservative, commonly used in food, feed, and cosmetics1,2,3. DHA-Na is considered a safe additive when added at the dosage permitted by the World Health Organization and Food Agriculture Organization4. In China, the maximum permissible dose of DHA-Na in foods is 0.03% in fruit juices, butter, and fermented soybean products, 0.05% in bakery products and cooked meat products, and 0.1% in starch products and pickled vegetables5. However, the widespread use of DHA-Na has recently raised concerns related to the potential harm it may cause to human health. DHA-Na can induce lipid peroxidation in rat hepatocytes6, cardiovascular toxicity and a reduction in locomotor persistence in zebrafish7,8. DHA-Na can inhibit serum albumin esterase activity and cause contact dermatitis in humans9,10. A study form the China National Center for Food Safety Risk Assessment indicated that DHA-Na (62.0 and 124.0 mg/kg BW) can lead to the slight systemic toxicity in rats after a 90-day oral exposure5. Several studies have reported the pharmacokinetics of DHA-Na in tissues of animals such as pigs, chickens, and rats11,12,13. The results have indicated that DHA-Na is mainly distributed in the liver (half-life = 7.19–8.5 days) and kidneys (half-life = 5.5–9.07 days). Notably, our previous reports have demonstrated that DHA-Na induces coagulation disorders in rats and chickens by downregulating the expression of vitamin K epoxide reductase complex subunit 1(VKORC1) or VKORC1-like protein 1 (VKORC1L1)14,15,16. Du et al. 17 demonstrated that coagulation disorders induced by DHA-Na demonstrated sex differences in rats. These differences may be attributed to sex differences in DHA-Na metabolism. Chen et al. demonstrated that the DHA-Na concentration ratios in female to male rats were 1.64- to 3.21-fold in the liver, 3.09- to 4.00-fold in the lung, and 1.14- to 1.45-fold in serum during days 3 to 9 of the 200 mg/kg DHA-Na treatment12,17.
Sex differences in metabolism may result in different toxic effects between sexes, potentially leading to different recommended usage ranges. However, the underlying mechanisms of sex differences in DHA-Na metabolism remain poorly understood. Therefore, understanding sex differences in DHA-Na metabolism is useful to its rational application in food and feed, and to advancing toxicological research of DHA-Na.
The cytochrome P450 (CYP450) enzyme system is crucial in drug phase I metabolism; it includes catalyzation of oxidation, reduction, and hydrolysis of endogenous compounds (by CYP7-51) or exogenous compounds (by CYP1-4). This system is responsible for the metabolism of >55% of drugs. CYP450 has been identified as a determinant of sex differences in metabolism of drugs and chemicals, including DHA-Na, among rats and humans18,19,20,21,22. For example, tributyltin is specifically metabolized by CYP2C11 and CYP2C6 in male and female rats, respectively23. Although opioids are commonly used as the primary treatment for chronic pain, their effectiveness is often limited in women; this observation is attributable to the higher activity of CYP2D6 in women than in men24. Therefore, we speculated that the sex differences in serum DHA-Na concentrations are attributable to sex differences in CYP450 activity.
In this study, we aimed to identify CYP450 sub-enzymes mainly involved in DHA-Na metabolism and to assess the association of these sub-enzymes with sex differences in DHA-Na metabolism. To achieve this, we measured DHA-Na concentrations in the liver microsome and rat serum after co-treatment with specific CYP450 inhibitors and DHA-Na. Our results suggested that CYP1A2, CYP3A2, and CYP2D1 are involved in DHA-Na metabolism. We also observed sex differences in the expression of Cyp1a2, Cyp3a2, and Cyp2d1 genes, as well as in the activity of these sub-enzymes, which significantly contribute to DHA-Na metabolic differences. Moreover, we identified two DHA-Na metabolites and elucidated their structures. These findings provide theoretical support for sex differences in DHA-Na metabolism and its metabolites in rats.
Results
Optimization of incubation conditions for liver microsomes
We first optimized the incubation condition of a liver microsome system in vitro. Different concentrations of liver microsomes (0.25 or 0.1 mg/L) were incubated with DHA-Na (50, 100, and 167 mg/L) for different periods. According to the DHA-Na reaction degrees (Fig. S1), we utilized the 0.1 mg/L microsome system with 5.0 mg/L DHA-Na and a treatment period of 3 hours for subsequent experiments.
Inhibition of CYP450 sub-enzymes by specific inhibitors in vitro
To verify the effects of CYP450 sub-enzyme inhibitors under experimental conditions, we detected the content of relevant probe substrates after co-incubation with specific inhibitors and substrates separately through High-performance liquid chromatography (HPLC). The chromatograms for all five probe substrates are illustrated in Fig. S2. Moreover, the ranges of their standard curve equations, recovery rates, precision rates, Limits of detection (LODs), and Limits of quantification (LOQs) were presented in Table 1.
Compared with the control groups, the levels of five specific probe substrates were notably lower in the negative control male and female liver microsome groups. Moreover, the levels of five probe substrates were lower in the male liver microsome groups than in the female liver microsome groups (Fig. 1A–E). 25 μM specific inhibitors treatment considerably increased the contents of probe substrates. Specifically, metabolic rates for phenacetin, dapsone, dextromethorphan, omeprazole, and chlorzoxazone were reduced respectively by 38.21%, 42.75%, 50.52%, 9.66%, and 47.50% in the male groups and by 42.51%, 65.71%, 72.38%, 80.22%, and 70.71% in the female groups. These results indicated that at 25 μM, the specific sub-enzyme inhibitors effectively inhibited their corresponding sub-enzymes; however, the degree of inhibition differed between sexes.

A Concentrations of phenacetin after coincubation with 25 μM furafylline and 5 mg/L phenacetin. B Concentrations of dapsone after coincubation with 25 μM ketoconazole and 5 mg/L dapsone. C Concentrations of dextromethorphan after coincubation with 25 μM quinidine and 5 mg/L dextromethorphan. D Concentrations of omeprazole after coincubation with 25 μM ticlopidine and 5 mg/L omeprazole. E Concentrations of chlorzoxazone after coincubation with 25 μM chlormethiazole and 5 mg/L chlorzoxazone. **P < 0.01.
Identification of CYP450 sub-enzymes involved in DHA-Na metabolism in vitro
To identify CYP450 sub-enzymes involved in DHA-Na metabolism in vitro, we performed HPLC analysis of DHA-Na concentrations after coincubation of the liver microsome systems with 5 mg/L DHA-Na and specific sub-enzyme inhibitors for 3 h. As shown in Fig. 2A, the male and female groups treated with 5–50 μM furafylline (a CYP1A2 inhibitor) exhibited higher DHA-Na concentrations than the control groups; moreover, the differences among the male groups treated with 40 and 50 μM furafylline and among the female groups treated with 20–50 μM furafylline were significant. Furthermore, DHA-Na concentrations were higher in the female groups than in the male groups after treatment with 5–50 μM furafylline. In contrast, DHA-Na concentrations in the male group treated with 10 μM furafylline were similar to those in the female control group. As shown in Fig. 2B, DHA-Na concentrations in both female and male liver microsomes increased after treatment with 10–50 μM ketoconazole (a CYP3A2 inhibitor). Moreover, DHA-Na concentrations were higher in all the female groups than in the male groups treated with 10–50 μM ketoconazole. In contrast, DHA-Na concentrations in the male group treated with 40 μM ketoconazole were similar to those in the female control group. As shown in Fig. 2C, DHA-Na concentrations were considerably higher in the male group treated with 50 μM quinidine and female groups treated with 20–50 μM quinidine than in the control groups. As illustrated in Fig. 2D, E, CYP2C11 and CYP2E1 inhibition with ticlopidine and clomethiazole did not lead to a significant change in DHA-Na concentrations.
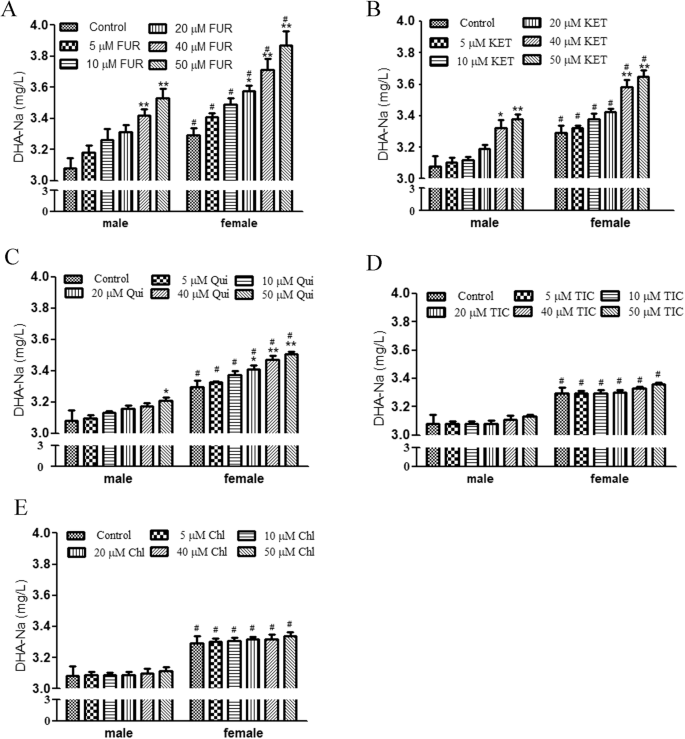
A–E Concentrations of DHA-Na after coincubation with DHA-Na and 5–50 μM furafylline (A), ketoconazole (B), quinidine (C), ticlopidine (D), or chlormethiazole (E). *P < 0.05, **P < 0.01, compared with control group. #P < 0.05, compared with male group.
Table 2 presents DHA-Na metabolism inhibition rates in liver microsomes after treatment with 20–50 μM furafylline, quinidine, quinidine, ticlopidine, or clomethiazole respectively. Our results indicated that furafylline, quinidine, and quinidine reduced DHA-Na metabolism respectively by 12.23% ± 1.96% to 23.48% ± 3.61%, 5.70% ± 0.74% to 15.40% ± 1.91%, and 4.41% ± 0.62% to 6.81% ± 0.82% in the male groups and by 16.52% ± 3.84% to 33.93% ± 3.83%, 7.62% ± 1.31% to 20.77% ± 3.72%, and 6.72% ± 1.26% to 12.42% ± 2.64% in the female groups. In all groups, ticlopidine and clomethiazole led to DHA-Na metabolism inhibition rates of <4%. In summary, CYP1A2, CYP3A2, and CYP2D1 were noted to be involved in DHA-Na metabolism in liver microsomes, with CYP1A2 and CYP3A2 playing the key roles.
Inhibition of CYP450 sub-enzymes by specific inhibitors in vivo
Table 3 shows the standard curve equations, recovery rates, precision rates, LODs, and LOQs of all five probe substrates in vivo. The ranges of all LODs and LOQs were 0.0125–0.0500 and 0.0333–0.0750 mg/L, respectively.
To evaluate the inhibitory effects of specific inhibitors on CYP450 sub-enzymes in vivo, we administered rats with one of the inhibitors over 3 days. Next, the serum concentrations of probe drugs were analyzed through HPLC 1, 2, 4, and 7 h after pore drug administration (Fig. S3). As shown in Fig. 3A–E, the serum concentrations of phenacetin 1 h after administration, as well as those of dapsone and omeprazole 1–7 h after administration, were significantly lower in the male rats than in the female rats. All rats, regardless of their sex, demonstrated a considerable increase in the serum concentration of probe substrates after specific inhibitor treatments (Fig. 3A–E), indicating the effectiveness of the inhibitors.
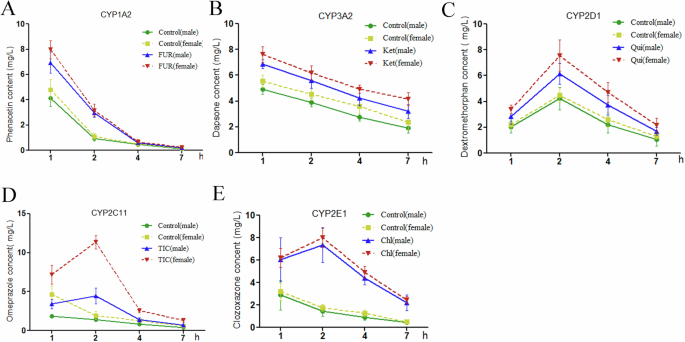
Concentration–time curves for probe substrates in rats after coadministration of (A) 5 mg/kg furafylline and 10 mg/kg phenacetin, (B) 5 mg/kg dapsone and 25 mg/kg ketoconazole, (C) 5 mg/kg dextromethorphan and 10 mg/kg quinidine, (D) 10 mg/kg omeprazole and 10 mg/kg ticlopidine co-administration. E 5 mg/kg chlorzoxazone and 25 mg/kg chlormethiazole.
Identification of CYP450 sub-enzymes involved in DHA-Na metabolism in vivo
To further elucidate DHA-Na metabolism in vivo, we detected serum DHA-Na concentrations in rats treated with specific CYP450 subenzyme inhibitors for 3 days. Figure 4 illustrates serum DHA-Na concentration–time curves after CYP450 subenzyme inhibitor administration. Treatment with 5 mg/kg furafylline, 25 mg/kg ketoconazole, or 10 mg/kg quinidine increased serum DHA-Na concentrations in the male and female rats (Fig. 4A–C). However, ticlopidine or clomethiazole treatment led to no obvious changes in serum DHA-Na concentrations (Fig. 4D, E). Furthermore, regardless of CYP450 subenzyme inhibitor treatment, serum DHA-Na concentrations remained higher in all female rats than in all male rats (Fig. 4).
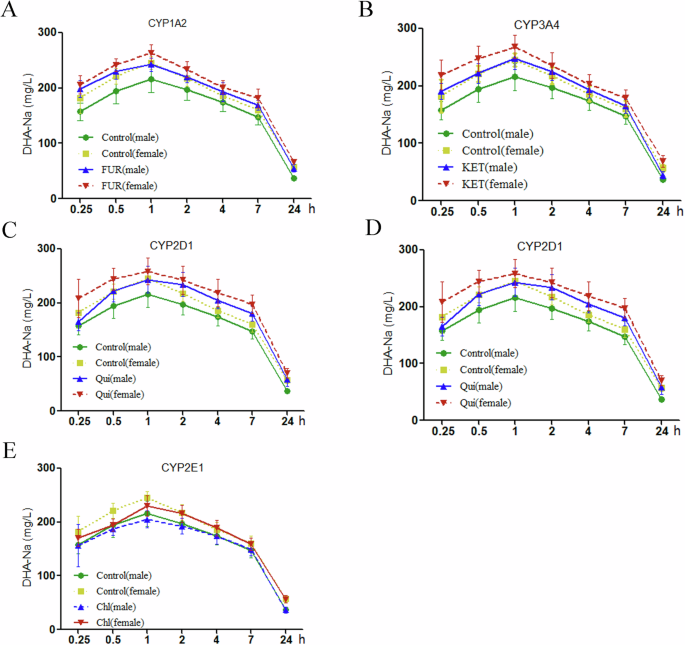
Concentration–time curves for DHA-Na after coadministration of 200 mg/kg DHA-Na and (A) 5 mg/kg furafylline, (B) 25 mg/kg ketoconazole, (C) 10 mg/kg quinidine, (D) 10 mg/kg ticlopidine, and (E) 25 mg/kg chlormethiazole.
Table 4 presents the pharmacokinetic parameters of DHA-Na in rats after specific inhibitor administration. In the control groups, the half-life (t1/2), maximum concentration (Cmax), area under the curve from 0 to the last measurable timepoint (AUC (0-t)), area under the curve from 0 to infinity (AUC (0-∞)), and mean residence time (MRT) were higher in the female rats than in the male rats. After furafylline treatment, the t1/2, Cmax, AUC (0-t), AUC (0-∞), and MRT of DHA-Na significantly increased in all treatment groups; they were higher in the female group than in the male group. Moreover, the clearance (CL) and volume of distribution (Vd) of DHA-Na decreased only in the female group. In addition, in the male group, the CL was lower than that in the control group but higher than that in the female group. After ketoconazole treatment, the Cmax, AUC(0-t), and AUC(0-∞) of DHA-Na increased considerably in all treatment groups; moreover, the t1/2 and MRT of DHA-Na increased considerably in only the female group, and the Vd and CL of DHA-Na increased considerably in only the male group. In addition, the Cmax, AUC(0-t), AUC(0-∞), t1/2, and MRT of DHA-Na were higher in the female group than in the male group. After quinidine treatment, the t1/2, Cmax, AUC(0-t), and AUC(0-∞) of DHA-Na increased, but its Vd and CL considerably decreased in all treatment groups. Moreover, the MRT of DHA-Na increased substantially in the male group. In addition, compared with the female group, the male group demonstrated higher AUC(0-t) and AUC(0-∞) but lower CL of DHA-Na. After ticlopidine treatment, the female and male groups demonstrated higher Cmax of DHA-Na, whereas only the male group demonstrated higher MRT of DHA-Na. Finally, clomethiazole treatment led to no obvious changes in the treatment and control groups. Nevertheless, the Cmax, AUC(0-t), AUC(0-∞), and MRT of DHA-Na were higher in the female group than in the male group. Taken together, these results confirmed that CYP1A2, CYP3A2, and CYP2D1 are involved mainly in DHA-Na metabolism.
Sex differences in Cyp450 expression
To investigate the reasons underlying the sex differences in the activities of sub-enzymes, we analyzed the mRNA expression of the genes encoding these sub-enzymes in male and female rats. As shown in Fig. 5A, B, Cyp1a2, Cyp3a2, Cyp2d1, and Cyp2c11 mRNA expression was significantly lower in female rats than in male rats; however, no significant difference was noted in Cyp2e1 mRNA expression between male and female rats.
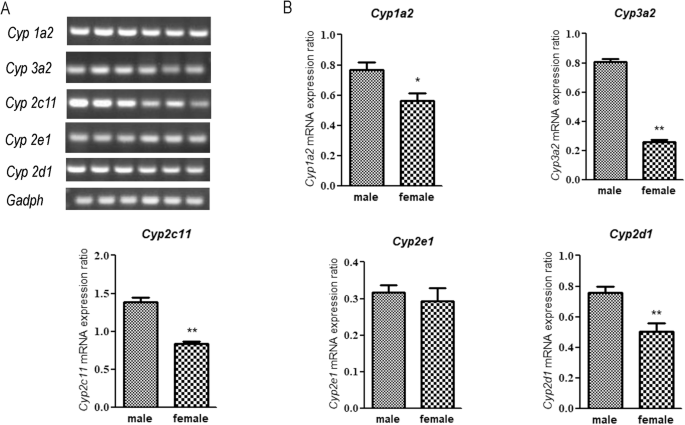
A RT-PCR products; lanes 1–3 and 4–6 contain male and female rat samples, respectively. B Relative expression of all five CYP450 sub-enzymes. *P < 0.05, **P < 0.01.
DHA-Na metabolites in rats
Two peaks, M1 and M2, were observed in the DHA-Na chromatograms of rat serum at approximately 3 min. As illustrated in Fig. S4, the peak heights of both M1 and M2 increased over time. Although no relevant data are available, we speculated that these peaks corresponded to DHA-Na metabolites. To identify these two substances, rat sera treated with DHA-Na were assessed through liquid chromatography–mass spectrometry (LC/MS). The LC/MS total ion chromatograms of DHA-Na and its metabolites are presented in Fig. 6A–D. In particular, the accurate mass spectra of DHA-Na and its metabolites were recorded and examined for characteristic product ions. As depicted in Fig. 6C, D, product ions m/z 167.0354 were identified as DHA-Na, and the product ions m/z 183.0288 and 139.0401 were defined as M1 and M2, respectively. To elucidate M1 and M2 structures, we performed secondary mass spectrometry. As shown in Fig. 7A–C, the secondary mass spectra demonstrated that product ions m/z 107.0482 and 83.0132 were identified as M1 fragment ions. Based on the tandem mass spectrometry database, the structure of M1 was elucidated to correspond to C8H7O5, whereas the structure of M2, a monoderivative product of M1, was elucidated to correspond to C6H5O3N (Fig. 7B). As shown in Fig. 7C, we identified N1 (m/z 107.0482) to be a fragment ion formed via the elimination of one acetyl and one ketone group from M1 and N2 (m/z = 83.0132) to be formed as a fragment ion formed via the elimination of oxygen and one methyl group from the N1 pyran ring.
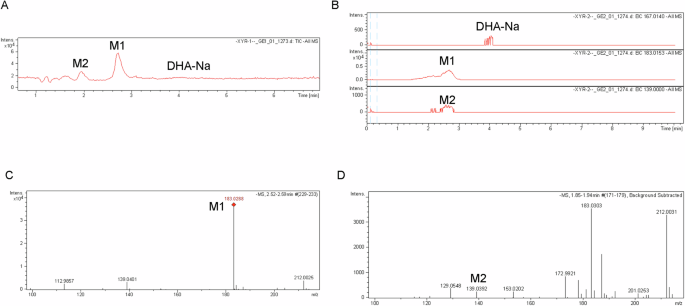
A, B Total ion current (A) and selective ion flow (B) patterns of DHA-Na and its metabolites M1 and M2. C Internal mass spectrograms of M1 (2.61–2.72 min; C) and M2 (1.85–1.94 min; D).
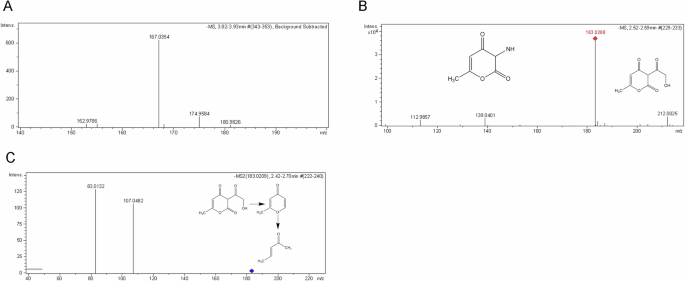
A, B Mass spectra of DHA-Na (A) and its metabolites M1 and M2 (B). C Secondary mass spectra of metabolite M1.
Discussion
We previously reported that DHA-Na induces coagulation disorders more frequently in female rats than in male rats12,16. This difference may be attributable to variations in DHA-Na metabolism between the two sexes12. CYP450 is a determinant of sex difference in drug metabolism in rats18; however, CYP450 sub-enzymes involved in DHA-Na metabolism in rats and relevant sex differences in the metabolic process remain unclear.
In the current study, we determined that CYP1A2, CYP3A2, and CYP2D1 are the major CYP450 sub-enzymes involved in DHA-Na metabolism by using specific inhibitors of the sub-enzymes. Our findings also suggested sex differences in these sub-enzyme activities and expression after DHA-Na exposure are the primary contributing factors to the sex differences in DHA-Na metabolism.
We first evaluated the recovery rates, coefficients of variation, LODs, and LOQs of our established HPLC-based method for probe substrates and DHA-Na from both in vivo and in vitro samples. For all drugs, the RSDs, recovery rates, LODs, and LOQs were <9%, >85%, >0.0500 mg/L, and >0.0900 mg/L, respectively, indicating the reliability of our established method along with its suitability for quantitative analysis. Next, we optimized the concentrations of specific inhibitors of CYP450 sub-enzymes in liver microsomes and rats by considering previous results25,26,27,28. In all groups, the CYP450 inhibition rates of all CYP450 sub-enzyme inhibitors were >40% at a concentration of 25 μM, with the highest rate being 80.22%.
We previously reported serum DHA-Na concentrations demonstrate sex differences in rats. A similar phenomenon was also observed in the current in vitro results. In particular, liver microsome DHA-Na concentrations were lower in the male samples than in the female samples (3.081 ± 0.198 vs. 3.294 ± 0.111 mg/L). Therefore, the sex differences in DHA-Na metabolism are primarily attributable to CYP450. This is in contrast to the observations for some other drugs, for which absorption and excretion are the key factors affecting drug concentrations in the body and contribute to sex differences in their blood levels29. After CYP1A2, CYP3A2, and CYP2D1 inhibition using specific inhibitors at a concentration of 50 μm, the metabolic rate for DHA-Na decreased respectively by 23.48%, 15.40%, and 6.81% in male liver microsomes and by 33.93%, 20.77%, and 12.42% in female liver microsomes; similar results were observed in rat sera after in vivo treatment. Therefore, CYP1A2, CYP3A2, and CYP2D1 are major enzymes involved in DHA-Na metabolism. Several studies have reported that CYP1A2 activity is higher in male or male rats than in female or female rats30,31. Liu et al. 32 analyzed sex differences in triptolide metabolism by using monoclonal antibodies to inhibit CYP3A2 activity and suggested that CYP3A2 is a male-predominant enzyme. In the present study, we also noted that CYP1A2, CYP3A2, and CYP2D1 expression was higher in male rats than in female rats, partly suggesting the reason that CYP450 sub-enzymes are male-predominant. In addition, after CYP1A2 or CYP3A2 was inhibited in male rats and their liver microsomes at an appropriate degree, their microsome and serum DHA-Na concentrations became similar to those noted in their female counterparts. As such, CYP12A and CYP3A2 may play major roles in DHA-Na metabolism, and CYP1A2 or CYP3A2 regulation may alleviate the sex differences in DHA-Na metabolism. This result is corroborated by another study reporting that DHA-Na effectively inhibits CYP1A2 and CYP3A2 activity, with the inhibition being more pronounced in female rats than in male rats, further amplifying sex differences in DHA-Na metabolism. However, we were not to study whether additional sub-enzymes contribute to the metabolism of DHA-Na or whether sex metabolism differences of DHA-Na. The results obtained now may be affected because the sub-enzymes activity were not fully inhibited by specific inhibitor selected. Furthermore, the blood concentration of exogenous compounds is affected by the processes of absorption, distribution, metabolism, and excretion; therefore, we cannot dismiss the possibility that absorption, distribution and excretion may contribute to the observed sex metabolism differences in serum content of DHA-Na.
Although some studies have reported the pharmacokinetics of DHA-Na, DHA-Na metabolites in vivo have not been identified thus far. Here, we identified two DHA-Na metabolites, 3-glycology-6-methyl-2,3-dihydropyran-2,4-dione and 3-imino-6-methyl-2,3-dihydropyran-2,4-dione, in our rat serum samples. However, we did not detect any DHA-Na metabolite in the rat liver microsome samples. This may be because although hydroxylation of the acetyl moiety does not occur commonly, an equivalent reaction can occur through the action of 21-hydroxylase, which plays a key role in steroid metabolism (i.e., progesterone to 11-deoxycorticosterone conversion).
In summary, this study has shown that CYP1A2, CYP3A2, and CYP2D1 are involved in DHA-Na metabolism in rats. The observed sex differences in DHA-Na metabolism can primarily be attributed to difference in the activities of CYP1A2, CYP3A2, and CYP2D1 between males and females. Moreover, their DHA-Na metabolites include 3-glycoloyl-6-methy-2,3-dihydropyran-2,4-dione and 3-imino-6-methyl-2,3-dihydropran-2,4-dione. Further study could evaluate whether the differences in DHA-Na metabolism attributable to sex differences in CYP450 sub-enzymes are the primary factors contributing to the observed sex differences in blood coagulation.
Materials and methods
Experimental model and ethical approval
Rat liver microsomes (male: LM-DS-02 M and female: LM-DS-02 F) with a protein concentration of 20 mg/mL were provided by Shanghai Rui De Liver Disease Research Co., LTD. Wistar rats were provided by the Comparative Medical Center of Yangzhou University. When the experiments were completed, rats were killed by asphyxiation in a vessel filled with carbon dioxide. All animal experiments were supervised by the Animal Ethics Committee of Yangzhou University and performed according to the EU Directive 2010/63/EU for animal experiments and the Regulations for the Administration of Affairs Concerning Experimental Animals in China.
Chemicals
We procured DHA-Na (D806413) and ketoconazole (C12650322) from Shanghai Macklin Bio-Chemical Technology Co., LTD. Quinidine (12004158), dapsone (D105858), phenacetin (P109420), omeprazole (C1920101), ticlopidine (T303965), and dextromethorphan (B300455) were purchased from Shanghai Aladdin Corporation. Clomethiazole (IC7490) and chlorzoxazone (IC0690) were purchased from Beijing Solaibao Technology Co., LTD.
Study design
The study design is shown in Fig. 8. Step 1: liver microsomes and rats were co-treated with specific inhibitors and substrates of CYP sub-enzymes, followed by HPLC analysis to measure substrate concentrations, thereby confirming the experimental conditions. Step 2: CYP sub-enzyme specific inhibitors were co-treated with DHA-Na both in vitro and in vivo. HPLC was employed to assess the concentration of DHA-Na, aiming to identify the CYP450 sub-enzymes predominantly involved in DHA-Na metabolism. The differences in the activity or expression of sub-enzymes involved in the metabolism of DHA-Na between males and females were analyzed. In addition, the metabolites of DHA-Na were characterized using liquid chromatography-mass spectrometry.
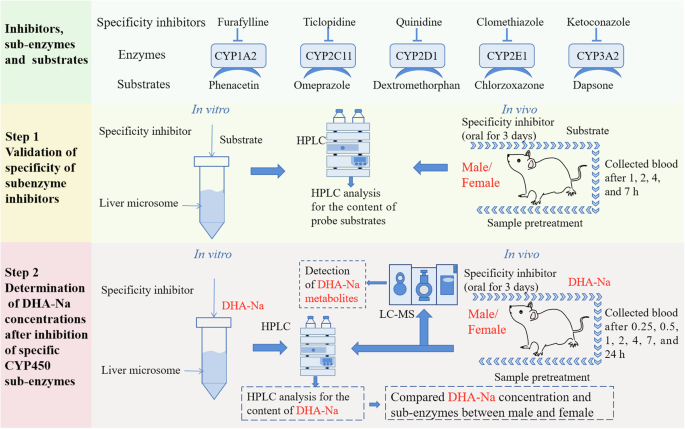
Correspondence between inhibitors, sub-enzymes, and probe substrates. Step 1: Validation of specificity of sub-enzyme inhibitors in vitro and in vivo. Step 2: Determination of DHA-Na concentrations after inhibition of specific CYP450 sub-enzymes.
Optimization of liver microsomal reaction system
To determine the appropriate incubation conditions, we optimized liver microsome and DHA-Na concentrations and incubation times. In brief, DHA-Na (167, 100, 20, 5.0, and 2.5 mg/L) were incubated with liver microsomes (0.25 or 0.1 mg/L), 0.01 M phosphate buffer, and 1.0 mM NADPH. The incubation period ranged from 0.5 to 24 h, with a total reaction volume of 200 μL. After incubation, the mixture was placed on ice for 15 min and then centrifuged at 4 °C at 12,000 rpm for 10 min. The supernatant was filtered through a 0.22-μm filter membrane and then used for high-performance liquid chromatography (HPLC) analysis.
Inhibition of specific CYP450 sub-enzymes in liver microsomes
The optimized liver microsome system was incubated with five specific CYP450 subenzyme inhibitors (final concentration = 25 μM) separately at 37 °C for 5 min, followed by the addition of 5.0 mg/L specific probe substrates and 1.0 mM NADPH and incubation for 3 h. The following inhibitors were used: furafylline (CYP1A2 inhibitor)33, ketoconazole (CYP3A2 inhibitor)34, quinidine (CYP2D1 inhibitor)35, ticlopidine (CYP2C11 inhibitor), and clomethiazole (CYP2E1 inhibitor)36. Moreover, the following probe substrates were used: phenacetin (CYP1A2 substrate)37, dapsone (CYP3A2 substrate)38, dextromethorphan (CYP2D1 substrate)39, omeprazole (CYP2C11 substrate)40, and chlorzoxazone (CYP2E1 substrate)39. After centrifugation and filtration, the supernatant was used for HPLC analysis.
Inhibition of specific CYP450 sub-enzymes in rats
72 Wistar rats (half male and half female) were randomly divided into six groups and administered a specific CYP450 sub-enzyme inhibitor through gavage consecutively for 3 days. The concentrations of the inhibitors are as follows: 5 mg/kg for furafylline, 25 mg/kg for ketoconazole, 10 mg/kg for quinidine, 10 mg/kg for ticlopidine, and 25 mg/kg for clomethiazole. Next, the rats were administered relevant specific probe substrate. After 1, 2, 4, and 7 h, we collected blood from the jugular vein, allowed it to stand at 4 °C for 1 h, and centrifuged at 3500 rpm for 10 min to obtain serum.
HPLC analysis for probe substrates
We used HPLC to detect the presence of five probe substrates in our samples. The liver microsome system supernatants (i.e., the in vitro samples) were used directly. All rat serum samples were pretreated before HPLC. 100 μL of acetonitrile was added to 20 μL of a serum sample. The mixture was swirled for 3 min, subjected to ultrasonic shock for 10 min, and then centrifuged at 12,000 rpm for 15 min. The supernatant was collected, and the precipitate was extracted again using 100 μL of acetonitrile. After combining the supernatants from the two extractions, nitrogen gas was used to evaporate the supernatant until dry. The resulting residue was then dissolved in the mobile phase for HPLC analysis12.
For HPLC, we injected 20 μL of a sample into an Agilent 1200 HPLC instrument equipped with an Agilent C18 chromatographic column (4.6 × 250 mm, 5 μm) and analyzed it at 35 °C. We used 0.01 M phosphate buffer in acetonitrile as the mobile phase at a flow rate of 1.0 mL/min. The ratios of the mobile phases and detection wavelengths for the in vitro samples were respectively 35:65 (v/v) and 293 nm for dapsone, 30:70 (v/v) and 245 nm for phenacetin, 45:55 (v/v) and 302 nm for omeprazole, 45:55 (v/v) and 280 nm for chlorzoxazone, and 5:55 (v/v) and 280 nm for dextromethorphan. HPLC detection conditions used for the serum samples have been described elsewhere12.
The standard HPLC curves of all five probe substrates were also prepared in the following range: 6.0, 4.0, 2.0, 1.0, 0.5, 0.25, and 0.1 mg/L. A recovery experiment was performed using control microsomes and plasma, with the concentrations of all five probe substrates being 4.0, 2.0, and 1.0 mg/L. The limits of detection (LODs) and limits of quantification (LOQs) were calculated three and ten times the signal-to-noise ratio (S/N), respectively.
Determination of DHA-Na concentrations after inhibition of specific CYP450 sub-enzymes
For in vitro sample analysis, 5.0 mg/L DHA-Na was added to the 0.1 mg/L microsome systems containing each of the CYP450 sub-enzyme inhibitors at a final concentration of 50, 40, 20, 10, or 5 μM, followed by incubation at 37 °C for 3 h. The systems were then placed on ice for 15 min. After centrifugation and filtration, the supernatant was analyzed through HPLC.
For in vivo sample analysis, after they were treated with the CYP450 sub-enzyme inhibitors for 3 days, the rats were administered 200 mg/kg DHA-Na intragastrically. Their blood samples were collected from their neck veins 0.25, 0.5, 1, 2, 4, 7, and 24 h after administration. Next, the serum was separated, processed, and assessed through HPLC, as described previously.
For HPLC, we utilized an Agilent C18 column (4.6 × 250 mm, 5 μm) at 35 °C. The mobile phase consisted of a mixture of methanol and 0.02 mol/L ammonium acetate (pH 4.0–4.5, adjusted with phosphoric acid) in a ratio of 35:65 (v/v). The flow rate was set at 1.0 mL/min, with an injection volume of 20 μL and a detection wavelength of 293 nm. For in vitro sample analysis, the standard curve equations for DHA-Na were y = 45.12× + 122.54 at concentrations of 25–400 mg/L (R2 = 0.9998) and y = 49.636× + 7.5338 at concentrations of 0.1–20 mg/L (R2 = 0.9996), where y is the Na-DHA chromatographic peak area and x is the Na-DHA concentration (mg/L). For in vivo sample analysis, the standard curve for DHA-Na was y = 53.659× + 5.997 at concentrations of 1–30 mg/L (R2 = 0.9998). Precision and recovery rates were evaluated through the addition of standard DHA-Na solutions into the control samples. The LODs and LOQs were calculated as three and ten times the S/N, respectively. The pharmacokinetic parameters of DHA-Na in rats were analyzed using DAS (version 2.0).
Determination of Cyp450 mRNA through reverse transcription polymerase chain reaction
RNA was extracted from the liver tissues of male and female rats by using the FastPure Cell/Tissue Total RNA Isolation Kit V2 (RC112-01). Subsequently, cDNA was synthesized using the HiScript 1st Strand cDNA Synthesis Kit. The Cyp450 primers (Table 5) were designed using Primer Premier 5 and synthesized by Shanghai Shenggong Company. The reverse transcription polymerase chain reaction (RT-PCR) was performed using 2× Taq Master Mix kit. All samples were electrophoretically separated on 1% agarose gel and then detected using Bio-Rad’s chemiluminescence detection system. Finally, Image J was used for band analyses.
Detection of DHA-Na metabolites in rat sera through liquid chromatography–mass spectrometry
Here, we used sample processing methods identical to those indicated for the HPLC sample processing method described above. Next, we used the U300 HPLC instrument (Dianne) and maXis ultra-high resolution four-pole time-of-flight series mass spectrometer to detect analytes. The chromatographic separation was performed using an Agilent C18 column (150 mm, 5 μm) at 35 °C. The mobile phase consisted of a 35:65 (v/v) mixture of methanol and 2 mM ammonium acetate (pH 5.1–5.3), delivered at a flow rate of 0.2 mL/min. Two metabolites were analyzed at an electrospray ionization (ESI) interface in the negative ion mode. The parameters for the electrospray ionization (ESI) source: a mass resolution exceeding 45,000, a spray voltage set at 4.5 kV, a collision voltage of 150 V, an atomizing gas flow rate of 15 L/min, and a dry gas flow rate of 3 L/min. All mass spectra for precursor and product ions were acquired at m/z 20–500 and 50–1250, respectively.
Statistical analysis
All data were statistically analyzed using SPSS (version 17), and they are expressed as means ± standard errors of the means. One-way analysis of variance was used to assess the significance of the differences, and a value of P < 0.05 (*) and P < 0.01 (**) and was considered to indicate statistical significance.


Responses