Non-linear development in statistical learning of visual orthographic regularities

Introduction
Humans are able to implicitly extract and encode events with different aspects of regularities and predictabilities from the environment throughout their lifespan1. This general-purpose ability refers to statistical learning2. In the last three decades, one of the most critical issues in this field concerns the extent to which age influences individuals’ capacity for statistical learning3. A central aspect of this inquiry is whether there exists a qualitative developmental change in acquiring regularities from input that significantly enhances or limits the capacity for statistical learning4. This study particularly focuses on the developmental role of statistical learning in children’s orthographic pattern learning, which involves acquiring knowledge about the written forms of a language5. Learning orthography involves integrating three fundamental elements—orthographic, phonological, and semantic representations—and their connections, which are crucial for word reading and recognition6. To examine the developmental pattern of statistical learning concerning visual orthographic regularities, we recruited participants from a broad age spectrum, ranging from 4 to 12 years and early adulthood.
Three theoretical perspectives have been proposed to discuss the question of whether age affects the development of statistical learning. The first perspective posits that statistical learning is age-invariant, based on the premise that it operates through a mechanism similar to that of implicit learning, which is considered to remain relatively stable across developmental stages7,8. The second perspective suggests that statistical learning enhances progressively with age9,10. The third perspective posits that advancements in statistical learning may be modality-specific and stimuli-dependent, especially when processing statistical patterns with linguistic attributes11,12. Specifically, the maturation of statistical learning abilities may occur at different developmental stages for visual and auditory linguistic and non-linguistic inputs, after which the abilities stabilize and persist into adulthood13. For example, auditory linguistic statistical learning shows a qualitative change around age 6 and remains stable until late childhood at age 1211. In contrast, auditory non-linguistic statistical learning improves continuously from ages 5 to 1212. Forest et al.14 suggest two possible interpretations for the lack of developmental change in auditory linguistic statistical learning: (1) pre-existing experience with linguistic stimuli, in contrast to non-linguistic input, and (2) maturation of cognitive control networks, particularly the prefrontal cortex and the anterior cingulate cortex15. Thiessen et al.4 offer an alternative explanation, suggesting that the developmental change may be driven by the interplay between three key factors: (1) the maturation of cognitive mechanisms underlying statistical learning, (2) differences in statistical inputs, and (3) children’s pre-existing linguistic experiences.
Increasing studies have explored the development of statistical learning in the linguistic domain at various ages, but the conclusions remain inconsistent. For example, in a cross-situational word learning experiment, Fitneva and Christiansen16 manipulated the co-occurrence probability of initial accuracy (IA) in figure-pseudoword pairs into levels of high (60% accurate pairs) and low (40% accurate pairs). They found a qualitative developmental change across three age groups including 4-year-olds, 10-year-olds, and adults. The 4-year-olds performed more accurately in the high IA than low IA. In contrast, adults showed greater accuracy with the low IA pairings than the high IA level, while the 10-year-olds did not exhibit a significant difference in performance related to the high and low IA. Similarly, Samara and Caravolas17 demonstrated that in a graphotactic learning task, both 7-year-old children and adults exhibited sensitivity to the positional regularity of letters such as specific consonants appearing only at the beginning of a pseudoword. They also reported a developmental progression, as reflected in slower response time for children than adults, when differentiating between items that conformed to legal versus illegal positional regularities. Similar findings have also been reported in the domain of auditory statistical learning. For example, Soares et al.18 reported that 5-year-old children struggled to acquire regularities embedded in auditory trisyllables. They observed that young adults outperformed 5-year-olds in detecting regularities associated with low transitional probability, yet the performances were not significant between adults and 5-year-old children in the condition of high transitional probability.
The findings from the above studies collectively suggest that the statistical learning of linguistic regularities may improve with age. However, findings from some other studies suggest that statistical learning is age-independent with early maturation19. For example, Singh et al.20 found that both 6–7-year-olds and adults successfully and unconsciously extracted graphotactic regularities after visual exposure to written structures without phonological counterparts, which indicates a potential lack of significant developmental progression in statistical learning of co-occurrence probabilities in visual graphotactic patterns. A similar developmental trend has been observed in the speech segmentation domain. For example, Moreau et al.21 found that both children (ages 8–12) and adults exhibited robust statistical learning ability in detecting syllable patterns with high transitional probability, as measured by both behavioral performance and neural entrainment. Nevertheless, given that the findings were inconsistent in the comparison between children and adults, the influence of age on the developmental trajectory of linguistic statistical learning remains a subject of ongoing debate.
It is important to note that the aforementioned studies have primarily focused on comparing children of a specific age group with adults to investigate the developmental changes in linguistic statistical learning. To date, only two studies have explored the developmental change of acquiring statistical regularities embedded in linguistic structures across a large-scale age range11,22. Raviv and Arnon11 specifically manipulated transitional probabilities (TP) within tri-syllabic words to high (TP = 1 within a word) and low (TP = 0.25 between words) levels. To assess the impact of these manipulations, they employed an auditory statistical learning task among children aged 5–12 years. The authors found that children older than 6 years were able to acoustically discriminate tri-syllabic words with higher TP between syllables. However, this ability did not show significant improvement in the children aged from 6.5 to 12 years. In another study, Pacton et al.22 investigated the developmental change in implicit acquisition of visual orthographic regularities in children aged 7–11 years, using a nonword judgment task that manipulated the rule of consonant doubling. The authors reported that children were sensitive to recognizing permissible consonant doubling in nonwords, indicating their implicit learning of consonant duplication frequencies within practical contexts. Notably, children aged 6–7 years could recognize the illegal doubled consonants and this ability improved drastically from 6–7-year-olds to 7–8-year-olds. However, the developmental progression in this skill plateaued from the ages of 7–8 years to 10–11 years.
The study by Pacton et al.22 provided important insights into the developmental patterns of linguistic implicit learning in the visual domain, as their employed orthographic regularities and patterns represent the visual written forms of language. However, their method—measuring children’s ability to learn regularities through a recognition task—depended substantially on the children’s pre-existing orthographic knowledge rather than on a direct assessment of their statistical learning capabilities. Thus, it still remains unclear whether the observed developmental changes and the critical period identified pertain specifically to statistical learning of visual linguistic inputs. Moreover, the developmental trajectory of orthographic regularity acquisition in childhood has not been fully examined, partly due to an underestimation of younger children’s ability to detect these regularities at the kindergarten level. Recent studies indicate that kindergartners aged 4–6 years begin to develop the ability to learn orthographic regularities and patterns, even before formal reading and writing instruction in school23,24. On the other hand, certain critical developmental periods in linguistic statistical learning warrant investigation. For example, there are qualitative developmental changes in cross-situational word learning among 4-year-olds, 10-year-olds, and adults16, as well as a critical period around age 6 for the development of auditory statistical learning of conditional linguistic regularities11. Therefore, this study used a large-scale cross-sectional examination of statistical learning related to Chinese orthographic regularities, encompassing age groups from childhood (ages 4–12) and adulthood.
Unlike the syllabic words in alphabetic orthographies, Chinese characters have individual square structures containing radicals and patterns with orthographic, phonological, and semantic representations25. The numerous distributional statistical regularities in Chinese orthography stem from the frequency, regularity, and consistency of these representations and their mappings within a character26,27. Taking radical positional consistency (i.e., the frequency of a specific radical occurring at a given position within characters), for example, the radical 目is contained in 72 Chinese characters in a corpus of 4808 characters28, 40 of which are located at the left side with 55.56% consistency (e.g., 盯, 盹, 盼, 眩, 眠, 眨), 18 located at the bottom side with 25% consistency (e.g., 冒, 盲, 省, 看, 盾, 眷), 6 located at the right side with 8.33% consistency (e.g., 相, 想, 箱, 廂, 湘, 霜), and 4 located at the middle position with 5.56% consistency (e.g., 渺, 算, 篡, 纂). The distributional information embedded within Chinese orthography offers a valuable lens through which to investigate the ways in which learners utilize visual statistical information to acquire Chinese orthographic patterns26,29.
The current study investigates the developmental patterns of statistical learning for Chinese orthographic regularities using an artificial orthographic learning paradigm adapted from previous research26. The artificial orthographic paradigm allows us to control for the confounding effects of prior learning experiences on the orthographic learning process. This approach ensures that any observed changes in learning are due to the experimental conditions rather than external factors, providing clearer insights into how statistical information affects the acquisition of orthographic patterns. We examined regularities embedded in pseudocharacters with high (100%), moderate (80%), and low (60%) positional consistency. Positional consistency is a pure visual orthographic regularity that characterizes the distribution of the positions of a specific Chinese radical. By manipulating these three consistency levels in artificial pseudocharacters, we aimed to mirror the positional regularities found in authentic Chinese characters. For example, the radical 月appears in 100 characters, 76 of which are situated on the left side (e.g., 肋, 肌, 肝, 腿, 膜) with ~80% positional consistency (76%). We included participants of different ages, from young kids aged 4–12, as well as young adults. This wide range helps us get a full picture of how the ability to learn visual language patterns changes as people grow up.
There might be three possibilities based on the three theoretical perspectives discussed above. First, under the assumption that statistical learning ability is age-invariant, it can be expected no significant interaction between consistency level and age. That is, all age groups should exhibit a similar pattern in orthographic regularity acquisition with better performance at the high than both the moderate and low levels. Second, if the statistical learning ability is enhanced with age, there should be a significant interaction between consistency level and age. This could manifest as increasing performance differences between high and low levels from kindergarten to adults. Finally, if statistical learning is age-related and subject to a critical period in childhood, we would anticipate that age would impact distributional statistical learning abilities only up to a certain age—specifically before the 7–8-year age range—with performance stabilizing from the ages of 7–8 years onwards into adulthood.
Results
One-sample t-tests and mixed ANOVA analyses
Table 1 displays the results of response time and accuracy rate by age group in the learning phase and recognition test. One-sample t-tests indicated that the overall mean response accuracy rates for K2 to adult groups in the learning phase were higher than chance level (i.e., 50%) (ts > 3.16, ps < 0.01, Cohen’s ds > 0.49), except for K1 group, which was marginally higher than chance level (t(39) = 1.80, p = 0.079, Cohen’s d = 0.285). This indicated that participants paid attention to the pseudocharacters during the learning process.
The overall mean accuracy rates in the recognition phase were also significantly larger than chance level (ts > 3.35, ps < 0.01, Cohen’s ds > 0.52). Additionally, for the age groups from K2 to adult, the mean accuracy rates for three consistency conditions were significantly higher than the chance level (ps < 0.01). The mean accuracy rates for high and moderate-consistency levels were significantly higher than the chance level for K1 children (ps < 0.05). These results suggested that participants from K2 to adult acquired different levels of positional regularities, while K1 children could merely extract positional regularities at high and moderate levels.
Figures 1a, b show the mean accuracy rates by age group and the mean accuracy rates by consistency in the recognition test, respectively. For response accuracy in the recognition test, the results of mixed ANOVA analysis revealed that the interaction between consistency and age group was marginally significant (F(16, 600) = 1.52, p = 0.086, ({eta }_{p}^{2}) = 0.039). The simple effects analyses indicated that the consistency effects were significant in each group (ps < 0.05). The post-hoc analyses with Tukey’s HSD correction suggested that participants performed more accurately for high-consistency condition than moderate and low consistency conditions from K2 to adult (ps < 0.05), while K1 children performed more accurately only for high versus low conditions (p = 0.039) but did not for high versus moderate condition (p = 0.060). The results indicated that K1 children’s capacity of statistical learning ability to acquire orthographic regularity is worse than other age groups, K1 children were not sensitive to differentiating items with positional consistency between high (100%) and moderate (80%) levels.

a Mean accuracy rates in the recognition test by consistency conditions. Error bars represent the standard errors of mean accuracy rates for three conditions among all participants. b Mean accuracy rates in the recognition test by age groups. Error bars represent the standard errors of mean accuracy rates across all age groups. †p < 0.1, *p < 0.05, **p < 0.01, ***p < 0.001.
Additionally, the main effect of consistency level was significant (F(2, 600) = 124.04, p < 0.001, ({eta }_{p}^{2}) = 0.293). The post-hoc analysis with Tukey’s HSD correction showed that participants responded more accurately for high condition than for moderate and low conditions (ps < 0.001), but no significant difference was between moderate and low conditions (p = 0.116). The result revealed that all participants were able to differentiate items between high and moderate levels, as well as between high and low levels in the recognition test. However, participants may have difficulty distinguishing the difference in regularities between moderate and low levels. The main effect of age group was also significant (F(8, 300) = 4.45, p < 0.001, ({eta }_{p}^{2}) = 0.106). The post-hoc analysis with Tukey’s HSD correction showed that participants from P1 to adult groups responded more accurately than K1 children (ps < 0.05). The results suggested that the ability to acquire positional regularity for children from P1 to P5 and adults was better than for K1 children.
The developmental trajectory model
Given that the pattern of statistical learning in K1 children differs from that in other age groups, we performed a power function model to predict the performance of acquiring different positional consistencies in each group.
Figure 2a shows the developmental trajectory models of statistical learning of positional consistency for different levels by fitting three power function curves for each consistency condition across age groups. Specifically, the model can account for more than 18.00% variance of the accuracy rates across all age groups (R2: 70.42% for the high-consistency level, 59.71% for the moderate-consistency level, and 18.00% for the low-consistency level). Chi-square test showed that the power function with positive exponent parameters (n = 0.096, 0.058, and 0.025 in the high, moderate, and low consistencies, respectively) and positive coefficients (k = 0.642, 0.553, and 0.562 in the high, moderate, and low consistencies, respectively) well predicted the participants’ data in the high ((chi)2(7) = 0.28, p = 1.0, AICc = −26.31, BICc = −27.51), moderate ((chi)2(7) = 0.17, p = 1.0, AICc = −34.94, BICc = −36.15), and low ((chi)2(7) = 0.19, p = 1.0, AICc = −33.32, BICc = −34.53) consistency levels. This indicated that the predicted model fits closely with the actual mean accuracy rates for each age group across the three consistency conditions, indicating a good fit for all three models.
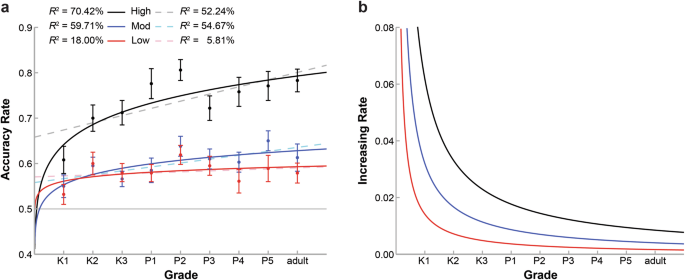
a The three solid curves indicate the developmental trajectory for three consistency levels fitted by the power function model. The three dashed lines indicate the developmental trajectory fitted by the linear model. Error bars represent the standard errors of mean accuracy rates for each consistency level across all age groups. b The three curves indicate the first derivatives of the three power function models, meaning the increasing rates for three consistency levels.
Importantly, the 95% CIs of ns were [0.038 0.155], [0.015 0.101], and [−0.023 0.073], for high, moderate, and low consistency levels, respectively. The value of zero fell outside of the 95% CIs for the high and moderate levels, indicating that the developmental differences in learning from K1 to adults were significant for items with high and moderate consistency levels.
Next, permutation tests were conducted to examine whether the developmental patterns of three consistency levels were significantly different. The results showed significant differences in ns between the high and moderate, high and low, and moderate and low consistency levels (all ps < 0.001, Bonferroni corrected). This indicates that the development of acquiring positional regularity in the high-consistency level was more rapid than that in either moderate or low levels, and the acquisition of moderate positional consistency developed more rapidly than that of the low-consistency level.
Figure 2b displays the increasing rates for three consistency levels across K1 to adults based on the first derivative of the power function model. It clearly shows that distributional statistical learning improves significantly between K1 and K2 groups, and then continues to show improvement at a steady rate from K2 children to adults.
Additionally, we implemented a linear model to investigate which type of model could better fit the developmental trajectory of statistical learning of positional consistency. As shown in Fig. 2a, the linear model can account for more than 5.81% variance of the accuracy rates across all age groups (R2: 52.24% for the high-consistency level, 54.67% for the moderate-consistency level, and 5.81% for the low-consistency level). Chi-square test showed that the linear models also well predicted the participants’ data in the high ((chi)2(7) = 0.35, p = 1.0, AICc = −21.99, BICc = −23.20), moderate ((chi)2(7) = 0.18, p = 1.0, AICc = −33.88, BICc = −35.09), and low ((chi)2(7) = 0.20, p = 1.0, AICc = −32.07, BICc = −33.28) consistency levels. However, the AICc and BICc for each consistency level in the linear model were all higher than those in the power function, indicating that the power function performs better in explaining the data than the linear function.
Discussion
We employed an artificial orthographic learning paradigm and developed a power model to investigate the developmental trajectory of statistical learning of orthographic regularity in children aged 4–12 years and adults. We found that visual linguistic statistical learning is age-dependent in early childhood, with an overt developmental change occurring from K1 to K2 children (i.e., ages 4–5 to 5–6 years). Beyond this period, the enhancement of distributional statistical learning abilities continues to progress into adulthood, despite a decelerating rate of improvement. Moreover, our results revealed that the 4–5-year-old children are sensitive to distinguishing regularity only when contrasting high with low consistency levels. Starting from the age of 5 years, participants were able to differentiate positional consistency not just between high and low consistency levels, but also between high and moderate consistency levels.
Our findings are well consistent with the hypothesis that age plays a significant role in shaping an individual’s capacity for statistical learning within the context of visual linguistic information3,9. This implies that an individual’s proficiency in identifying and integrating linguistic patterns changes in concert with their age. As such, the efficacy with which one can detect and absorb patterns in orthographic stimuli fluctuates over time9, indicating that the capacity of statistical learning is age-dependent.
Inconsistent with previous findings suggesting that the development of visual statistical learning improves with age9,11, our study identifies a developmental watershed that is specific to the linguistic statistical learning of visual orthographic patterns. Our findings indicate a significant enhancement in statistical learning abilities between the ages of 4–5 years and 5–6 years, followed by stability after 8–9 years. This pattern is especially pronounced in conditions that provide relatively more statistical information, such as high and moderate conditions observed in this study. Our findings indicate that manipulating the positional consistency of target radicals into three levels—high (100%), moderate (80%), and low (60%)—significantly influences statistical learning abilities. The high-consistency level provided reliable patterns, enabling children to form strong associations and rapidly improve their learning. The moderate level still offered substantial statistical information, allowing for enhancement but requiring more cognitive effort due to increased variability. In contrast, the low-consistency level introduced unpredictability, hindering the ability to extract meaningful patterns and resulting in slower improvement. This pattern suggests that exposure to high and moderate consistency is crucial for developing statistical learning skills, while performance stabilization after 8–9 years indicates that foundational learning has been established, allowing children to maintain their skills. Moreover, this drastic improvement might be also because of the maturation of cognitive control mechanisms, such as the prefrontal cortex and the anterior cingulate cortex, which exhibit a domain-general processing shift in learning around age 415. These cognitive mechanisms are associated with the ability to discriminate and integrate representations as well as detect relational similarities between patterns. This enables 5–6-year-olds to better integrate the relation in orthographic representations and identify the discrepancies across varying consistency levels.
Our findings indeed align to a degree with the previous research conducted by Raviv and Arnon11, which identified a critical period for auditory statistical learning of linguistic input around the age of 6 years. Similarly, Pacton et al.22 determined that the critical period for the statistical learning of orthographic patterns takes place close to the age of 7 years. Our findings contribute to this body of knowledge by indicating a significant enhancement in statistical learning abilities between the ages of 4–5 years and 5–6 years, followed by stabilization after grade 2 (~8–9 years old). However, the maturational period for orthographic acquisition identified in our study is not consistent with the age proposed by Yin and McBride24, who reported that the critical period begins at the age of 5 years. Our findings suggest that this developmental milestone may be reached earlier. This discrepancy could be attributed to variations in task design between the two studies. Yin and McBride24 employed a character-learning task to investigate how kindergartners learned positional regularities within noncharacters (where real radicals violate positional conventions) and pseudocharacters (where real radicals comply with positional conventions) in children with 4–5 years and 5–6 years. The stimuli for this task were designed using authentic radical configurations. The authors reported that 4–5-year-old kindergartners are not sensitive in distinguishing the orthographic regularities without phonetic cues, as shown by the nonsignificant difference between noncharacters and pseudocharacters, while 5–6-year-old kindergartners could learn orthographic regularities independently without the support of phonetic cues, as indicated by outperformance in recognizing pseudocharacters over noncharacters regardless of phonetic-cue availability. We speculate that children’s performance in the task designed by Yin and McBride24 could be influenced by the kindergartners’ prior orthographic knowledge of certain radical patterns, rather than by differences in their inherent ability to statistically learn orthographic regularities. To minimize the impact of pre-existing knowledge of orthographic radical patterns, our study used artificial pseudocharacters, which were systematically varied in terms of radical positional consistency for use in an orthographic learning task, and all participants were unfamiliar with the pseudocharacters. Therefore, our findings are more likely indicative of children’s innate sensitivity to distributional regularities in Chinese orthography at the early age of 4.
It is important to note that a consistency effect was evident only when comparing the extremes of high and low consistency levels among the 4–5-year-old participants; no significant difference was detected when comparing high to moderate or moderate to low-consistency levels. This suggests that those young children’s statistical learning mechanism might be fine-tuned to a certain level of regularity, and once the level of inconsistency in the input exceeds this threshold, their ability to detect and learn from the regularity diminishes. Specifically, in our study, the high consistency (100%) means the radical always appears in the same position, which creates a strong, predictable pattern that children can easily learn and predict. As the consistency level drops, the patterns become less predictable. At 80% consistency, the majority of instances still follow the pattern, but there is a slight increase in irregularity. This slight increase might not be enough to disrupt the overall pattern that children have learned to predict based on their developing statistical learning abilities. The pattern remains strong enough that the slight unpredictability is assimilated into the learned regularity. However, when the consistency level is further reduced to 60%, the predictability of the radical’s position decreases significantly. Almost half of the instances deviate from the expected pattern. This reduction in regularity leads to a strong conflict between the 60% consistent and 40% inconsistent items within the low condition, which may interfere with the processing of assimilation and, therefore, make children have difficulty discerning the pattern. The children’s statistical learning abilities are then challenged, allowing us to observe a clear difference in their ability to recognize and learn the radical positions compared to when they are presented with 100% consistency. Nevertheless, the absence of significant learning differences between 100%–80% and 80%–60% consistency levels indicates that within this range, younger kindergartners’ statistical learning ability is insufficient to distinguish between the specific radicals with a 20% difference in positional consistency.
Another innovation of our study was the development of a power-function model to explore the age-dependency of statistical learning. To our knowledge, the present study is the first that employs the non-linear model to fit the developmental trajectory of statistical learning. Compared with the traditional linear modeling11, the power function could explain more variances and well capture the developmental trajectory of statistical learning, especially for explaining the developmental tendency of which the increasing rates improved with age.
Furthermore, the power function curves of three consistency levels might help us to further understand the development of statistical learning. The results indicated that there are developmental changes in statistical learning of distributional regularity for higher consistency (at least 80%), while the development of statistical learning of low regularity with 60% consistency shows no significant change from K1 children to young adults, indicating that the developmental trajectory of statistical learning could be changed with varying levels of consistency. This can be explained by the iMINERVA model, a computational model accounting for distributional statistical learning proposed by Thiessen and Pavlik Jr.30. In this model, the authors emphasized the crucial role of long-term memory in the process of statistical learning in terms of the memory-based principles of similarity-based comparison, decay, integration, and abstraction. Therefore, in our study, participants compare the prior pseudocharacters with the current one and detect the common feature in the position of critical radical if the positional consistency passes a certain threshold. Then a memory-based process arises to integrate the prior and current items to form a new representation that the position of the specific radical is consistent. If the prior and current items have a more consistent radical position (e.g., high or moderate levels with 100% or 80% positional consistency), this memory-based process will be highly facilitated to consolidate the novel representation and result in a better performance in the recognition test; if the radical positions of the prior and current items are conflicted (e.g., low levels with 60% positional consistency), the facilitation from the integration process will be weakened and result in worse performance compared to the condition with more consistent positions. With the development of memory, participants’ performance of regularity acquisition improves with age and forms different developmental trajectories with overt shifts for more consistent levels (i.e., high and moderate). However, the developmental pattern in the low-consistency level shows no change from childhood to adulthood, which might be attributed to constrained memory retrieval in encoding more conflicted representations. Additionally, another critical factor that should be considered is the increasing familiarity with the language during the development of statistical learning in orthographic learning4. In our study, there is a degradation but not significant in statistics in the recognition performance for the high-consistency level from P2 to P3 children (ages 8–9 to 9–10 years). This change might be interpreted as the prior experience of Chinese orthographic regularities in P3 children. As more orthographic structures with varying positional regularities are maintained in their mental lexicon, P3 children become more cautious about judging whether the positions of critical radicals are fixed or not, leading to a reduced tendency in their performance in the high-consistency condition. However, the interplay of the development in statistical learning, memory, and the prior experience in language, requires further tests to prove.
The findings in this study have both theoretical and pedagogical implications. The varying sensitivity to consistency levels across age groups suggests a developmental progression in the ability to detect and process linguistic patterns, supporting the age-related hypothesis of statistical learning9,10. In addition, the identification of a critical age period between 4 and 6 years for the interaction between age and consistency suggests that once children’s statistical learning of visual orthographic patterns matures, this ability remains stable and persists into adulthood13. This finding was further supported by our power function model, showing the non-linear improvement of acquiring different levels of regularities. Taken together, our study advances the knowledge of the developmental progression of statistical learning, highlighting the changes that occur in children’s ability to detect and learn linguistic regularities as they mature.
Pedagogically, our findings have significant implications for education and intervention strategies. They highlight the need for rich linguistic environments during early childhood, particularly around ages 4–6, to support statistical learning development. This could influence the design of early education curricula and literacy instruction methods, potentially emphasizing high-consistency patterns for younger children before introducing more subtle regularities. The findings also suggest that interventions for learning difficulties might be most effective when implemented early, while the continued improvement into adulthood implies that it is never too late to enhance these skills, which could inform approaches to adult literacy or second language learning.
The present study has several limitations to consider. First, while our study examined statistical learning in Chinese orthographic regularities, the findings may not generalize to alphabetic writing systems. Chinese orthography differs significantly from alphabetic languages like English in its visual-spatial complexity and lack of grapheme–phoneme correspondence31. Chinese is a morphosyllabic language where characters represent syllables, with most characters (>80%) being phonetic-semantic compounds25. These compounds consist of semantic and phonetic radicals arranged in specific positions, each carrying orthographic, phonological, and semantic properties. For example, in “清/qing/(clear),” the semantic radical “水(water)” appears on the left while the phonetic radical “青/qing/” is on the right. In contrast, English uses a linear arrangement of letters with grapheme–phoneme correspondences. While these correspondences are not always one-to-one, English readers primarily rely on phonological mediation (orthography–phonology–semantics) rather than direct orthography-to-semantics mapping32. These fundamental differences may impact the developmental patterns of statistical learning in the acquisition of orthographic regularities. Therefore, future research could explore alphabetic languages to further investigate the developmental changes in the role of statistical learning in orthography.
Second, the current study assessed learning outcomes immediately following the learning phase, focusing exclusively on short-term performance. This approach limited our ability to examine the long-term retention and durability of the learned patterns. Without follow-up assessments at extended time intervals, we cannot determine whether participants maintained the acquired orthographic regularities or how these patterns might have evolved over time. This limitation highlights the need for future studies that can track the stability and potential changes in statistical learning effects across different time periods.
Third, other distal factors, such as children’s intrinsic motivation, may also influence their learning performance33,34. However, this study did not collect data on children’s intrinsic motivation, leaving its potential impact unexplored. Intrinsic motivation plays a critical role in shaping how children engage with and retain new information35, suggesting that individual differences in this area could contribute to variability in learning outcomes. Future research should take this factor into account by assessing children’s learning motivation and examining its interaction with statistical learning processes. Additionally, future studies could explore other external and internal factors, such as cognitive abilities, socio-emotional influences, or prior literacy experiences, to better understand the complex interplay of elements that shape the developmental patterns of statistical learning in orthography.
Despite the above limitations, our findings indicate that children are able to acquire orthographic regularity as early as ages 4–5. Furthermore, the progression of distributional statistical learning is affected by age, indicating a significant enhancement in statistical learning abilities between the ages of 4–5 years and 5–6 years, followed by stabilization after grade 2 (8–9 years old). These findings support the theoretical hypothesis that the development of statistical learning is age-related and has a critical period for maturation in early childhood.
Methods
Participants
A total of 285 children from a preschool and primary school in Zibo, a city in Shandong Province, China, along with 24 adults, participated in the experiment. Specifically, participants included 40 K1 children (i.e., first year of kindergarten, aged 4–5 years, 21 girls, M age = 4 years 6 months, SD = 2.87 months), 38 K2 children (i.e., second year of kindergarten, aged 5–6 years, 19 girls, M age = 5 years 6 months, SD = 2.70 months), 41 K3 children (i.e., third year of kindergarten, aged 6–7 years, 21 girls, M age = 6 years 4 months, SD = 3.39 months), 33 P1 children (i.e., first year of primary school, aged 7–8 years, 17 girls, M age = 7 years 3 months, SD = 4.70 months), 32 P2 children (i.e., second year of primary school, aged 8–9 years, 15 girls, M age = 8 years 3 months, SD = 5.40 months), 40 P3 children (i.e., third year of primary school, aged 9–10 years, 23 girls, M age = 9 years 3 months, SD = 3.95 months), 33 P4 children (i.e., fourth year of primary school, aged 10–11 years, 13 girls, M age = 10 years 2 months, SD = 4.76 months), 28 P5 children (i.e., fifth year of primary school, aged 11–12 years, 14 girls, M age = 11 years 3 months, SD = 3.88 months), and 24 adults (12 females, M age = 21 years 3 months, SD = 2.17 months). All of the participants were native Chinese Mandarin speakers and right-handed. All of them had normal or corrected-normal vision. Formal literacy instruction was not provided for children in kindergarten. Ethical approval for this study was obtained from the Human Research Ethics Committee (HREC) of The Education University of Hong Kong (2018-2019-0137). All parents provided their written informed consent for their children to take part in the study. For children more than 9 years old and adult participants, written informed consents signed by themselves were obtained.
Experimental design and materials
We used a single-factor repeated measures design in which we manipulated the positional consistency of the target radicals into three different levels: high (100%), moderate (80%), and low (60%). The stimuli used in this experiment were adopted from a previous study26. The experiment consisted of a learning phase and a recognition phase. In the learning phase, there were 30 artificial pseudocharacters made up of 6 target radicals and 5 control radicals adopted from Geba and Dongba characters which belong to the Naxi minority in western China. Participants in this study were never exposed to these two scripts. All the pseudocharacters were top–bottom structured. Each of them contained two radicals: a target radical that occupies either the top or the bottom position and a control radical at the opposite position. The target radicals under the high-consistency condition always appear in the same top or bottom position in all five pseudocharacters (e.g., the target radical  appeared on the top among all of those pseudocharacters
  ,
,  ,
,  ,
,  ,
,  ). Eighty percent of the target radicals under the moderate-consistency condition appear at the top or bottom while only one is in the opposite position (e.g., the target radical
  appeared on the top in those four pseudocharacter and one on the bottom among the five pseudocharacters
  ,
,  ,
,  ,
,  ,
,  ). Sixty percent of the target radicals under the low-consistency condition appear at the top or bottom while two are in the opposite position (e.g., the target radical
  appeared on the top in those three pseudocharacter and two on the bottom among the five pseudocharacters
  ,
,  ,
,  ,
,  ,
,  ). The control radical carried no positional preference among items. Thirty pseudocharacters (10 for each condition) were ultimately created.
Procedure
All subjects were required to complete a learning phase followed by a recognition phase. During the learning phase, a revised statistical learning paradigm was adopted to assess participants’ statistical learning process26. Participants were exposed to a continuous sequence of pseudocharacters in a fixed pseudo-randomized order at the center of the monitor. Stimuli were displayed using E-Prime 2.0 software (Psychology Software Tools, Pittsburgh, PA). For each trial, a fixation “+” was shown at the center of the monitor for 500 ms, followed by a blank screen for 500 ms. Then, a pseudocharacter appeared for 800 ms, followed by a blank screen for 1000 ms. Participants were required to press the SPACEBAR key when two identical stimuli appeared continuously. Each stimulus was repeated 24 times resulting in 720 trials.
The recognition phase contained 30 stimuli, including 15 items used in the learning phase and 15 novel items created by swapping the position of the target and control radicals. Participants were required to press corresponding keys if they recognized stimuli from the learning phase. Items remained visible until the participants responded. The reaction time and accuracy rate were recorded for both the learning and recognition phases. The whole experiment lasted ~40 min.
Data analysis and developmental model fitting
We first conducted one-sample t-tests to investigate whether participants could acquire the three levels of positional consistency in each age group. Next, mixed ANOVA analyses were conducted with consistency level (i.e., high, moderate, and low) as a within-subject factor, as well as with age group (i.e., K1, K2, K3, P1, P2, P3, P4, P5, and adult) as a between-subject factor, for accuracy rate in the recognition test, respectively. Turkey’s HSD tests were computed for the post-hoc comparisons.
By applying MATLAB (R2023b) software, we then fitted the accuracy rates in each consistency level as a power function of the age groups (AG), given as:
in which (widetilde{{ACC}}) was the predicted accuracy rate, k was the coefficient, and n was the exponent. If the exponent n was significantly larger than 0, then there would be a developmental change in statistical learning of distributional orthographic regularities.
A permutation test was conducted to examine whether the ns were significantly different among different consistency levels. We arranged the ns of every two consistency conditions and randomly assigned the values to the two conditions. The differences between the n values in the two rearranged conditions were considered as the test statistics. After 10,000 permutations, if the cases of rearranged differences that exceeded the original difference between two conditions were significantly fewer in statistics (p < 0.05), we would consider the difference of ns between the two consistency levels significant. P values were corrected with Bonferroni method.
Responses