The mysterious magnetic ground state of Ba14MnBi11 is likely self-doped and altermagnetic

Introduction
Zintl compounds with the general formula A14MnPn11, where A is an alkaline earth, an alkaline metal, or a trivalent rare earth, and Pn is a pnictogen, have been attracting attention as potential thermoelectrics (especially Yb14MnPn11) for a few decades. These were intensively studied in 1992–2002, but larger forgotten after that. Yet, their physics, and especially their magnetic properties remain very poorly understood, which is especially true about Ba14MnBi11, as summarized in ref. 1. Below, we list the most enigmatic experimental and computational findings1,2,3,4
-
1.
Magnetic susceptibility is clearly antiferromagnetic (AF), but DFT calculations, with large confidence, give ferromagnetism (FM) as the ground state.
-
2.
Yet, the Curie-Weiss temperature is positive (ferromagnetic). This is a common phenomenon in A-type antiferromagnets consisting of strongly coupled FM planes, with a weak AF interaction between them. However, the crystal structure of Ba14MnBi11, in its space group I41acd, is rather three-dimensional and, at first glance, highly symmetric: each Mn has 10 nearest neighbors in all directions, with four Mn-Mn bonds forming a tetrahedron, another four exactly the same tetrahedron, but flipped, and two more forming a linear structure. Geometrically, it seems that the structure cannot be easily partitioned into weakly coupled FM sublattices.
-
3.
The Curie-Weiss effective magnetic moment is 4.8 μB, consistent with the spin S ≈ 2 (M = 4 μB), but the saturation magnetization was claimed from the experiment in the field up to 5 T is ≈ 3 μB. At the same time, DFT calculations, again with a great degree of confidence, show Mn to be in a divalent high-spin state, i.e., M = 5 μB.
-
4.
Calculations give a metallic ground state, with a few Bi-derived bands at the Fermi level and no Mn bands near EF, consistent with Mn2+. It was claimed to be metallic in the experiment as well, but in the only transport measurement3 the resistivity is barely dependent on temperature, with Residual Resistivity Ratio (RRR) about 1.3 and the resistivity being weakly metallic below the Neél transition.
-
5.
Last but not least, the linear specific heat coefficient corresponds to the density of states of 44 states/eV ⋅ formula, while the calculations give, for a sizeable range of Fermi energies, less than 7.5 states/eV ⋅ formula.
So, in and by itself it is an intriguing compound with many unresolved mysteries. In addition, there is no experimental data on the magnetic pattern, except that it is clearly antiferromagnetic. As pointed out in ref. 1, there are three distinct-symmetry magnetic patterns even for q = 0, which they called AFM(a-c). In retrospect, one of these patterns, namely AFM(c), is altermagnetic (AM), a novel type of ordered collinear magnetism that has been intensively discussed in the last few years5,6,7.
In this paper, we will address some of the unresolved issues, either exact or speculative, assuming that the experimentally available samples have a small hole doping of the order of 1 hole per 4 formula units (F.U.), for instance, due to 1% vacancies on Ba site. Interestingly, at the same time, doping stabilized the AM order.
Following an overview of the crystal structure, we first present our data for the doping effect on the ground states and how two different AF orderings can be induced. We then look into the doping effect on the exchange coupling using two different methods. The band structure and the projected density-of-states are analyzed near the Fermi energy to establish a connection between band characters and the doping effect on the magnetic structure.
Results
Crystal structure
The compound has a body-center-tetragonal space group I41acd unit cell with four formula units, as depicted in Fig. 1a, with additional Mn sites (blue) included to show J2. There are four inequivalent Bi sites shown in different colors as defined in the figure. The lattice parameters a = 18.665(3) and c = 24.429 Å are taken from the original experimental work3.

a The schematic view of the first three nearest exchange paths defined in the unit cell of four formula unit. b Depiction of the model magnetic cell showing four magnetic sites and how two inequivalent exchange coupling constants J1 and ({J}_{{1}^{{prime} }}) are spatially oriented. c Extended structural view revealing four inequivalent Bi sites organized into tetrahedral units, trimers, and isolated Bi sites. d Additional symmetry feature: The view illustrates that ({J}_{{1}^{{prime} }}) bonds have an inversion center at the midpoints and J1 do not.
While all Mn are symmetry equivalent, there are two inequivalent 1st NN exchange coupling interactions: J1 (red) that passes through two vertices from two tetrahedra and ({J}_{{1}^{{prime} }}) (blue) that do not. More importantly, as Fig. 1d shows, the J1 bonds have an inversion center at the midpoints and ({J}_{{1}^{{prime} }}) do not.
A more complete view of how J1 and ({J}_{{1}^{{prime} }}) are spatially oriented for each Mn site is presented in Fig. 1b. All four Mn sites are labeled with numbers to indicate their order for later discussion.
Figure 1c shows the extended view of the structure that exhibits a complicated tetrahedra network. Due to the large number of atoms in the unit cell, for better visibility, Ba sites are not displayed. It becomes clear that the crystal structure per F.U. consists of one linear trimer (({{rm{Bi}}}_{3}^{7-})), four isolated Bi3− and a tetrahedral unit (({{rm{MnBi}}}_{4}^{9-})). The tetrahedra, as explained in ref. 1, are interconnected through either J1 and ({J}_{1}^{{prime} }), two inequivalent first NN exchange coupling interactions, which form two different networks.
Doping effect on total energy
Figure 2 shows the relative energies compared to the FM state uuuu as a function of doped charge ranging from light hole doping up to exactly one electron per Mn (four in total) for udud, uudd and uddu three AF orderings, where u(d) represents the up (down) spin moment on the Mn site and the structure and the order of Mn are defined in Fig. 1. The positive (negative) charge in the x-axis indicates electron (hole) doping. This convention is also applied to the rest of the discussion.
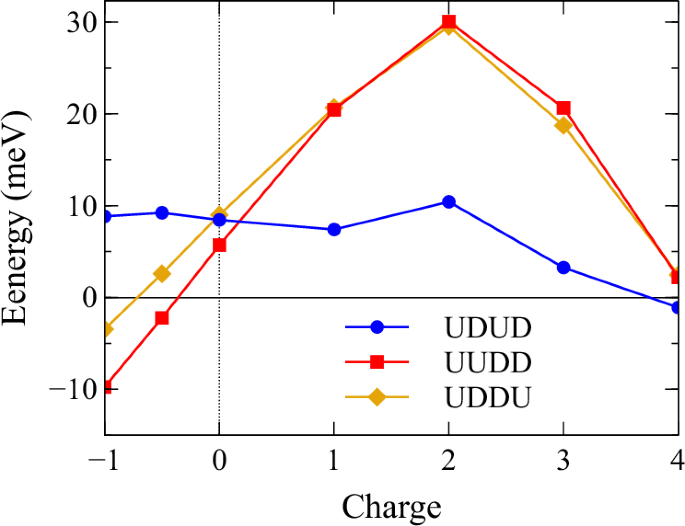
Negative charge represents hole doping.
Generally, the relative energies for uudd and uddu, in contrast to that of udud, share a very similar pattern, and both are very sensitive to doping. In the light doping region near stoichiometry (−1 to 2), the trends of all three curves are rather consistent. Both uudd and uddu vary monotonically and almost linearly with very steep slopes as the energies change from around −10 to 30 meV within the region, while udud does not show any obvious dependence, and the energy stays at roughly 9 meV above FM.
Without doping, all three states are very close in energy, and FM is the ground state. The energy differences then begin to widen rapidly as electrons or holes are introduced into the system. With light electron doping, the ground state stays FM. However, when a small fraction of holes (x ≥ 0.12 h/Mn) is introduced into the system, the GS quickly transitions into uudd, a very interesting type of AF, known as AM.5,6,7,8. Indeed, as Fig. 1d shows, if the ({J}_{{1}^{{prime} }}) bond is antiferromagnetic, there is an inversion operation connecting the two sublattices, which is a signature of a trivial AF state9, while if the AF bonds are J1, the structure becomes AM.
As more electrons are added to the system, a qualitative change of behaviors can be seen in all three cases around e = 2 (0.5 e per Mn). Above this point, the energies for all three states begin to decrease monotonically until e = 4, where the Fermi level reaches the gap. The system hence becomes semiconducting and transitions into a very weakly coupled AF state in udud phase.
In this gapped system, all four magnetic states (including FM) are nearly degenerate with only about 1–2 meV difference in total energy despite the large supercell. This is due to the fact that the original exchange pathways mediated by long-range RKKY interaction in the metallic state are no longer available. As a result, the magnetic interactions between Mn sites separated by a large distance are now instead governed mainly by the much shorter-range superexchange mechanism, which tends to favor AF. This udud phase induced by electron doping, as previously suggested, corresponds to the configuration that is ferromagnetic within the same network formed by the tetrahedra units are connected through ({J}_{{1}^{{prime} }}) and antiferromagnetic with adjacent network connected by J11.
Doping effect on exchange coupling
Figure 3 shows the exchange coupling parameters as functions of doping for the first few nearest NN using both (a) GF function method and (b) total energy difference method. For the latter, due to the computation limitation by the system size, only up to J2 are calculated.
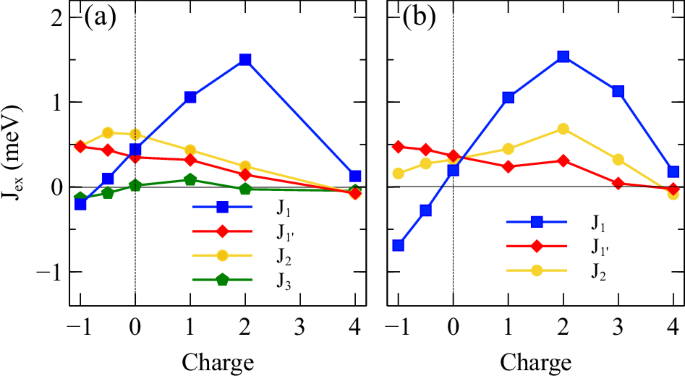
a calculated using Greens function method and b calculated using total energy difference method.
Generally, some differences between the two methods are expected, as in the case of the energy difference method, the further NN interactions which could still contribute in the RKKY-driven regime are combined into the nearest three exchange parameters, while GF is a perturbation method on a single determinant which allows the calculation between any given pair of any distance. Also, these two methods differ in that the perturbative Green function method corresponds to small deviations of collinearity and the total energy method assumes full spin flips; the two may physically differ if the magnetic Hamiltonian deviates from the Heisenberg form.
Despite the difference, several key features are rather consistently predicted by both methods and offer useful insights into understanding the effect of doping. Most importantly, both suggest that J1 is the most susceptible component to doping, and its sign and strength vary greatly depending on the type of doping, while ({J}_{1}^{{prime} }) and J2 change more gradually. Other qualitative behaviors such as the crossover between the ({J}_{1}^{{prime} }) and J2 as well as the sign change of J1 in the hole doping region are also captured.
The similar response of both uudd and uddu to doping suggests that they share the same dominant mechanism, which differs significantly from that of udud. Indeed, from both Fig. 3a and b, one can see that the qualitative behaviors of uudd and uddu closely resemble that of J1, which connect opposite spins in both states, indicating that J1 is the main driving mechanism of the dependency.
Although other major components, such as ({J}_{1}^{{prime} }) and J2, are also significant in terms of strength, the effects from ({J}_{1}^{{prime} }) and farther NN interaction J2 roughly cancel out. This cancellation is mainly due to the fact that, while the strength of J2 is about twice bigger than ({J}_{1}^{{prime} }) but, for any given Mn site, the number of its 2nd NN is only half its first NN connected through ({J}_{1}^{{prime} }). This explains why uudd and uddu nearly degenerate in electron doping cases.
However, in the hole doping case, this cancellation no longer holds, as ({J}_{1}^{{prime} }) continues to increase with more hole carriers introduced into the system, while J2 reaches the peak and begins to decline. As a result, in Fig. 2, one can see the difference in the total energies between uudd and uddu begins to widen and uudd becomes the ground state. It is interesting to note that, despite some discrepancy in the qualitative behavior, both Fig. 3a and b exhibit the same cancellation in charge doping region and the cancellation is removed due to hole doping.
On the other hand, in udud, the energy term that involves J1, the most sensitive component to doping, has the same sign as that of the FM ordering; therefore, the doping dependence of the energy difference between the two is mainly influenced by other exchange paths, such as less sensitive ({J}_{1}^{{prime} }) and J2.
Figure 4 shows the exchange coupling parameters as functions of distance for Bi14MnBi11 with different amounts of doping, calculated using Green’s function method. The exchange coupling parameters in all three metallic states (0, 0.5 and 1) possess long-range (there are still significant contributions beyond 20 Å) and sign alternating behavior, which are both signatures of the RKKY interaction where the localized 3d Mn moments are coupled through conduction electrons. This is likely the reason for the unusually high TN given such large spacing between the magnetic Mn sites.
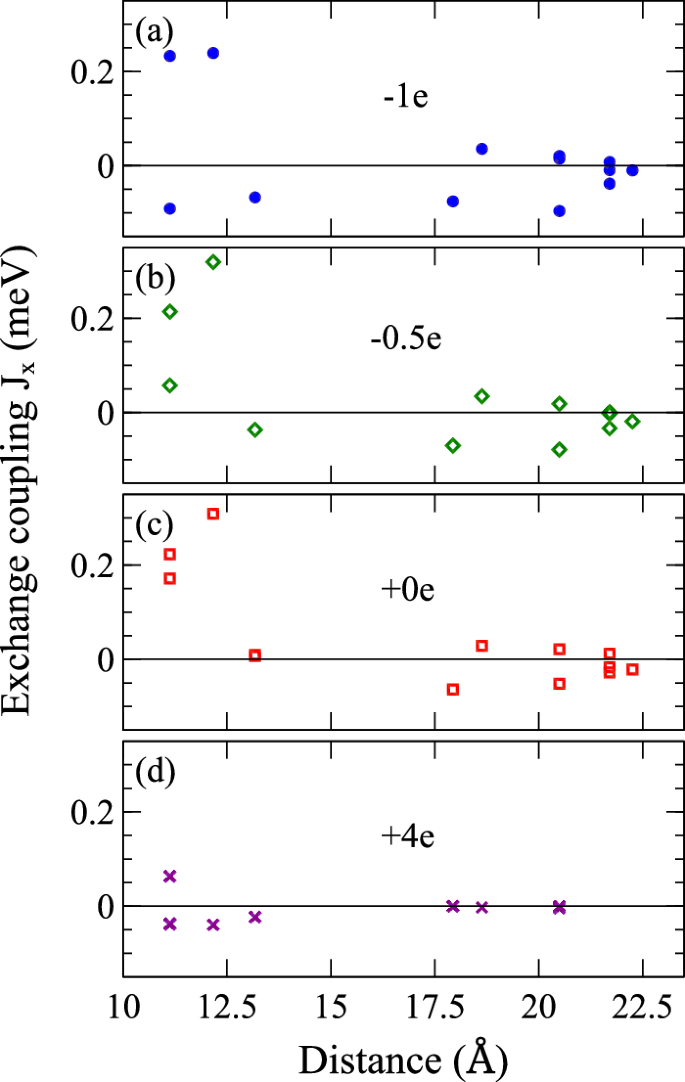
The constants are calculated using Green’s function method for a one hole, b 0.5 hole, c stoichiometric, and d four electron doping per four formula units.
For e = +4, the system in a semiconducting state as mentioned earlier, likely governed by superexchange, has only much weaker and shorter-range interactions that favor AF, as shown in Fig. 4d, all J1−3 are much smaller and essentially negligible beyond J3.
However, it is important to note that while there are still significant interactions beyond 3NN (≥14 Å) in the metallic states, most of the farther neighbors are rather insensitive to doping, as shown in Fig. 4a–c. It is therefore reasonable to assume that the qualitative behaviors due to doping are mainly dictated by ({J}_{1},{J}_{1}^{{prime} }) and J2.
T
CW and T
N
All Mn sites are equivalent, and each Mn is connected to eight first NN: four through J1 and four through ({J}_{{1}^{{prime} }}), as well as two second NN through J2. The critical temperatures Tc (c = CW and N for Curie-Weiss and Nèel temperature, respectively) in the mean-field approximation are directly related to the strength of exchange interactions Ji. They can be expressed in the following simple form
where kB is the Boltzmann constant and σ = sisj are the signs, as summarized in Table 1, indicate the alignment between the magnetic moments connected by the given Ji in each magnetic state.
Figure 5 shows the mean-field TN for the three AF states and TCW estimated from the exchange parameters obtained using (a) Green’s function method and (b) total energy difference method as presented in Fig. 3. It is worth noting that the Curie temperature TC for uuuu has an identical expression as TCW in the mean-field approximation. Despite some small deviations in J2, both methods agree reasonably well, suggesting that the Mn moments are fairly localized. Generally, the state with the highest critical temperature (TN or TC) corresponds to the most stable and energetically favorable state. This becomes clear when compared with Figs. 2 and 3.
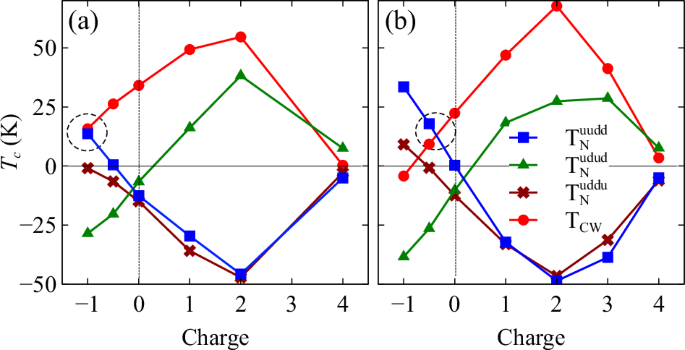
a calculated using total energy (VASP) and b calculated using Green’s function method (OpenMX).
Light electron doping stabilizes the FM state leading to a positive and increasing TCW. At e = 4, all temperatures become very small as a result of weak couplings in semiconducting states, with udud being the ground state and ({T}_{N}^{udud}) having the largest value. On the other hand, light hole doping has the opposite effect promoting uudd while destabilizing the FM state. Given the close resemblance between uudd and udud shown in Fig. 2, it is not surprising that their TN values also have the same dependence on doping, despite uudd being more stable.
Most importantly, near the hole doping concentration where uudd (AM) is predicted to be the ground state (i.e., e = 1.0 in Fig. 5a and e = 0.4 in Fig. 5b), two curves TCW and ({T}_{N}^{uudd}) intersect at around T = 15 K. This naturally implies that both temperatures have the same sign and are very close in magnitude (~15 K) in the proximity of the intersection, as indicated by the dashed circles in both Fig. 5a and b. This is indeed supported by the experimental values showing TN = 15 K and TCW = 17 K3.
We would like to point out that this nearly perfect agreement is likely fortuitous as the estimated critical temperatures depend on the choice of effective U. While the U value does not alter the qualitative effects of charge doping, a large U tends to suppress the exchange constants, which in turn lowers the critical temperature. If we had considered a smaller U to account for metallic screening, the calculated critical temperatures would have been higher, as expected in the mean-field approach.
This finding is rather intriguing because a positive TCW suggests an FM state which contradicts a positive TN that indicates an AF state. As introduced earlier, this phenomenon is common in the antiferromagnets consisting of strongly coupled FM planes with a weak AF interaction between them.
Although, at first glance, the highly symmetric crystal structure of Ba14MnBi11 appears three-dimensional and does not allow such type of planer coupling, the magnetic moments, instead of planar, can, in fact, be visualized as two interpenetrating 3D networks1.
The discrepancy can then be easily explained if the Mn moments within the same network, coupled through J1, strongly favor the FM ordering; meanwhile, a weak AF interaction, coupled through ({J}_{{1}^{{prime} }}), exists between networks. This explanation is consistent with our data shown in Fig. 3, further supporting the argument made in previous work1. However, it is important to note that, the definition of Mn network here is different from that in ref. 1, where they consider the Mn tetrahedra complexes connected by J1 to belong to the same network.
Exchange pathway and band characters
Due to the large distances that separate the Mn atoms, the behaviors of the exchange couplings are expected to be heavily influenced by the detailed electronic structure of Bi-p bands as they are the major components near the Fermi level1. To gain more insight into the underlying mechanism, it is helpful to first look into the exchange pathway and identify the band characters associated with it.
Figure 1a shows the definitions of the three dominant exchange parameters ({J}_{1},{J}_{{1}^{{prime} }}) and J2, along with the relevant surrounding elements displayed. One can see a clear distinction between the three. For J1, the path directly goes through two Bi3 sites while ({J}_{{1}^{{prime} }}) does not overlap with any sites directly. However, its exchange pathway likely involves two Bi4 atoms near the path that form a plane with the two Mn sites connected by ({J}_{{1}^{{prime} }}). The Next NN J2 has a direct overlap with the Bi1 at the midpoint, which is likely to involve the entire trimer (Bi1 and Bi2). As the Bi band consists of four different inequivalent Bi-sites as introduced in “Results”, one can immediately notice that each pathway can be associated with at least one distinct type of Bi character that is directly involved.
Figure 6 shows the projected density of states (pDOS) for all four inequivalent Bi sites near the Fermi level and valence band maximum (VBM). Generally, the Bi sites from the tetrahedral units, as shown in Fig. 6c, have the largest contribution around the Fermi level and host the biggest portion of the hole concentration (near VBM). This explains why J1 is the most susceptible parameter to band filling. In addition, there is also a significant amount of isolated Bi (Bi2). In comparison, the trimer characters are less significant near the Fermi level. This configuration of orbital characters is not uncommon. A similar arrangement is also seen in other Zintel 14-11-1 compounds, as the band structures closely resemble one another10.
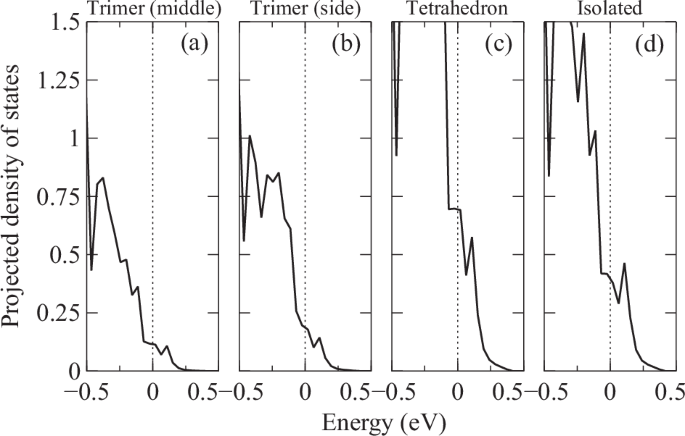
The four inequivalent Bi sites are from a middle of the trimer, b both sides of the trimer, c the four vertices of the tetrahedron, and d Isolated as indicated in Fig. 1c.
It is worth mentioning that our estimation of DOS for FM state at EF is approximately 7.0 states/eV ⋅ formula, which is very close to the earlier theoretical value (7.8 states/eV ⋅ formula)1. The large difference compared to the experimental value (~44 states/eV ⋅ formula)11 has been attributed to the effect of hyperfine splitting not being considered. However, the mechanism behind the unexpectedly large observed DOS remains unclear.
Figure 7 shows the band structure near the VBM for Ba14MnBi11 in FM state for both (a) majority and (b) minority spins [calculated using VASP (red) and OpenMX (black) as an additional check. The two methods yield remarkable agreement].
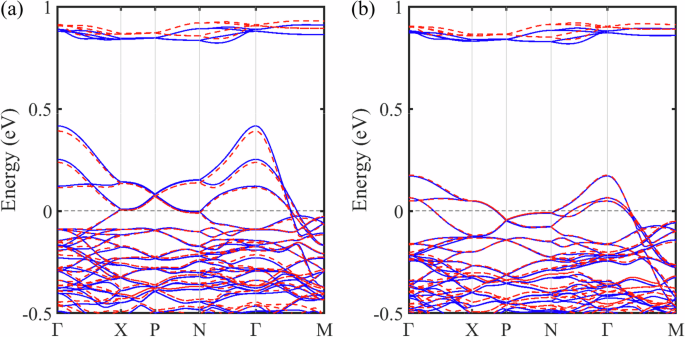
The band structure of Ba14MnBi11 in FM states. a majority and b minority spins calculated using VASP (red) and OpenMX (blue).
Similar to the previous findings1,10, near the Fermi level, a few rather dispersive light bands emerge from the flatter valence at Γ point, both seen in (a) and (b), indicating a p-type conductor. As shown in the pDOS analysis Fig. 6, these bands near VBM are mainly made up of the Bi characters from the tetrahedra unit with significant contribution from the isolated Bi sites. The relative high dispersion of the hole pockets around Γ point suggests a more complicated hybridization network, most likely between the two dominant characters.
Electronic and transport properties
In the transport measurement, the temperature dependence of RRR indicates metallic behavior, as resistivity decreases with the reducing temperature, despite the high resistivity observed. In the original work, this high resistivity is attributed to the polycrystal sample3. However, our transport calculations suggest that the compound inherently has poor conductivity regardless of sample quality. Figure 8 shows the plasma frequency as a function of Fermi energy. The values calculated along both x (red) and z (green) directions are generally smaller than 0.5 eV2, which is at least an order of magnitude smaller than in typical metals. In the Drude approximation, the static conductivity σ0 is determined by
where τ and ωp are the relaxation time and the plasma frequency, respectively. Such a small ({omega }_{p}^{2}) inherently leads to a small conductivity, although a short relaxation time can also contribute.
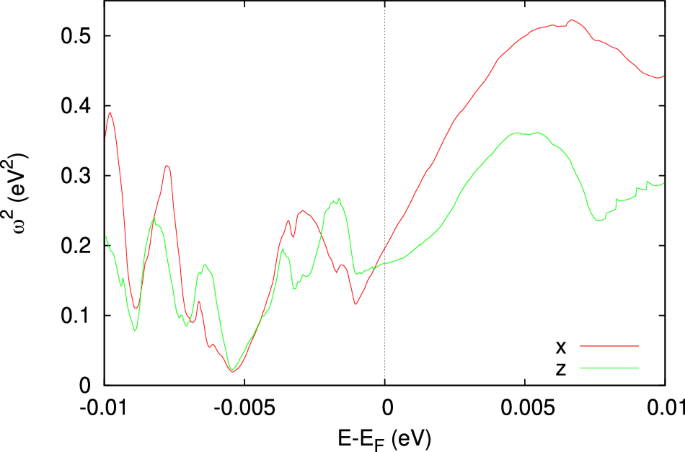
The red and green curves represent the frequency along x and z directions.
Discussion
To better understand magnetism in Ba14MnBi11, it is important to highlight the intricate connection between magnetic and electronic structures. As explained in detail in ref. 1, a comparison with the electronic structure of a similar compound Ca14GaAs11 (where Ga is identified to be trivalent)12, reveals that if Mn were in a trivalent state, the system would have been semiconducting12, which contradicts the transport measurements3. To be consistent with a metallic band structure, Mn should instead be in the divalent state (Mn2+) d5 configuration, which is consistent with the DFT calculations. The deviation from the experimentally observed net magnetization of ~4 μB is attributed to the opposite polarization of the Bi atoms that form tetrahedral units with Mn. Therefore, the entire ({{rm{MnBi}}}_{4}^{-}) complex should be treated as one magnetic unit in order to explain the discrepancy. This conclusion is further supported by our Voronoi charge analysis, which shows a clear d5 Mn state (~4.8μB) and the opposite polarization on Bi sites (~0.03 − 0.05 μB/Bi), consistent with the conclusions of ref. 1.
Intuitively, the FM order obtained from DFT is related to the metallicity of the stoichiometric compound; indeed, adding one additional electron per F.U to the system opens a semiconducting gap, and the ground states transitions into a weakly coupled AF state that corresponds to the state proposed in ref. 1. However, this does not account for the observed metallicity (albeit this observation may be questioned) and the weak interactions hardly account for the TN observed.
On the other hand, we found that the magnetic states are susceptible to band filling, particularly near stoichiometry. So, through a small amount of hole doping, we were able to obtain another type of AF state known as altermagnetic, while preserving the metallic conductivity. We therefore believe that the discrepancy in the magnetic state between DFT calculations and experimental findings stems from nonstoichiometry and intrinsic small hole doping, and the AF state observed in the experiment is in fact altermagnetic.
Figure 9 shows the cross-section of Fermi surfaces at kz = 0 of the AM state. The red (blue) color represents the up (down) spin. The band splits in a compensated magnetic order is the signature of altermagnetism.
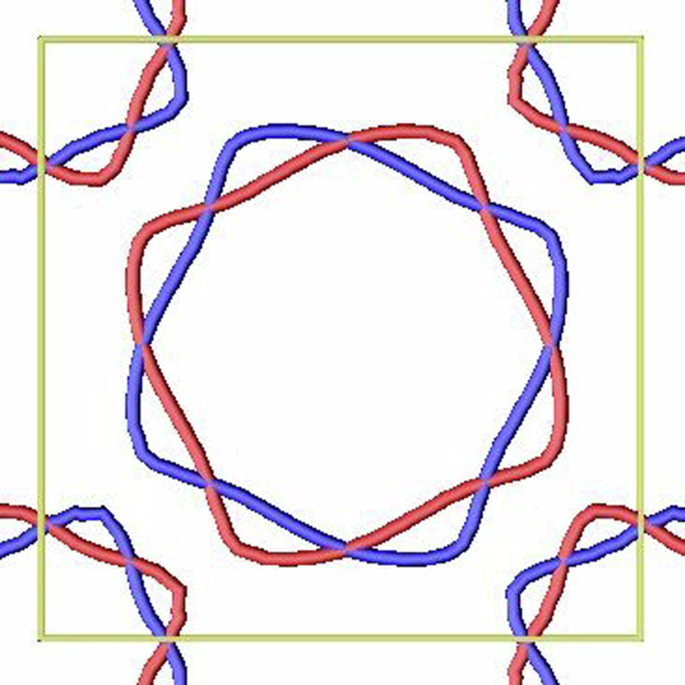
The red and blue contours represent up and down spins, respectively.
Importantly, the predicted altermagnetic state has a number of interesting properties suggesting that if better quality samples can be manufactured they can provide considerable advantage over existing altermagnetic candidates. First, it belongs to the d-wave class, per classification of ref. 7, which reduces the number of vertical nodal lines (compared to the two other convincingly established semiconducting/metallic altermagnets, MnTe and CrSb). Most importantly, despite its relatively high tetragonal symmetry, it has non-zero anomalous transport for all possible orientations of the Néel vector. Specifically, in the case of the easy-axis anisotropy, M∣∣c, anomalous conductivity σxz = σxz ≠ 0 is allowed, and for the easy plane anisotropy, M⊥c, all three components are non-zero, σxz = σxz ≠ σxy ≠ 0. This property is quite unique among altermagnetic candidates. The low Néel temperature of 15 K precludes practical application, but this material remains an interesting candidate to study altermagnetic physics.
Methods
First-principles calculations
The small energy scale of the magnetic interactions and the large crystal structure require considerable computational flexibility; since different DFT codes are best at addressing different aspects of the calculations, we employed three DFT codes of different types of basis sets to ensure accuracy as well as provide more insight. As a reference, the electronic structure calculations were first performed to obtain the total energies using Vienna ab initio Simulation Package (VASP)13 within projector augmented wave (PAW) method.14,15 The Perdew-Burke-Enzerhof (PBE)16 generalized gradient approximation was employed to describe exchange-correlation effects.
Mn2+ ion has a closed d5 shell and tends to be strongly correlated and have localized magnetic moment, therefore we added a Hubbard U correction with the fully localized limit double-counting recipe17,18. The typical for Mn2+ effective parameter U − J = 5 eV was used. It is worth noting that metallic screening may somewhat reduce the effective U, but reducing U only results in the overall increase of the calculated energy differences and will not change the hierarchy of the magnetic states.
Additionally, as an alternative to SIESTA19 used in ref. 1, a similar numerical-orbital-based20 DFT code OpenMX, designed for large-scale simulation, was used for the calculations of magnetic properties. In these calculations, core electrons are replaced with norm-conserving pseudopotential21,22, and a sufficiently large numerical atomic orbital set is chosen as Mn6.0-s3p2d2f1, Ba8.0-s3p2d2 and Bi8.0-s3p2d2f1 to accurately determine the band structure. As Fig. 7 shows, the band structures calculated using both codes are in good agreement. In both DFT codes, a sufficiently large k-point mesh 6 × 6 × 6 is used for the Brillouin-Zone integration to ensure the energy differences converge to the accuracy of at least 0.1 meV.
Spin Hamiltonian
The exchange coupling parameters are calculated using two different methods. We first use the standard energy-mapping approach following ref. 1 to calculate exchange coupling constants. Due to the computation cost, and large distances between Mn sites, only the interactions up to 2nd nearest neighbors (NN) are considered. In this method, the DFT energies for the four configurations (i.e., FM and three AF) are fitted onto the following spin Hamiltonian
where s are the normalized moments, (({bf{s}}={bf{S}}/| S| ,| {bf{s}}| =1),{J}_{1},{J}_{{1}^{{prime} }}) and J2 are the exchange parameters of two inequivalent 1st NN, and 2nd NN defined in Fig. 1a, and summation is over all different bonds. Note that in our definition, J > 0 indicates an FM interaction. This method will be applied exclusively to the data obtained using VASP and will be referred to as the “energy difference method” in the subsequent discussion.
To gain more insight, we also employed Green’s function method23,24 implemented in OpenMX 3.925,26. In this approach, the exchange interaction between any pair of given magnetic sites can be directly calculated from a single magnetic state for any given interionic distance. In this study, the method is only applied within OpenMX as it requires the Hamiltonian to be in a local orbital representation.
Plasma frequency calculations
Finally, for historical reasons, as well as to compare with an all-electron method, we used the Linear Augmented Wave method Wien2K27 for the Fermi surface properties, such as the Fermi surface cuts and the plasma frequencies as a function of the Fermi energy.


Responses