The impact of temperature on cotton yield and production in Xinjiang, China

Introduction
Cotton is one of the most important cash crops and provides the world’s largest fiber crop for the textile industry’s raw material1,2. In recent years, China has been one of the world’s top cotton producers, accounting for a quarter of global output (Fig. 1A, Table S1). China, USA, India, Brazil and Pakistan together play a significant role in world cotton production3. China’s total cotton yield in 2020 is 6314k tons. Xinjiang is the largest cotton-growing region in China, ranking first nationally in total output, per unit production and planting area for 25 consecutive years (Fig. 1B–D, Table S2, S3). In 2020, the total cotton production and planting area in Xinjiang was 5.16 million tons and 2.50 million hectares, respectively. Xinjiang is located in the northwest inland of China, with a vast territory, advantaged land resources and dynamic climate conditions for cotton cultivation4,5. Cotton production and sown area of Xinjiang have shown a significant increase in recent decades (Fig. 1D, E). Therefore, achieving sustainable cotton production in Xinjiang is of great importance for maintaining the economic income of cotton farmers in Xinjiang and for cotton production in China and even in the world.

A Distribution of world cotton production (2016–2020). B Distribution of cotton production in China (2016–2020). C Cotton planting area by counties in Xinjiang (2016–2020). D Cotton planting area of Xinjiang (1978–2020). E Total cotton production in Xinjiang (1978–2020). F The time span of each cotton growth period in NXJ, SXJ and TKO. The figure is drawn using R project and Adobe Illustrate. All the data in this figure are listed in Tables S1–S3.
Crop growth is susceptible to weather changes, particularly temperature fluctuations6,7. Cold weather is one of the most detrimental abiotic stresses affecting plants. Cold stress can significantly impact physiological activity, biochemical metabolism, growth, development, and ultimately crop yield8. 64% of the land area in the world has an average minimum temperature below 0 °C9. However, many economic crops, including rice, soybean, cotton, maize and tomato, are chilling sensitive and incapable of cold acclimation, thus can only grow in tropical or subtropical regions10,11. For instance, in rice, low temperature is the chief cause of ~30–40% yield reduction in temperate growing areas12.
Cotton is a thermophilic crop that originated in tropical regions, and its growth and development require specific temperature conditions to be completed successfully10,13,14. According to the previous production experience, cold damage can occur in the whole growth period of cotton, among which the occurrence frequency is the highest from sowing to seedling stage, and the impact on cotton production is also the greatest15,16. In emergence stage, cold damage is responsible for rotten seed and rotten bud17,18. In seedling stage, cotton suffered cold damage, cotyledon or true leaf, or young stem showed purple-red; when the temperature rose, purple symptoms gradually disappeared19,20. Autumn frost is the phenomenon that mass death of the upper leaves of cotton plants due to a brief low temperature below 0 °C. Autumn frosts often have an effect on cotton yields and fiber quality21. The phenomenon of cotton yield reduction caused by cold stress sometimes occurs in different cotton growing areas in the world. For example, 2016–2017 Australian cotton season, cold shock shortly after planting, followed by heat shock in January and February, resulting in a significant drop in production22.In some cotton regions of Australia, an average of 40 cold shocks can occur in the early stages (period 15 September–30 November) of cotton growth23.
Cotton production is a pillar industry of Xinjiang’s economy. However, the cotton-growing areas in Xinjiang are situated in the middle latitudes, where meteorological conditions are crucial environmental factors that significantly affect both the quality and stability of cotton yields. One of the primary challenges of cotton cultivation in Xinjiang is the short growing season, coupled with considerable year-to-year variability in thermal conditions. Among various agricultural meteorological disasters, cold damage due to low temperatures during the growing season poses the most significant threat to cotton production in the region, surpassing the impacts of hail, drought, wind, and sandstorms15. This study utilizes data from 33 national meteorological stations in Xinjiang’s cotton region to comprehensively analyze temperature changes, thermal conditions, and the frequency and severity of cold damage across different growth stages from 1981 to 2020. Additionally, a comparative analysis was conducted with the southwest cotton region of the United States. The correlation between cold damage indices and cotton yield in Xinjiang was also evaluated. This study provided the direction and scientific basis for the improvement of cultivation technology and breeding of cold-resistant cotton varieties in Xinjiang in the future.
Results
The thermal conditions during the cotton emergence stage in Xinjiang fell short of the required levels
There is a significant geographic and climatic difference between NXJ, SXJ and TKO, resulting in variations in the sowing time and subsequent growth periods of cotton in these regions (Fig. 1F). Based on the growth periods of cotton in Xinjiang and TKO, we calculated the annual variations in daily mean temperature, minimum temperature, and maximum temperature from sowing to budding, specifically during the emergence stage and seedling stage from 1981 to 2020. In NXJ, the daily mean temperature during this period ranged from 13 °C to 18 °C, exhibiting significant temperature fluctuations. In contrast, the daily mean temperature in SXJ over the past forty years was more stable, varying between 16 °C and 19 °C (Fig. 2A). Notably, the temperatures in TKO were consistently higher than those in Xinjiang during this timeframe (Fig. 2A). The frost-free period of SXJ, NXJ is 190–210,140–180, much shorter than that of TKO (235–300 days), respectively24. Additionally, both Xinjiang and TKO show a yearly increase in temperature, aligning with the global warming trend (Fig. 2A).
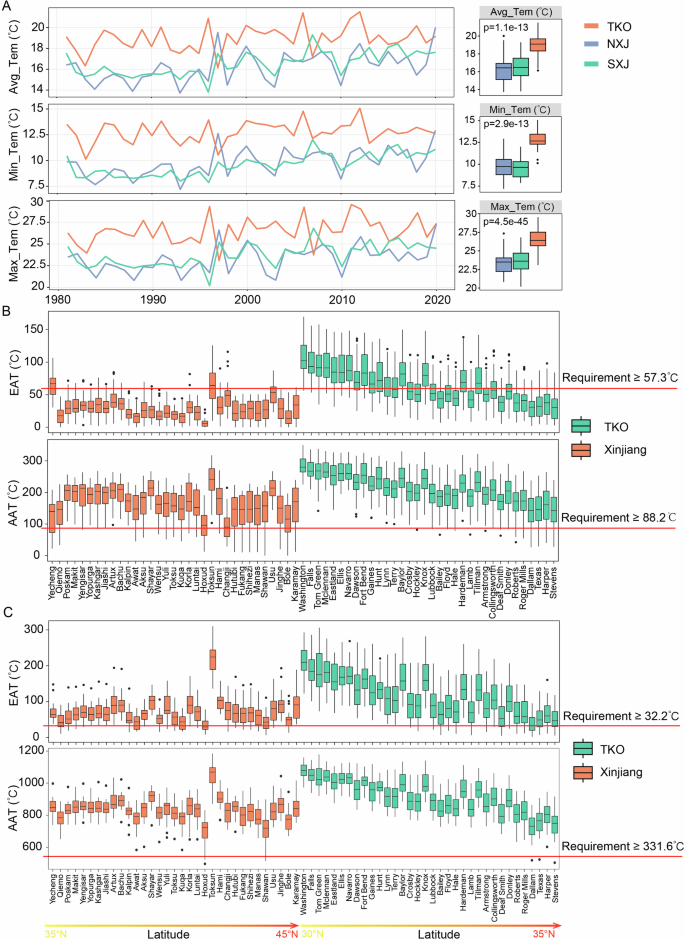
A Daily mean temperature, minimum temperature and maximum temperature at emergence stage and seedling stage in NXJ, SXJ and TKO (1981–2020). Effective accumulated temperature (EAT) and active accumulated temperature (AAT) at emergence stage (B) and seedling stage (C) in 34 counties of TKO and 33 counties of Xinjiang during 1981–2020. The figure is drawn using R project and Adobe Illustrate. All the data in this figure are listed in Supplementary Data 1–2.
The values of EAT (Effective accumulated temperature) and Active accumulated temperature (AAT) at emergence stage, seedling stage and whole growth period of cotton in Xinjiang and TKO were calculated (Fig. 2B, C, Fig. S1). At emergence stage, the EAT and AAT in Xinjiang are mainly 10–40 °C and 120–210 °C, respectively, which are both significantly lower than those in the TKO (EAT: mainly 45–80 °C, AAT: mainly 180–250 °C) (p < 2.2e-16). (Fig. S1A). EAT of most Xinjiang regions were below the required value of emergence stage (57.3 °C) for cotton between 20 and 30. These indicate that the thermal conditions in Xinjiang at emergence stage are insufficient, which was unfavorable for the emergence of cotton (Fig. 2B). Moreover, EAT and AAT in Xinjiang are mainly 50–90 °C and 780–900 °C at seedling stage, which basically meet the thermal requirement of cotton seedling stage (EAT requirement ≥32.2 °C, AAT requirement ≥331.6 °C) (Figs. S1A, 2C). But EAT and AAT in most Xinjiang are still slightly lower than TKO at seedling stage, p < 2.2e-16 (Fig. 2C). The EAT and AAT of Xinjiang and TKO in the whole growth period was sufficient to meet the requirements (Fig. S1B).
When counties from Xinjiang and TKO were ranked by latitude from low to high, the accumulated temperature of TKO showed an obvious trend from more to less, but there was no such trend in Xinjiang (Figs. 2B, C, S1B). The results also show that Usu, Artux, Shaya, Hami, etc. are the regions with sufficient heat resources during the growth period of cotton; Hoxud, Bole, Kuqa, Awat, etc. are the regions with insufficient heat resources. Interestingly, no matter in which period, the accumulated temperature value of Toksun is far greater than that of other areas. However, despite its superior thermal and light conditions, the planting area and the production of cotton are not high compared with other regions (Fig. 2B, C, Fig. S1). This phenomenon can be attributed to several factors. On the one hand, Xinjiang’s agricultural structure is highly diversified, with local farmers opting to grow other crops that offer higher economic returns. On the other hand, Toksun is one of the driest areas in China, and compared to other regions, agricultural water supply is relatively limited.
Spring Cold damage (SpCD) occurs frequently in Xinjiang
Spring is vital for germination and seedling growth. Cold damage during emergence and seedling stages increases the risk of seedling death. In summer, low temperatures during flowering and bolling can cause energy shortages, leading to abnormal boll development and reduced fiber yield and quality. To understand the extent and frequency of cold damage in Xinjiang during the cotton growth period, the number of days, annual frequency of cold damage, as well as maximum temperature drop in spring and summer were calculated (Fig. 3). The period in spring when cold damage occurs in NXJ, SXJ and TKO typically lasts 5–10 days, 3–7 days and 3–4 days every year, respectively. Nevertheless, the cold damage period that occurs in summer is around 3–6 days, 3–7 days and 3 days in NXJ, SXJ and TKO, respectively (Fig. 3A). It is obvious from Fig. 3C–F that the interannual frequency of cold damage in Xinjiang is higher than that in TKO both in spring and summer. The above results indicate that Xinjiang has a higher risk of cold damage than TKO.
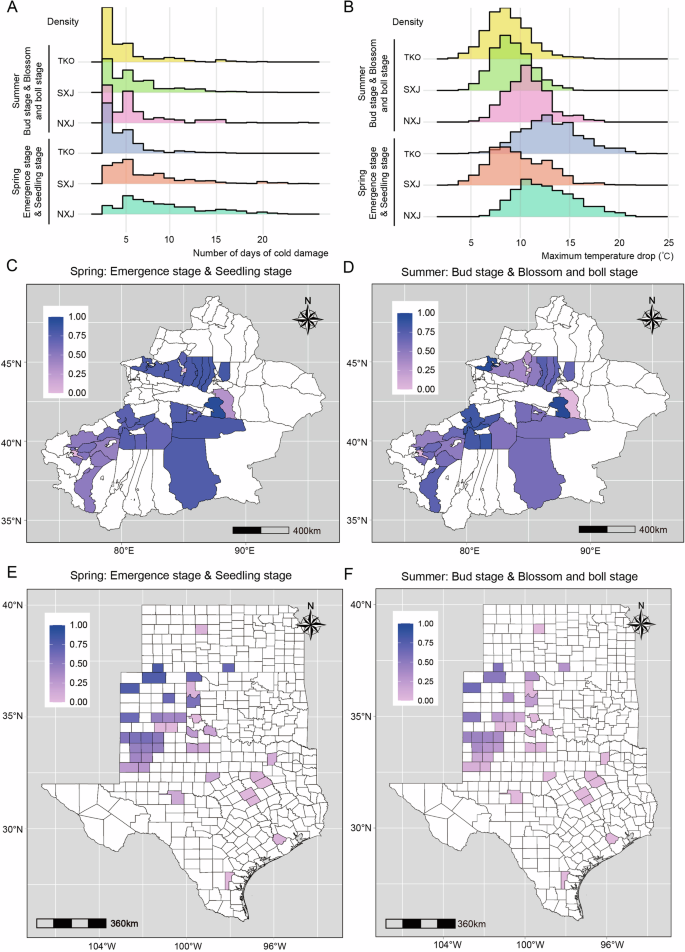
A Frequency distribution diagrams of DAY-SPR and DAY-SUM in NXJ, SXJ and TKO. B Frequency distribution diagrams of MTD-SPR and MTD-SUM in NXJ, SXJ and TKO. Annual frequency of SpCD (C) and SuCD (D) in Xinjiang (1981–2020). Annual frequency of SpCD (E) and SuCD (F) in TKO (1981–2020). The white part of (C–F) indicates that it is not divided into areas for calculation. The figure is drawn using R project and Adobe Illustrate. All the data in this figure are listed in Supplementary Data 3–5.
The temperature drop range can reflect the degree of each temperature drop. When the maximum temperature drop is too large, it often indicates that the growth period of the year has suffered strong cooling weather with severe cold damage, which will pose a great threat to the growth and product of cotton. The maximum temperature drops of NXJ, SXJ and TKO in spring are generally between 9–15 °C,7–13 °C and 10–15 °C, respectively. The maximum temperature drops of NXJ, SXJ and TKO in summer are generally between 8–13 °C,7–12 °C, and 7–11 °C (Fig. 3B). The maximum temperature drop in NXJ is slightly greater than that in the SXJ in both spring and summer. This result means that the temperature of NXJ fluctuates greatly, and the degree of cold damage is often higher than that of SXJ.
Cold damage at emergence stage in Xinjiang makes a major impact on cotton production
To investigate whether cold damage affects cotton production in Xinjiang, the correlations between cold damage indicators and cotton yield per unit at different growth periods in 33 counties in Xinjiang were calculated. In most areas of Xinjiang, EAT and AAT were positively correlated with cotton yield per unit, while cold damage days and maximum temperature drop were negatively correlated with cotton yield per unit (Fig. 4). In most counties, the absolute correlation between the days of cold damage and the maximum temperature drop in spring and cotton yield was greater than that in summer, such as Shayar and Wensu (Fig. 4). These results indicate that SpCD, that is, the cold damage occurring at emergence stage and seedling stage, has a more profound effect on cotton yield than SuCD (Summer cold damage). Another promising finding was that the correlation between accumulated temperature and yield per unit was generally larger at emergence stage than that at seedling stage (Fig. 4A). This trend was more obvious for 22 counties in south Xinjiang. Take Wensu as an example, the correlation coefficients (R) of EAT of emergence stage and AAT of emergence stage were 0.58 and 0.7, while EAT of seedling stage and AAT of seedling stage were 0.27 and 0.22 (Fig. 4B). It revealed that cold damage at emergence stage makes a major prevention on cotton production.
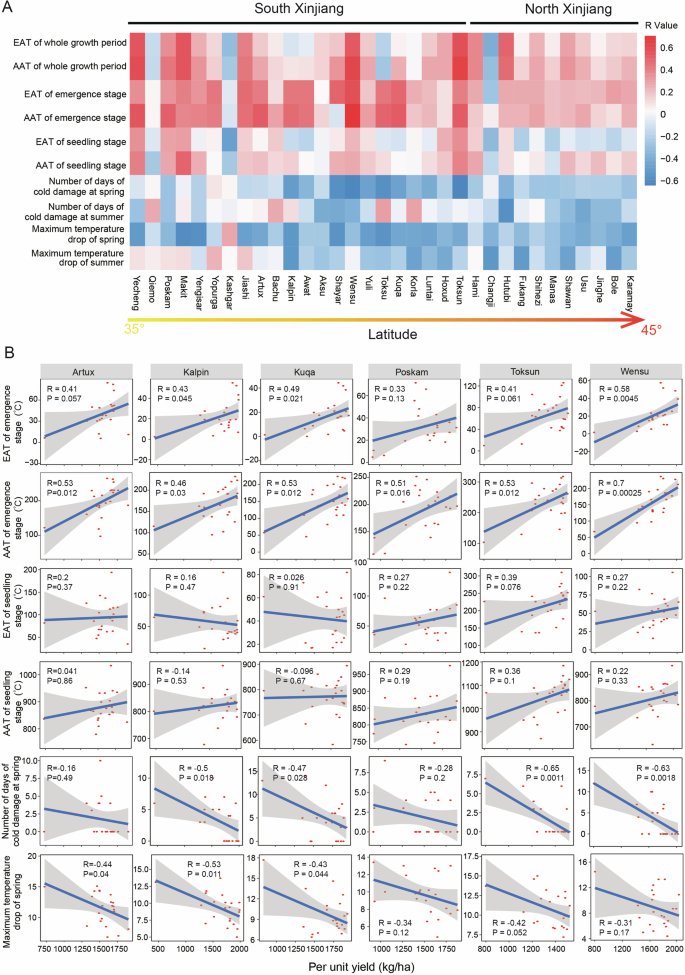
A The correlation heat map of cold damage index at different growth stages with cotton yield per unit in Xinjiang. B Correlation between yield per unit of Artux, Kalpin, Kuqa, Poksun, Toksun and various indicators of SpCD. The figure is drawn using R project and Adobe Illustrate. All the data in this figure are listed in Supplementary Data 6.
SpCD has a significant impact for the cotton industry in Xinjiang
Based on the results presented in the previous section regarding the frequency of SpCD and SuCD, as well as their impact on cotton production in Xinjiang, the accumulated temperature anomalies in North Xinjiang (NXJ) and South Xinjiang (SXJ) over 40 years were calculated (Fig. 5). The results indicate that SpCD occurs approximately every 2.6 years on average in Xinjiang (Fig. 5A, Table S5). Furthermore, by consulting the Xinjiang Statistical Yearbook and the China Meteorological Yearbook, several documented instances of SpCD’s effects on the cotton industry in Xinjiang were identified.
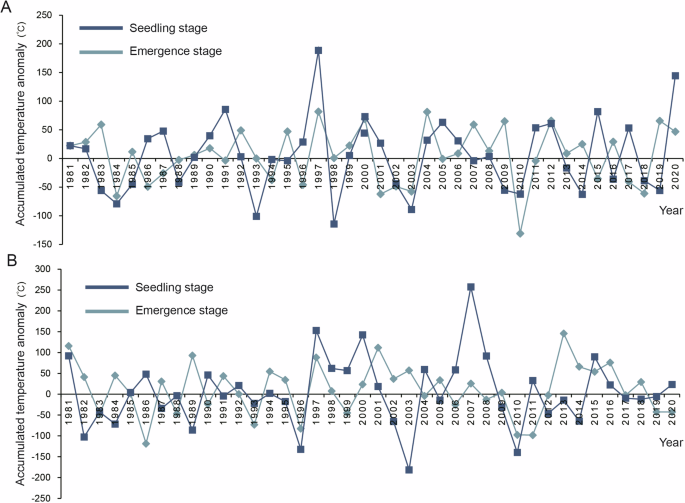
Accumulated temperature fluctuation in NXJ (A) and SXJ (B) during 1981–2020. All the data in this figure are listed in Supplementary Data 5. See Methods for the calculation method.
The severe SpCD that affected the major cotton-growing areas of SXJ in 1996 resulted in a 40% decline in cotton yield per unit area, leading to direct economic losses exceeding 1.5 billion yuan25. In 2010, the accumulated temperature anomalies in NXJ and SXJ were significantly lower than in other years (Fig. 5). An extremely severe snowstorm in NXJ during the winter delayed the onset of spring, leading to consistently low temperatures from March to May that year. This prolonged cold period hindered spring sowing and posed a serious threat to the growth of cotton seedlings, ultimately resulting in decreased production26. SpCD occurs frequently in the cotton-growing regions of Xinjiang. During the later stages of planting, significant efforts are made to mitigate losses from cold disasters through timely replanting and enhanced field management. However, the economic losses associated with SpCD are substantial and difficult to quantify.
Discussion
In this study, for the first time, agroclimatic data were compared between different countries to clarify the characteristics of cotton production in different countries and the different future breeding strategies. The cotton region of Xinjiang lies at 36°51’–46°17’N, 75°59’–95°8’E, spanning 1630 kilometers (km) from east to west and 1115 km from north to south. It is located in the arid and semi-arid region of China27. The regions with extensive cotton cultivation are primarily located in the basin and along the edges of the Tianshan Mountain range, such as Weili County, Korla City, Aksu City, Shihezi City, Jiashi County, etc (Fig. 1C). South Xinjiang (SXJ) and North Xinjiang (NXJ) are geographically divided by the Tianshan Mountains. There is a significant climatic difference between NXJ and SXJ, resulting in variations in the sowing time and subsequent growth periods of cotton in these regions (Fig. 1F). The textile industry in the United States is well-developed and industrialized, making it the largest global exporter of fiber annually. U.S. cotton is grown predominantly in 17 southern-tiered “Cotton Belt” States, from Virginia to California28. Cotton Belt has fertile soil, warm climate and natural conditions suitable for cotton growth. TKO, often referred to as the plateau cotton area, accounts for approximately 49% of the total cotton production in the U.S. and covers more than 62% of the country’s cotton planting area, making it a cornerstone of the U.S. cotton industry29. The cotton region of TKO lies on 25°50’–37°25’N, 96°25’–102°75’E, spanning about 850 km from east to west and 1290 km from north to south, at an altitude of 1500 3500 m.
The analysis of this study indicates that the thermal conditions in the TKO region of the United States are sufficient, and the frequency and severity of cold damage are significantly lower than in Xinjiang. Consequently, there is no pressing need for the U.S. cotton industry to pursue strategies for cold tolerance. However, the U.S. cotton industry has also faced some inherent challenges, including water scarcity, pest issues, and labor shortages. These issues have been effectively addressed through technological advancements and policy adjustments, which have reinforced its position as a leading cotton producer. These experiences and solutions are worth learning from for Xinjiang in tackling cold damage challenges. First, improve cultivation techniques. The U.S. introduced water-saving irrigation technologies such as drip and sprinkler systems to mitigate water scarcity. The U.S. also adopted biological control methods by releasing natural predators of the cotton bollworm to control its population30. Second, improve breeding technology and its application. In the late 1990s, the U.S. pioneered the use of genetic engineering to develop genetically modified cotton varieties, such as Bt cotton, which are resistant to cotton bollworm infestations31. Third, mechanized production reduces costs. Traditional cotton planting and harvesting rely heavily on seasonal labor, but by the mid-20th century, the U.S. had already adopted large-scale mechanization30. In recent years, there has been an increased application of automation and artificial intelligence technologies. Xinjiang should further adopt advanced mechanized and standardized technologies to reduce labor costs and promote the sustainable development of the industry.
The climatic conditions of Xinjiang are generally conducive to agricultural development. However, the dynamics of seasonal changes are also crucial for farming in spring. In each growth phase of cotton, the heat resources are far less than TKO, especially at the emergence stage. Considering the frequent cold damage to cotton seedlings in Xinjiang, we propose the following cultivation management techniques to reduce the impact of cold damage on the cotton industry in Xinjiang (Fig. 6). Firstly, continuously improve the basic cultivation technologies of mulching and drip irrigation under the mulch. In order to make full use of thermal and water resources, Xinjiang has already adopted mulching and drip irrigation under the mulch cultivation techniques. These techniques significantly increase soil temperature, retain soil moisture, and assist in weed management3. Future efforts should focus on promoting the use of biodegradable, durable film materials in conjunction with intelligent control systems to regulate the timing and thickness of mulch application precisely. Secondly, reduce the planting area in regions prone to frequent cold damage. Climate conditions are closely related to geographical location, so cotton should not be planted in areas with extreme northern climates, such as Tacheng and Altay. Conversely, there is potential for expanding the planting area in regions with more favorable heat conditions, such as Artux, Shayar, and Yecheng. Third, accurately forecast the optimal sowing time. To adapt to the variable spring temperatures and short frost-free period characteristic of Xinjiang’s climate, there is a tradition of early sowing at the right time3. Therefore, the accuracy of agricultural weather forecasting should be further improved to predict sowing times. In the case of extreme weather, timely warnings should be issued to ensure proper protective measures. Additionally, the application of mechanized precision sowing technology should be accelerated to shorten the sowing time.
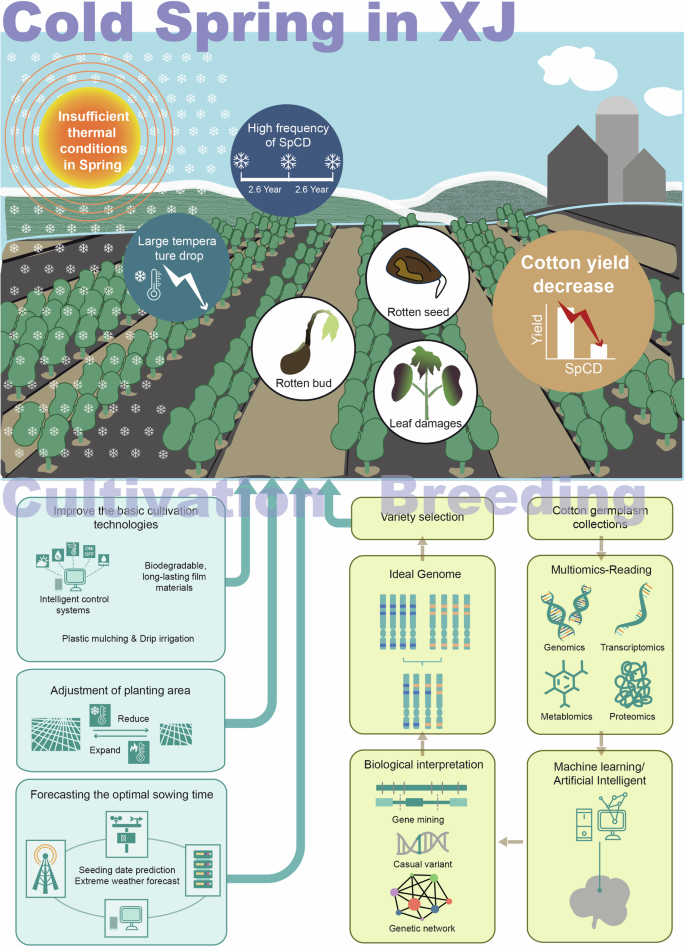
The main conclusions of this study are summarized at the top of this figure, which shows the problems in spring, that is, the cotton emergence stage in Xinjiang: insufficient heat condition, high frequency of cold damage, huge temperature drop, and cold damage are highly correlated with cotton yield, which has a serious impact on the yield. The following is a detailed display of cultivation techniques and breeding methods in order to cope with the spring cold damage in Xinjiang and further promote the sustainable development of Xinjiang cotton industry. The figure is drawn using Adobe Illustrate.
Appropriate management and agronomic measures can minimize crop losses associated with cold environments. Nevertheless, agronomic measures alone do not protect plants from cold adequately. Therefore, breeding and improving early-maturing and cold-tolerant varieties are essential. By collecting cotton germplasm resources and employing multi-omics approaches (such as phenomics, genomics, transcriptomics, and metabolomics), and utilizing artificial intelligence and machine learning, genes related to cold tolerance and early maturity in cotton can be identified (Fig. 6). Meanwhile, the regulatory mechanisms of cold stress resistance should be studied from genetic, epigenetic, physiological, and cellular response perspectives (Fig. 6). On one hand, varieties that are early-maturing, cold-tolerant, or both should be selected; on the other hand, new varieties can be developed through transgenic and gene-editing techniques. A few studies have been conducted on cotton’s tolerance to cold stress. In recent years, some genes have been identified and reported to be involved in cold stress tolerance of cotton, such as GhSAD132, GhDREB133, GhHyPRP416, GhGTG134 and a functional lincRNA, XH12335. Fan et al. found that cold stress affects the variations of DNA methylation in cotton36. A comparative study reveals that the sea-island cotton and upland cotton share some conserved cold-responsive mechanisms on the natural antisense transcript (NAT) in forming a fine regulation network with endogenous cold signaling pathway via SnRK37. An AI-based prediction of cold-responsive genes in Gossypium species (G. arboretum, G. hirsutum, G. barbadense) was reported38, providing insights into future techniques for uncovering cold tolerance genes and epigenetic marks. Additionally, researchers are screening cold-tolerant varieties using various methods39,40. However, a significant knowledge gap remains in understanding the molecular regulation of cold stress in cotton.
It should be noted that each cold damage index is only a statistical value, and the above results are calculated only when considering the influence of a single factor, temperature on yield. But in fact, cotton production is the result of a variety of factors, including management techniques of cotton production, insects, disease, and other meteorological factors. Considering the full impact of these factors is extremely difficult.
Conclusion
The cotton industry in Xinjiang holds a significant position in the global market. However, the region faces challenges due to its short frost-free period and significant seasonal temperature fluctuations, which impact the development of the cotton sector. This study analyzes the temperature variations, thermal conditions, frequency and severity of cold damage, as well as their correlation with cotton yield during the the emergence, seedling, bud, and blossom and boll stages in Xinjiang. A comparative analysis is also conducted with TKO, a high-yield region in the U.S. Although Xinjiang’s thermal conditions meet the requirements for the entire cotton growing season, they are still below TKO levels, especially during the emergence period, when heat is insufficient. The frequency and severity of SpCD in Xinjiang are significantly greater than those in TKO, causing serious impacts on cotton production. Therefore, continuous innovation and improvement of cultivation techniques, as well as breeding early-maturing, cold-resistant varieties, are key strategies for the sustainable development of Xinjiang’s cotton industry.
Methods
Area of research and data sources
Selection of meteorological stations and acquisition of meteorological data
A total of 33 meteorological stations in Xinjiang were selected, including 11 in North Xinjiang and 22 in South Xinjiang (Table 1, Table 2). The selection was based on cotton planting area of counties in Xinjiang. The meteorological data of Xinjiang from 1981 to 2020 were obtained from the National Meteorological Administration of China.
As the upland cotton production in the southwestern cotton region of the United States accounts for 50% of the total cotton production in the United States41, the southwestern cotton region of the United States, including Texas, Kansas and Oklahoma (TKO) were selected for the comparison42. Similarly, 34 counties (Table S1) from TKO were selected for subsequent analysis based on cotton planting area of each county. Their meteorological data is derived from the ERA5 dataset43. Except for southern Texas, where sowing time began in late February, all regions began in April (Fig. 1F). The outliers were greater than 100 and less than -100 were filtered out from the temperature data.
Acquisition of cotton production data
The data of production, yield per unit area and planted area of cotton in Xinjiang used in this study were obtained from the Xinjiang Statistical Yearbook (https://tjj.xinjiang.gov.cn/tjj/tjfw/list_tjfw.shtml) and the Xinjiang Production & Construction Corps Statistical Yearbook (http://tjj.xjbt.gov.cn/zwfw/sjcx/tjnj/) published by China Statistics Press. The cotton production of different China provinces in 2016–2020 was obtained from the China Statistical Yearbook (http://www.stats.gov.cn/tjsj./ndsj/). Data on global cotton production comes from the United States Department of Agriculture.
Methods for calculating thermal conditions
Thermal conditions are essential for plant growth and development. The accumulated temperature is the sum of the daily average temperatures in a certain period. A crop requires a certain lower temperature to start its development and a certain amount of accumulated temperature to complete a certain period of growth and development, which indicates the total thermal requirement of the crop during its whole growth period or a certain stage44. We calculate the active and effective accumulated temperatures to learn about the thermal conditions in Xinjiang and TKO. The following index values are calculated and visualized using the R language.
Active accumulated temperature (AAT)
AAT is the sum of the temperature higher than the biological lower limit in a certain growth period, which is an important indicator of vegetation growth45. In this study, we calculated AAT of emergence stage (>10 °C), seedling stage (>10 °C) and whole growth period (>10 °C). The formula is as follows:
(In the formula, ti is the daily mean temperature; B is the biological lower limit temperature; and n is the number of days in that reproductive period when ti > B).
Effective accumulated temperature (EAT)
Effective temperature is the difference between the daily mean temperature and the biological lower limit temperature46. Effective accumulated temperature (EAT) refers to the sum of effective temperature of crops in a certain period47. In this study, we calculated EAT of emergence stage (>12 °C), seedling stage (>19 °C) and whole growth period (>10 °C). The formula is as follows:
(In the formula, ti is the daily mean temperature; B is the biological lower temperature limit; and n is the number of days in that reproductive period when ti > B).
Accumulated temperature anomaly
The anomaly is the difference between the value of a meteorological element and its mean value. The accumulated temperature anomaly calculated in this paper is the difference between the accumulated temperature of crops in a certain period and the mean value of the accumulated temperature in the previous five years48.
Methods for calculating cold damage indicators
According to the definition of delayed cold damage, it is stipulated that the daily mean temperature is lower than 10 °C for more than three consecutive days during emergence stage and seedling stage, that is, spring cold damage (SpCD) occurs. Similarly, daily mean temperatures below 20 °C for more than three consecutive days during the bud stage and blossom and boll stage are the criteria for summer cold damage (SuCD). From this, the number of days in a year that SpCD and SuCD occur can be calculated. The interannual frequency of cold damage is calculated by the formula: A/B (A is the number of years in which cold damage occurred; B is the number of total years).
The drop of mean daily air temperature is the difference between the highest and lowest values that occur in a continuous drop in the daily mean temperature over a period of time. From the previous temperature drop processes, the maximum value of the drop of mean daily air temperature is taken as the maximum temperature drop of the period.
The cold damage indicators mentioned above are calculated and visualized using R language.
Correlation test and method
The correlation between cotton yield per unit area and cold damage indicators was analyzed using the R language. The Pearson method was chosen to calculate the correlation coefficients for the data and to test the significance of the correlation coefficients.
")

Responses