Multi-layer regional railway network and equitable economic development of megaregions

Introduction
Megaregions have become increasingly influential in the process of industrialization and urbanization, given their substantial agglomeration economic benefits1 and vital role in promoting cities and human settlements inclusive, safe, resilient, and sustainable2,3. In megaregions, transportation infrastructure plays a significant role in the regional economy by providing mobility for travelers and goods movement4,5. Over the past few decades, regional economic growth has been driven not only by single city-based factors such as land development but also by network-oriented factors like the rapid expansion of intercity transportation infrastructure in megaregions1,6. Substantial financial investment has been directed towards regional railway networks that integrate various tiers including regular-speed railways, intercity and corridor high-speed railways (HSRs), collectively referred to as the multi-layer regional railway network (MRRN)7,8. These different tiers are designed to cater to diverse intercity mobility demands, with varying levels of affordability, speed, and comfort preferences, thereby ensuring citizens’ equitable access to transportation and mitigating spatial inequalities in economic output and productivity enhancement. Cities and regions around the world have recently witnessed regional railway networks expand rapidly and put into operation9.
In general, the MRRN10,11 contains corridor and intercity HSRs12, regular-speed railways13, and urban transit railways, and the four tiers play different roles and have various spatial distributions. Corridor HSRs refer to railway systems operated at speeds of 250 km/h or higher, primarily serving long-distance and high-capacity passenger transportation demands. Intercity HSRs refer to railway systems operated at speeds around 200 km/h. They primarily connect neighboring cities to serve short-to-medium distance passenger transportation demands. The regular-speed railways encompass railway systems operated at speeds of 160 km/h or lower, primarily serving regional passenger transportation demands. It is designed to ensure affordable and accessible transportation options for all residents, especially low-income people. Urban transit railways refer to railways operated within urban areas and their suburbs, typically including subways, light rail, and trams, primarily serving short-distance passenger transportation in high-density urban areas. In the MRRN context, the corridor high-speed railway network (CHSRN)14 and intercity high-speed railway network (IHSRN)15 are viewed as separate layers given their differences in service coverage and functions. The CHSRN has relatively greater significance in supporting the nationwide railway network and is featured by more frequent train services. The IHSRN is set to connect nearby cities in megaregions and usually services for intercity commuting or business travel. The urban transit railway networks (UTRN) serve the urban areas, facilitating high-frequency, short-distance travel within cities and immediate suburbs. The regular-speed railway networks (RSRN) connect larger urban centers and smaller cities, providing medium-speed services. The RSRN supports both passenger and freight transport, playing a vital role in regional economic integration and development.
Numerous studies have justified that railway investment can promote local economic growth16,17,18,19 and social welfare20. Empirical evidence has been found both in the developed world, including Europe21,22,23,24, Japan, and South Korea25,26, and in developing countries such as China27,28,29. Specifically, Guan and Li28 used a dynamic panel data model to explore the spatial spillover effects of the construction of Harbin-Dalian (Ha-Da) HSR on the regional economy in Northeast China. The results showed existing extensively positive economic effects of HSR construction in the local and neighboring areas. Berger and Enflo24 examined the short-term impacts of the first railroad in Sweden using a difference-in-differences approach. Their findings indicated that connected towns experienced relative gains in the short term, potentially driven by a relocation of economic activity from nearby non-connected towns. Hence, some professionals argue that railway construction can lead to disparities, with some regions benefiting while others suffer30,31,32,33. Cavallaro, et al.19 proposed that railways might exacerbate differences in travel times, number of connections, prices, and population between central and surrounding areas, potentially leading to social inequalities and population reduction in the medium to long term. Similarly, Cascetta, et al.17 found that HSR in Italy significantly increased transport accessibility for zones along the HSR network, with only marginal benefits for others. While numerous studies have discussed the effects of railways on economy and social development, and shared their different results in local and surrounding areas, most of them focused on the single railway type, such as high-speed railway or regular intercity railway connecting towns or cities, limited literature analyzed the effects of multi-layer regional railway network17,19,34,35. As intercity high-speed rail and urban transit rail networks evolve and integrate with regular-speed railways, their combined impact is expected to be significant. However, research on achieving balanced and equitable integration, as well as its economic development effects, remains limited. With the rapid global development of MRRN, it is crucial to address how these networks can ensure equitable development opportunities for all cities within a megaregion, guaranteeing that each city benefits fairly from this integration.
Our theoretical contribution to the existing literature is threefold. First, we propose a multi-layer complex network model as a manifestation of integration between layers of regional railway networks. It takes CHSRN, IHSRN, RSRN, and UTRN as different layers and uses a hyper-adjacency matrix to represent the structure of the MRRN. Based on the model, we extract several metrics, including Shannon entropy, node centrality, and clustering coefficient to measure the level of network-wide integration by city and year. Second, we estimate a Spatial Dynamic Durbin Model (SDDM) and particularly examine the impacts of newly developed railway lines and network integration metrics on economic growth over time. In this fashion, it is possible to identify both localized effects and spillover effects when new lines are added, and cities are better integrated into a regional network. Third, we analyze the heterogeneity in the trajectories of economic growth among cities and justify the hypothesis of the core-periphery growth model36,37. This study would help understand how cities that are interconnected into a regional railway network can grow in a more synthetic, balanced, and sustainable way. By examining the development of MRRN across different stages of urban and regional growth, we provide a long-term perspective on how these networks can ensure equitable development opportunities for all cities within a megaregion. This approach moves beyond a single snapshot in time, offering insights into the dynamic processes through which MRRN fosters sustainable and inclusive economic growth over the long term.
Our practical contributions are twofold. First, by analyzing how MRRN reshapes megaregions through a two-stage process, this study provides a comprehensive view of promoting more equitable and sustainable development in megaregions. This can be achieved through the strategic construction of HSR networks and the integration of MRRN, with specific recommendations for both central cities and surrounding areas. Second, the study offers valuable guidance on the direction for HSR network development, intending to maximize their impacts while ensuring equity. In particular, the paper outlines two distinct strategies tailored to the varying development levels of cities in a megaregion.
Results
The Yangtze River Delta (YRD) is selected as the study case. The panel data of the study area is shown in Supplementary Tables 1,2. The YRD is a rapidly developing region with a diverse range of cities at various developmental stages, offering an ideal condition to investigate the influence of MRRNs on regional economic growth and equity. Besides, its extensive, multi-modal railway infrastructure enables the examination of the impact of different railway types. The synchronized economic and railway development within the YRD also provides a unique background for assessing economic growth and equitable regional development, while its strategic role in international trade positions the YRD as a pertinent case for applying findings to other megaregions worldwide.
In this study, we selected the period from 2008 to 2019 to ensure data stability and reliability, as 2008 marks the start of large-scale high-speed rail construction in China and data post-2020 is disrupted by the COVID-19 pandemic. The socioeconomic attributes (e.g. GDP, population, and investment) are sourced from the city statistical yearbooks published by the National Bureau of Statistics. Since the statistical standards are synchronously set by the government, these variables have no missing values. The topological structure of the Yangtze River Delta railway network is derived from the operation data released by China Railway Shanghai Group Co. The values of the dummy variable HSR and IUR are calculated based on whether the corresponding speed-grade trains are operating on the corridor/intercity high-speed railway network. Based on the algorithms described in Methods), we propose three indicators: Shannon entropy, clustering coefficient, and PageRank node centrality to describe the extent of a city integrating into the MRRN. Among them, the Shannon Entropy measures how evenly the connectors (rail stations) between a city and the MRRN are distributed across the four layers of the network. It is an indicator of the strong and balanced connectivity of a city with the MRRN. The clustering coefficient estimates the relative insignificance of a city in the surrounding subnetwork in an MRRN. The clustering coefficient reflects the localized spatial spillover effects of a city on adjacent cities, rather than the effects on all cities being estimated. PageRank node centrality, on the other hand, measures the global significance of a city in the MRRN system. It should be noted that the centrality and the clustering coefficient emphasize the relative importance of a node in different dimensions.
With these indicators as explanatory variables of the most interest, we estimate a set of models to examine the effects of the multi-layer regional railway networks (MRRN) on the economic development of cities in the network. The dependent variable in all the models is the city-level economic size28,38. When estimating the impacts of new connections to the MRRN24,39,40, we consider measuring connections to the CHSRN and the IHSRN separately, instead of merging them as in previous studies6,19,20. Two dummy variables HSR and IUR are introduced to indicate the first connections of a city to the CHSRN and IHSRN, respectively. The HSR and IUR are dummy variables used in the spatial dynamic Durbin model, taking the value of 1 if the city has an operational corridor/intercity high-speed railway respectively in that year and 0 otherwise. Considering that the Yangtze River Delta has already developed an almost full-fledged RSRN by 2008, we choose not to include a similar dummy regarding the RSRN. Furthermore, to estimate the differences in the impacts of HSR and IUR across cities of various sizes, interactive items between population and HSR/IUR are involved in the model as new explanatory variables HSR-POP and IUR-POP. Finally, we include population size, governmental investment, and population density as control variables, given their intimate relationship with economic growth.
To explore the most intuitive relationship between the dependent and independent variables, we employ the least squares method first to estimate a naïve baseline model denoted as Model I (see Table 1). We then develop Model II by introducing a first-order temporal lag, given that the effects of explanatory variables on GDP can be temporally lagged. This is a common practice in the literature for exploring the factors of economic output. In Model III, we consider the spatiotemporal lag of GDP, as well as explanatory variables, per the assumption that their relationships are subject to a spatial dimension in addition to temporal lags.
Based on the models described above, we highlight the following results that are worth attention:
-
1.
The level of integration into the MRRN is positively correlated with city size and economic competitiveness. From a temporal perspective, every city has been better integrated into the regional railway network, though at different paces. From a spatial perspective, the key nodes of the network have emerged, and their neighboring cities have gained advantages in improving regional connectivity. This suggests that the MRRN has been playing an increasingly important role in driving the synthesized development of a megaregion through network-based reorganization rather than the traditional single city-based mode.
-
2.
Integration into the MRRN has the potential to foster economic competition among cities, which may inadvertently increase regional economic disparities. While the enhanced connectivity provided by MRRN facilitates economic interactions and can drive growth, it also creates competitive dynamics that can favor more developed areas, potentially leading to uneven development across the region. Therefore, it is crucial to consider the balance between connectivity and equitable growth to ensure that all cities within a megaregion benefit fairly from the integration.
-
3.
The premium in access to the MRRN allows the key node cities of the megaregion to attract resources from their surrounding cities and achieve more rapid development in the short run. The hinterland, however, in the long term, would benefit from those “growth poles” when the overall integration into the network improves and the poles evolve into a subregional redistributor of resources.
A spatiotemporal analysis of MRRN integration indicators
Cities integrated into the MRRN demonstrate different time-varying characteristics. To make the patterns more explicit, we classify all cities in the region into three relative categories using the K-Means method according to their sizes and paces of economic development: developed cities (as Group 01 in Fig. 1) with high GDP size and medium GDP growth rate, developing cities (as Group 02 in Fig. 1) with medium GDP size but high GDP growth rate, and underdeveloped cities (as Group 03 in Fig. 1) with lower GDP size and lower GDP growth rate. The time-varying relationships between PageRank node centrality, Shannon entropy, clustering coefficient, and LN_GDP from 2008 to 2019 are illustrated in Fig. 2a.

a The spatial distribution of the cities in three groups classified by the K-Means algorithm based on their economic development speed and scale, and basic information of RSRN in each city. b The relationship, and spatial distribution of high-speed railway and regular railway.
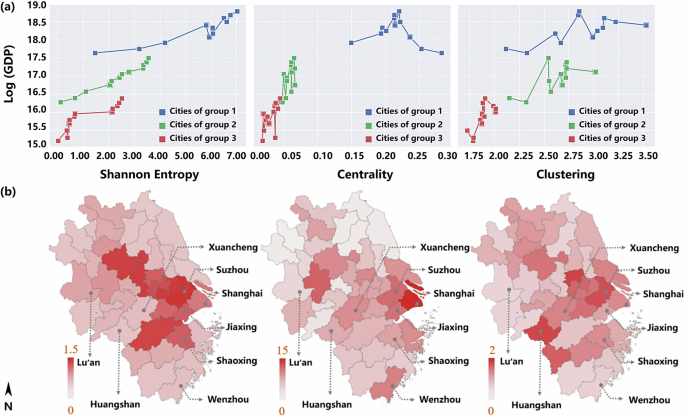
a The time-varying relationships between GDP(in log form) and MRRN integration indicators of different city groups. b The spatial comparison of MRRN integration indicators of the Yangtze River Delta megaregion in 2019.
Overall, three indicators of each city show a spirally upward trend over time, indicating the integration into the MRRN is improving regarding all cities in the megaregion. The pathway of integration varies across city categories: size and economic development can be good proxies for regional railway connectivity. For instance, Shanghai is the economic core of the Yangtze River Delta megaregion with the largest population size and GDP level. Although it is located on the periphery of the region, Shanghai still gets the highest scores of all three indicators between 2008 and 2019. On the other hand, Xuan Cheng, a city situated in the heart of the region, remained poorly connected to the regional railway network despite significant improvement in recent years. Economic influence should play a key role in creating those differences.
Indicators of MRRN integration present similar patterns in spatial distribution as in Fig. 2(b). First, centrality, Shannon entropy, and clustering coefficient are, to different degrees, correlated with the proximity to the economic core of Shanghai. Second, the patterns are also subject to polycentricity; subcenters of railway connections, Suzhou, Nanjing, and Wenzhou, can be found in the north, west, and south respectively. Finally, the spatial variations in Shannon entropy between cities appear to be much more significant than the other two indices. This indicates that most cities in the region, except for Shanghai and Nanjing, have not been connected to the regional network in a balanced way. In many cases, they have no more than one station in each layer of the network. Overall, the integration level of MRRN is highly subject to both spatial and longitudinal variations, which need to be accounted for in the statistical modeling below.
How does MRRN integration contribute to regional economic development?
According to Table 1, Model II, which accounts for spatial autocorrelation of independent variables, performs significantly better than Model I, in terms of log-likelihood values. It should be noted that the decrease in observations from Model I and II (492) to Model III (451) is due to the inclusion of time-lagged terms, a standard approach in spatial econometrics to account for temporal dependencies without compromising result robustness. Model III, on the other hand, contributes more to the explanation of current economic output through incorporating temporal lagged effects, compared to Model II. Model III, in the end, delivered the best results according to the highest log-likelihood value, indicating the importance of considering spatial and temporal lag effects. Hence, the following description of statistical analysis will be based on results from Model III.
As for control variables, population size and investment, are positively associated with economic output at a significant level. GDP will increase by 0.200 and 0.037%, respectively when the two control variables increase by 1%. It indicates that investment may not be strongly effective in boosting economic growth in the long term. Attracting the population, however, is found to be a more promising strategy instead. In addition, the population size and density of neighboring cities are negatively correlated with the GDP of a city.
As proxies for the integration level into the MRRN, Shannon entropy, node centrality, and clustering coefficient are explanatory variables of particular interest. Shannon entropy is positively correlated with GDP at the local scale, suggesting a balanced connection to the MRRN would contribute to economic growth. When a city is well connected to the regional railway network, it would have relative advantages in attracting flows of people and goods, and thus in economic growth. In the meantime, the GDP of a city, however, is negatively associated with the Shannon entropy of neighboring cities. This is an indication of competition over economic resources between cities in close vicinity. For instance, when a city has a “strong” neighbor with good connections with the regional railway network, its attractiveness to economic resources may fade away to a certain degree.
Table 1 also shows that MRRN centrality and clustering indicators of a city are not significantly associated with its GDP, but those indicators of its neighbors are found to be influential. When the centrality index of a city’s neighbors increases by one unit, the city’s GDP would drop by 0. 4%. On the contrary, a unit increase in spatial lagged clustering index would be associated with 0. a 5% increase in local economic output. These findings reaffirm the competition between neighboring cities given the variations in connectivity to the MRRN across those cities. The centrality and clustering effects make a difference through the regional competitive relationships rather than local economic processes.
The mechanism of how MRRN integration and access to high-speed railway network promote megaregion’s economy in different development stages
The impacts of MRRN on the regional economy do not simply depend on the overall integration status of cities into the network but also is subject to new connections of those cities to either CHSRN or IHSRN. We take the interactive items between the total population and dummy variables HSR and IUR (denoted by variables HSR-POP and IUR-POP) in Model III to contrast large cities with smaller ones in terms of the effects of first-time corridor and intercity high-speed railway connections.
According to traditional perceptions, access to CHSRN and IHSRN may both bring new economic opportunities to the city and promote growth. However, longitudinal analysis in the regression results in alternative findings. These novel findings are subject to the research design in which the influences of CHSRN and IHSRN on economic development are isolated from each other when measuring the overall impacts of MRRN. After all, high-speed railway lines serve as the backbone of the nationwide railway network and are most responsible for the communication of economic activities between regions. Access to CHSRN, as expected, would have significant and positive connectivity effects on the economic growth of the cities that never had been connected to CHSRN. Whether large cities or smaller ones would benefit more from the connectivity effects is nonetheless largely unknown.
The IHSRN mainly accommodates travel demand between cities within a megaregion. The improvement of accessibility within the megaregion could bring about siphon effects, though to different degrees. When a new high-speed railway line is built to link two cities, the movement of people and goods will be improved, and economic interactions will be promoted between them. According to existing theories, the larger city in this pair may gain particular advantages in attracting economic flows and thus receive premiums of growth. However, how such interactions work in the Yangtze River Delta megaregion under study is still under question.
In this sense, the population size of a city may matter in the connectivity and siphon effects. Results in Table 1 show that when population size increases, the overall positive effects of connections to CHSRN would decrease, while the composite negative effects of connections to IHSRN would decrease as well. It means the larger a city is, the weaker the benefits of CHSRN connections and the stronger benefits of IHSRN connections would the city be exposed to. For instance, a city with 1 million people would enjoy economic growth of 1.577% when it is first connected to the CHSRN while suffering from a GDP decline of 1.906% when attached to the IHSRN for the first time. Those effects regarding a city with 1 million, however, would be 1.299 and 1.613% respectively.
Considering both of the coefficients of HSR and HSR-POP, we locate each city in Fig. 3 where composite effects of first connections to CHSRN and IHSRN are shown. Cities are distinguished from each other using the standards of zero net effects and a GDP of 400 billion RMB (LN_GDP = 17.5). Although the time for accessing CHSRN and IHSRN is different, the classification of the same city in the two networks is the same. Cities located in the blue and green zones would be subject to a negative overall effect of CHSRN connections (see Fig. 4a). Cities in Group 3 are subject to positive overall effects of CHSRN access. Similarly, cities with different responses to CHSRN connections are categorized as well. In general, when first connecting to CHSRN, regional centers such as Shanghai and Suzhou would be exposed to negative impacts on GDP while the smallest cities in the region, such as Huangshan and Chizhou, would benefit the most. Almost the opposite effects apply to the connections to IHSRN. These findings confirm that the overall effects of new connections to CHSRN and IHSRN, in terms of both magnitude and sign, would largely depend on the size of cities
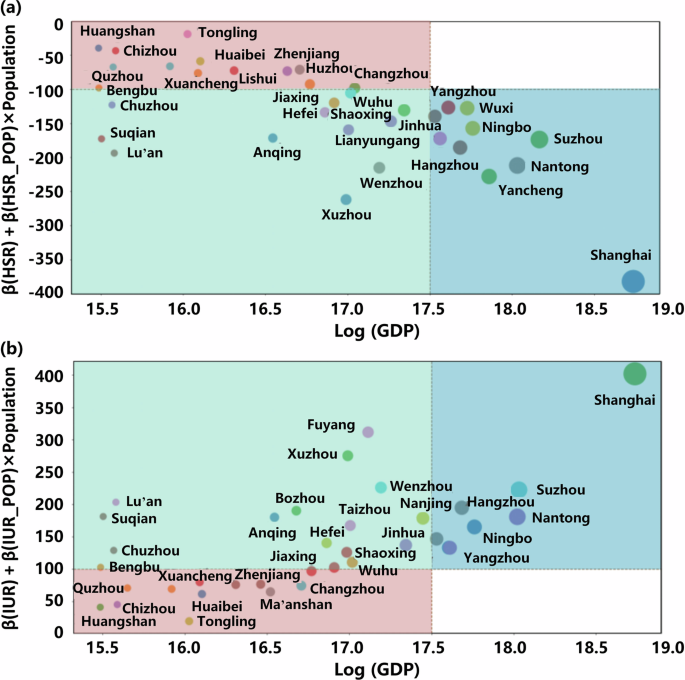
Cities’ GDP is positively correlated with the radius of each point in the figure. a HSR’s effect. b IUR’s effect.
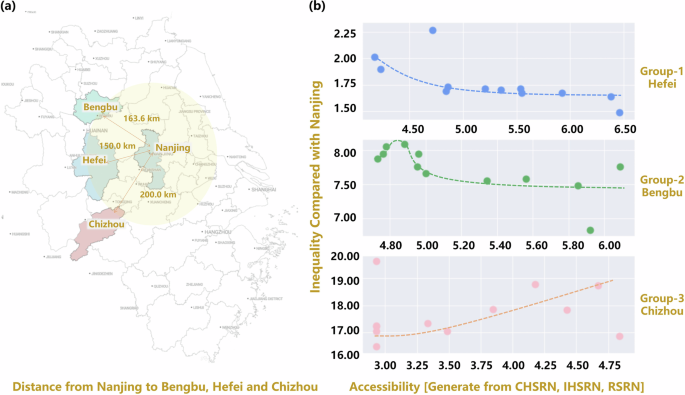
Cities are compared with Nanjing. a Geographical relationship between each representative city and Nanjing. b The accessibility and the gap between economic development compared with Nanjing of each representative city.
Discussion
Taking all the effects related to regional railway network connections together, we find an interesting pattern that corresponds to the classic “core-periphery” theory of economic geography. The spatial scale of the subregion with multiple cities is perfect for observing this pattern. The divergence of regional railway network connections over time can lead to differences in accessibility to the core city between periphery cities in a subregion area. Such differences can end up with relative advantages in economic growth.
As illustrated in Fig. 4, we analyzed the relationship between accessibility and the divergence in economic development among cities in relative proximity to Nanjing. Accessibility is quantified by the frequency of trains in the CHSRN, IHSRN, and RSRN networks, combined with the inverse spatial distance to Nanjing. Economic disparity is measured by the GDP ratio of each city relative to Nanjing. Hefei, Bengbu, and Chizhou, representing Group 1, Group 2, and Group 3 in Fig. 2 respectively, were selected as the study case. The findings in Fig. 3b reveal that the economic disparity between Hefei and Nanjing diminishes as accessibility improves, demonstrating that Hefei benefits from economic spillover effects due to enhanced connectivity with Nanjing. Conversely, the gap between Bengbu (in Group 2) and Nanjing initially widened and narrowed afterward, suggesting that Bengbu may experience an outflow of population and economic resources before benefiting from spillover effects. Meanwhile, the gap between Chizhou (in Group 3) and Nanjing has consistently widened, indicating that Chizhou remains in the stage of being siphoned by the core city since the onset of the observation period. These cases illustrate the distinct impacts of improved railway connectivity on cities at different stages of economic development.
In the early days, the accessibility of a megaregion is greatly improved with the opening of new high-speed railways between core cities and periphery cities, not only promoting the efficiency in passenger and goods movement but also resulting in the unfair distribution of economic opportunities across cities. As megaregions grow and transportation networks expand, the accessibility between cities in the region is further improved through MRRN integration. The fairness of urban development within the region could be improved. In other words, the effects of high-speed rail connections on economic growth can be nonlinear over time, and spatially balanced economic growth across the region may not be achieved until an extensive regional railway network is established.
The mechanism of high-speed railways promoting city economies has attracted much scholarly attention and interest over the past few decades. With the massive development of the national railway network in China, MRRN integration has emerged as a new economic growth engine in the past 10 years. The evidence from the Yangtze River Delta megaregion provides a valuable case for exploring how MRRN integration can impact regional economic development. From the estimation results of the SDDM, we found several interesting conclusions about the impact of MRRN on city economies.
If CHSRN and IHSRN are separated from the high-speed railway network, then we will find that access to CHSRN and IHSRN have opposite causal effects on cities’ economic development. This observation is supported by existing research suggesting that the impact of high-speed rail varies depending on the network type and the characteristics of the cities involved41,42. For instance, The Beijing-Shanghai High-Speed Railway (CHSRN), operational since June 30, 2011, has significantly contributed to Nanjing’s annual population growth from 21,000 pre-opening to 50,000 post-opening. The positive effect can be attributed to enhanced connectivity between major economic hubs, which stimulates economic activities and attracts labor inflows43. In contrast, the Hefei-Bengbu High-Speed Railway (IHSRN), operational since October 16, 2012, initially caused a population decline in Bengbu of 12,000 people in 2013 and did not resume significant population growth until 2015. This kind of negative impact may be due to the “siphoning effect,” where improved accessibility leads to resources and talent migrating towards larger cities, negatively affecting smaller ones44. In these cases, high-speed railways with different functional properties can play different roles in the network through the megaregion coordination and interaction process. Understanding these mechanisms is crucial, as studies have shown that while railways in CHSRN can stimulate growth in major cities, IHSRN may inadvertently exacerbate regional disparities if not properly integrated45. Thus, policymakers should pay enough attention to the design of high-speed railway network structures to promote sustainable development in the megaregion.
Findings from the theoretical and empirical analysis can potentially help understand the way megaregions are reorganized by HSR connections and achieve long-term balanced economic sustainability throughout the region46. Specifically, when a megaregion stands at the initial stage, priority should be given to constructing new HSR lines to establish central cities as economic hubs. Second, when the region develops to a more mature stage, the local governments in less developed and small-to-medium-sized cities should prioritize securing access to the high-speed rail (HSR) network. This access is likely to provide a significant economic boost by facilitating the flow of people, capital, and technologies. In addition, local governments should focus on the MRRN integration among non-adjacent cities within a megaregion, to foster economic cooperation among non-adjacent cities within a megaregion.
Our estimation results also suggest that each government of prefecture-level cities should strive for the opportunity to access a high-speed railway network. Especially for those less developed cities and small or medium-sized cities, access to CHSRN could provide a considerable economic boost through gaining more flow of people, capital, and technologies. As for cities with larger populations in the megaregion, our results show that their access to CHSRN and IHSRN would cause the opposite effects relative to small or medium-sized cities. This indicates that the size of cities needs to be carefully considered by local policymakers when evaluating the impacts of high-speed railway development.
In addition, we find that the extent of MRRN integration among neighboring cities may lead to competition at the local scale. However, better integration into the network may help non-adjacent cities develop economic cooperation. Our results suggest that MRRN integration promotes the establishment of a competition-cooperation mechanism of “competition at subregional scale and coordination at regional scale”. Such a mechanism could promote the growth of megaregion in a more balanced way.
Globally, both developed and developing countries show a keen interest in high-speed rail construction, including cross-border railways such as the China-Laos Railway, Jakarta-Bandung High-Speed Rail, Budapest-Belgrade Railway, and the Saudi Arabian Mecca-Medina High-Speed Rail. However, there are concerns about the return on investment and the tangible impacts on regional economic development47,48. Our study provides insights from China, offering valuable lessons and confidence for other countries considering similar transportation infrastructure projects. In developed regions such as France, Germany, and Italy with well-developed high-speed rail networks, our study can offer insights into how China’s integrated approach may foster or impede regional economic balance and equity17,19. Despite these countries’ achievements in rail infrastructure development, challenges in achieving equitable economic distribution remain49,50. The experience in China demonstrates how coordinated planning and integration across different railway layers can address these issues, ensuring balanced growth and reducing regional disparities in the long term. Our findings highlight the importance of a multi-layered approach to rail network integration, providing a model that can be adapted to enhance regional economic fairness in developed countries.
To sum up, the benefits of constructing a new high-speed railway line are complementary to those of improving MRRN integration in regional development. The relationship between the above two policies should be critically considered. Our results suggest that the former plays a more significant role in promoting the economies when megaregions are in the initial stage of development. It enhances the economic leadership of the central city by siphoning more flows of people, capital, and technologies within the megaregions. When megaregions have developed into a more mature status, MRRN integration plays a vital role in economic coordination. The accessibility of surrounding small and medium-sized cities could be enhanced through the MRRN integration process. They undertake the transfer of urban resources in the central cities and achieve the overall coordinated development of megaregions.
Findings from the theoretical and empirical analysis can potentially help understand the way megaregions are reorganized by high-speed railway connections and achieve long-term balanced economic sustainability throughout the region46. Some limitations of this study and potential future extensions are worth noting. The development of megaregions is bound to be a process of changing from centricity51,52 to polycentricity. As we mentioned above, forming a megaregion could be divided into a multi-stage process. How to illustrate the impact of MRRN integration on the coordinated economic development of megaregions in each stage quantitatively should be further explored. In addition, we only consider the MRRN but don’t consider highway and air transportation. The evaluation framework for the regional economic impact of a comprehensive transportation system may be an interesting and attractive extension of the study.
Methods
The structure of the MRRN model
Along with the development of complexity science, abstracting relationships in a realistic economic society for the complex network has become a trend. Urban rail transit and high-speed railway networks could reflect the robustness of the transportation network in the operation process53,54,55 and have been constructed in the past decades to describe the interactions with local regional economics by introducing accessibility indexes25,26,28,29. MRRN integration is expected to promote the coordinated development of the regional economy in a high-quality way. The representation of MRRN integration could be constructed in a similar methodology56. Two main methods have been taken into the application of the description of transportation networks, i.e., L-space and P-space, and both of them abstract real-life stations into nodes53,57,58. In the L-space approach, two nodes are connected only when they are consecutive on an arbitrary railway line. This paper focuses on the influence mechanism of MRRN construction and coordination on the regional economy. Considering the spatial representational significance of stations’ geographical adjacency features, we use the L-space method.
According to the different statuses and service scopes of high-speed railways in the network, the CHSRN and IHSRN are separated from each other in this study. The former has important political, economic significance and could guarantee the national transport links in the whole network. The latter refers to high-speed railways built in densely populated metropolitan areas or city groups to connect nearby cities, which can greatly reduce intercity travel time.
Urban rail transit networks are vital for economic development as they facilitate efficient movement within cities. Studies have demonstrated that well-developed urban rail systems boost local economies by improving accessibility and mobility, as well as increasing property values59. Moreover, a comprehensive urban rail network is essential for enhancing connectivity between regions60. By integrating urban rail transits with high-speed and intercity rail networks, a complete transportation system is created thereby enhancing the movement of people and goods across metropolitan areas61. Considering urban rail transit stations are essentially different from railway stations, MRRN only considers those subway stations that provide connecting services for adjacent railway stations. The identification of subway stations shall be judged from the spatial position that there is a connection relationship as shown in Fig. 1. Thus, MRRN based on the multi-layer complex network (MLCN) includes CHSRN, ISHRN, RSRN, and urban railway networks (UTRN).
Multiplex network62,63 is one of the MLCN models. The most significant feature of multiplex networks is that all network layers are composed of the same group of nodes, which is suitable for the characteristics of CHSRN, ISHRN, and RSRN. In addition, the characteristics of the multiplex network are that each layer represents a certain relationship or interaction mode between nodes, while the inter-layer edge represents the corresponding relationship of the same node in different network layers. For instance (see Fig. 1), if there is a connection between nodes a and b in the CHSRN, that means a corridor high-speed railway line connecting two stations. And if node a coexists in CHSRN, IHSRN, RSRN, and UTRN at the same time, it indicates corridor high-speed railway, intercity high-speed railway, and regular railway lines all connect to the station. As shown in Fig. 5b, edges in the same layer indicate there are railway lines in this layer connecting different stations and at least one train per day operating between two stations. Inter-layer edges represent those passengers could transfer between different modal rail transits.
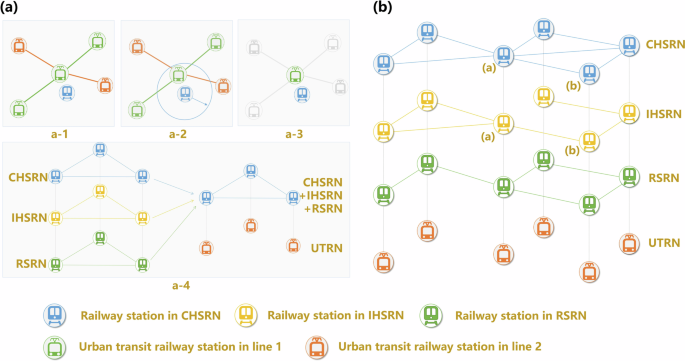
a Nodes in different layers of the MRRN model. b Corresponding subway station identification and determination process of weight in UTRN.
Hyper-adjacency matrix can express structures of multiplex networks64. We define ({A}^{t}={{A}^{[1],t},{A}^{[2],t},{A}^{[3],t},{A}^{[4],t}|forall tin T}) as the set of the adjacency matrix of CHSRN, IHSRN, RSRN, and UTRN layer in year t. And we have ({A}^{[i],t}=({E}^{[i],t},{V}^{[i],t}),forall tin T) to describe the adjacency matrix of layer i in year t, which represents the set of nodes and edges in layer i respectively. Then we can define the element ({a}_{j,k}^{[i],t}) in the following form: if station j and k in year t are connected by a railway line in layer i, ({a}_{j,k}^{[i],t}) equals 1, else equals 0.
Then edge weights in the MRRN should be defined considering the actual fusion tightness. Several studies have proved that those cities with higher train frequency are more connected with each other, which further improved the accessibility between cities in a specific transport mode25,28,41,65. According to refs. 66,67, train frequency has been introduced as more detailed data to describe accessibility. And it ameliorates the original measurement compared with ref. 38. However, it ignored that different trains provide different accessibility improvements according to their speed level (i.e., G-series and D-series high-speed railway trains with an average speed of 300–350 km and 200–250 km per hour, respectively, and regular trains under 120 km per hour). This paper studies the promotion effect of the new construction of high-speed railways and the improvement of MRRN fusion on the urban economy. Therefore, this paper concentrates on the relative differences between different cities rather than the absolute accessibility. In the MRRN model, after separating G and D-series high-speed railway trains from regular trains into different layers, the above problem could be overcome by standardizing the edge weights in each layer. G and D-series high-speed railways trains are assigned to CSHRN and IHSRN layers while regular trains are on the RSRN layer. For different stations j and k in the same layer i, we have the accessibility measurement in the following form:
In Eq. (1),({a}_{j,k}^{[i],t}) is a dummy variable to describe whether there is a railway line in layer i connecting station j and k in year t; ({n}^{t}({e}_{j}^{[i]},{e}_{k}^{[i]})) is the train frequency in ayer i between stations j and k in year t; (d({e}_{j}^{[i]},{e}_{k}^{[i]})) is the distance between stations j and k. (mathop{max }limits_{j,kin {E}^{[i]}}{n}^{t}({e}_{j}^{[i]},{e}_{k}^{[i]})) and (mathop{max }limits_{j,kin {E}^{[i]}}d({e}_{j}^{[i]},{e}_{k}^{[i]})) is the maximum value of ({n}^{t}({e}_{j}^{[i]},{e}_{k}^{[i]})) and (d({e}_{j}^{[i]},{e}_{k}^{[i]})) in layer i, which are introduced to standardize the edge weights. After standardization, all edge weight values are in the range of [0,1]. Considering that the train frequency of UTRN is much higher than that of a railway network, the edge weight of the former cannot be calculated only according to the above method. From the perspective of a subway connecting to railway stations, we compound CHSRN, IHSRN and RSRN, transfer the connectivity relationship of the composite network (CHSRN + IHSRN + RSRN) to the corresponding subway stations (see Fig. 1a), and define the following edge weight calculation method as Eq. (2):
({sigma }_{1},{sigma }_{2},{sigma }_{3}) are weight coefficients. As in Fig. 5, edges between different layers in the MRRN model mean there is a valid connection relationship between different layers for the same station (i.e., CHSR transfer to regular railway lines). Transfer heterogeneity makes the necessity of standardization, due to the connecting transfer time difference can be multiples between CHSRN to UTRN and CHSRN to RSRN68,69. And the transfer time between multi-modal rail transits is a reasonable measurement to sentence the fusion better or not. Thus, for station j which has edges between different layers i1 and i2, we have the transfer convenience index as Eq. (3):
In Eq.(2), ({a}_{j,k}^{[{i}_{1}],[{i}_{2}]}) is a dummy variable to describe whether there is a valid transfer connection in layer i1 and i2 connecting station j and k in year t; ({r}^{t}({e}_{j}^{[{i}_{1}]},{e}_{k}^{[{i}_{2}]})) is the average necessary transfer time between layer i1 to layer i2 of station j and k in year t, while (mathop{max }limits_{jin {E}^{[{i}_{1}]},kin {E}^{[{i}_{2}]}}{r}^{t}({e}_{j}^{[{i}_{1}]},{e}_{k}^{[{i}_{2}]})) is the maximum value of them. And the edge weights of different years could be obtained by taking the combination of Eqs. (1–3). Then we will introduce how to calculate the variables to describe the performance of the MRRN model in each city for each year.
MRRN indicators specification
Shannon entropy has been widely used in estimating the diversity and uniformity in complex systems. As in the MRRN model, if the stations in each city are more evenly distributed in all layers and connected, it shows that the station layout of the city is more reasonable and the fusion of the MRRN is better. Furthermore, it should be noted that edge weights between different layers mean the necessary transfer time for different modal rail transits in the same station or adjacent stations. That means edge weights should be taken into consideration when the Shannon entropy is calculated. To get the Shannon entropy of the MRRN, we need to define the node strength first. Specifically shown in Eq. (4), we use ({s}_{j,t}^{[i]}) to represent the sum of the edge weights of the nodes pointing to the node j in layer i at time t, as called node strength in layer i.
Furthermore, we have the following form to describe the Shannon entropy of node j at time t:
Considering that Eq. (5) is not a monotone function, we introduce the difference between the actual Shannon entropy and its’ theoretical optimal value ({h}_{j,t}^{max }) as Eq. (6).
The clustering coefficient is an advanced property to describe the characterization of the tightness of nodes in complex networks. It’s defined as the proportion of adjacent nodes of a node in the network that is also connected. In other words, the clustering coefficient describes the relative unimportance of the station in the subnetwork of surrounding nodes. If a newly constructed CHSR or IHSR emerges in the network, it will lead to an impact on the subnetwork of that layer, which may further influence the regional economy of cities along the CHSR or IHSR. The estimation methods of the clustering coefficient could be extended into MLCN. In MLCN, a triangle structure composed of three nodes j, k, l can be divided into three occasions according to the difference of locating layers: (i) three edges in the same layer, (ii) two edges in the same layer, and (iii) three edges in different layers70,71. For case (ii), a structure conception of “one-triad” has been defined as edge j-k and j-l are in the same layer. Thus, based on the definition, the clustering coefficient could be written as the proportion of case ii.) and the number of “one-triad” as Eq. (7).
Where M represents the number of layers. In network analysis, centrality can quantitatively analyse and reflect the position and influence of nodes in the network. And degree centrality is defined as the number of nodes directly connected to a node. In the MRRN model, degree centrality explains the accessibility of a station not only from the perspective of traveling to other cities but also considering the accessibility to the rail accessibility of various areas within the city.
However, being different from the single-layer complex network, node centrality in MLCN not only depends on the number of neighbors pointing to the node but also relies on the relative importance of the layer. PageRank algorithm has been proposed to estimate the node centrality in MLCN. Unlike Shannon entropy and clustering coefficient, the PageRank node centrality used in this study simplifies the existing formula72, and the PageRank value of each layer is uniquely determined by the connection relationship of the nodes, thus better reflecting the network topology. The index is derived from the PageRank algorithm, and the pseudo-code of the algorithm is given in Supplementary Table 2. The general formula is as follows.
In Eq. (8), ({P}_{i}[j]) represents the PageRank value of the station j at layer i, ({lambda }_{i}) represents the weight of layer i, and ({tilde{P}}_{j}) represents the overall PageRank value of station j. In this paper, although different layers serve different types of passengers, they are all important components of the multi-layer complex network, so we choose the same weight for each layer.
SDDM specification
In our study, we chose the spatial econometric models beyond the traditional ordinary least squares (OLS) regression to capture the complex spatial dependencies inherent in regional economic data. OLS assumes that observations are independent and identically distributed, which is a limitation when dealing with geographical data where spatial interactions and dependencies exist. Spatial econometric models account for these interactions by incorporating spatial dependencies directly into the modeling process28,73, which is essential for accurately assessing the regional economic impacts of infrastructure investments such as railway networks29,66.
Among spatial econometric models, the spatial Durbin model (SDM) is distinguished by integrating features from both the spatial lag model (SLM) and the spatial error model (SEM). The SLM is designed to concentrate on the spatial lag of the dependent variable by capturing the influence of a city’s economic development on its neighbors, while the SEM addresses spatial correlation in the error terms by accounting for spatially autocorrelated disturbances. The SDM encompasses spatial lag and spatial correlation in the error terms simultaneously, which makes it capable to measures direct and indirect effects of explanatory variables as well as capturing spatial spillover effects. This makes SDM particularly suited for examining the comprehensive impacts of railway investments on regional economies.
Mathematically, the SDM is represented as Eq. (9).
where (gamma) is the spatial lag effect coefficient, ({W}_{i,j}) is the spatial weight matrix, (beta) is the parameter of the explanatory variable vector ({X}_{i,t}), (theta) is the spatial spillover effect coefficient of the explanatory variable vector, ({lambda }_{t}) and ({mu }_{i}) are the time and individual sample fixed effects respectively and ({varepsilon }_{i,t}) is the residual item. This formulation allows for a representation of spatial dependencies by incorporating both the spatial lag of the dependent variable and the spatial lag of the independent variables.
However, regional economic development influenced by new high-speed railways or improvements in accessibility through MRRN integration often exhibits time-lagged effects. Therefore, we further employ the Spatial dynamic Durbin model (SDDM), which extends the SDM by incorporating temporal dynamics. This model accounts for both spatial and time-lagged dependencies, providing a robust framework to assess how past infrastructure investments influence current economic outcomes. The SDDM is expressed as:
where (psi) is the coefficient of the space-time-lagged dependent variable. It captures the delayed impact of railway infrastructure investments on economic growth, which makes it particularly effective for long-term regional economic analyses.
Specifically, Moran’s I test (presented in Supplementary Table 3 and explained in Supplementary Note 1) demonstrated noble spatial autocorrelation in GDP of different cities. The Lagrange multiplier test (presented in Supplementary Table 4 and explained in Supplementary Note 2) supported the superiority of spatial econometric models in capturing the spatial interactions and spillover effects inherent in regional economic data over OLS. The likelihood ratio (LR) test (presented in Supplementary Table 5 and explained in Supplementary Note 3) and Wald test (presented in Supplementary Table 6 and explained in Supplementary Note 4) confirmed the necessity of the SDDM’s complexity over simpler models like SLM and SEM. These tests substantiate the robustness and appropriateness of the SDDM for our research.
Responses