Energy efficiency and carbon savings via a body grid
Introduction
The recent spate of extreme climate events – extreme fire seasons, dramatic departures from historic sea-surface and arctic temperatures have highlighted the slow pace of energy solutions to mitigate global warming1. According to the sixth IPCC report2, the goal of limiting global warming to 1.5 °C is unlikely to be achieved if we cannot greatly expand on the nationally determined contributions that were announced before COP26. The median global warming is projected to rise to 3.2 [2.2 to 3.5] °C by 2100 under current global modeled pathways, resulting in crossed tipping point and massive disruption to the earth and human society3. Thus, immediate actions, including those in what are today seen as unconventional or poorly studied new regimes, are required to accelerate low-carbon innovations that could drive significant progress in global climate mitigation.
Regional and city-scale low-carbon measures and projects have been established to support domestic emission reduction allocation and clean energy development4,5,6,7,8,9. Mitigation efforts have also been localized to the building and even home level to promote carbon reduction10,11,12,13. As important as these large-scale initiatives are, it is also clear that based on current understanding, they are also insufficient to meet our climate goals. This points directly to an entirely new research domain: leveraging end-user ‘demand pull’ for products that reduce point-of use and associated life-cycle greenhouse gas emissions that result from individual behaviors. This is not meant to place blame on end-users, but to highlight that interventions here can have dramatically faster market impacts, and can leverage previously unavailable new opportunities for emssion reduction14. This research project focuses on the benefits available through wearable technology (e.g. body energy harvesting15,16) and the resulting low-carbon behaviors17,18,19 has garnered widespread attention. Current efforts fall short of immediate carbon reduction targets due to a suite of factors, including inadequate technical maturity (e.g., insufficient harvested power level20,21) and a climate value-action gap (e.g. low-carbon actions not aligning with individual priorities22,23,24). These barriers to accurately assessing individual carbon reduction potential lead to our collective underestimation of the environmental and end-use benefits of programs to build new decarbonization avenues. To address these issues, we propose a new technological approach called the body grid. By using clothing as a carrier, the body grid integrates interconnected power devices and an information network on the wearer to facilitate cooperation between energy supply, storage, demand, and information communication. Interconnected power devices realize energy transfer via physical interfaces and deployed circuits, while information exchange is enabled through signal lines and Bluetooth. The controller centrally manages device operations, circuit connectivity, and data communication. This creates a universal platform that interacts with the human, external energy systems, and the environment to target body individual needs under a universal framework.
To validate the feasibility and performance of body grid, we constructed a simplified prototype with a new energy management strategy (EMS) and tested it in both indoor and outdoor environments. While not intended as a broad exploration of this sector overall, our results indicate that outdoors, the body grid can interface with internal devices to enhance endurance and harvest energy based on dynamic individual needs, and indoors, the body grid can establish a unique energy and information cooperation platform with building equipment to reduce energy consumption while maintaining individual comfort. Through experimentation in Shenzhen University Town and simulation of university building heating in January, the body grid demonstrates the considerable carbon reduction (−61.0%) and economic saving (−57.5%) potential, even though harvested power from humans is currently relatively low. Considering both space cooling and heating demand globally, the body grid is expected to realize a 50% electricity saving annually. Moreover, the application of the body grid does not sever ties with the power grid; instead, it could introduce new mechanisms to the traditional energy market and encourage low-carbon behaviors.
Results
Features and framework
Our work builds on traditional isolated “island-model” microgrids, by an extension to a “wearable microgrid” that we have designed to perform on-body standalone energy management for improved device performance25,26. We note that the microgrid with both grid-connected and off-grid management capabilities, especially when incorporating renewable energy sources, can yield greater carbon reduction and economic value27,28. Thus, individual energy systems should not discard the “grid-connected” model. Due to security risks, the “grid-connected” status of the body grid is established to supplement services with the building grid in specific scenarios. Although the body grid shares features and some characteristics with the conventional power grid, including interconnected components, intelligent synergy support, and renewable integration, the performance and energy efficiency objectives differ substantially. The body grid aims to capture and communicate the wearer’s dynamic individual needs and generate a responsive EMS. Based on this, we constructed the body grid framework shown in Fig. 1.
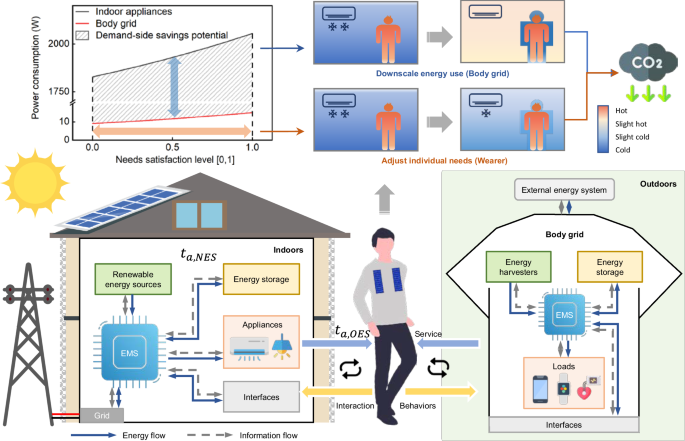
The body grid first identifies the application scenarios. In outdoor scenarios, the body grid operates independently and controls the energy and information flow among devices to meet the wearers’ needs. The indoor scenario on the left shows the composition of the external energy system and the interaction with the wearer and body grid. By shrinking the cooling and heating space and implementing needs-based control, the body grid enables large energy and carbon savings. ({t}_{a,{NES}}) refers to air temperature indoors without using appliances and ({t}_{a,{OES}}) is achieved by using appliances.
The energy management system, typically a microcontroller unit (MCU), regulates devices within the body grid that interface as energy harvesters, storage, or loads. The MCU collects and processes real-time sensing data from devices. After the EMS operation, the MCU issues instructions to the devices and interfaces for execution. This instruction set guides the harvested energy to be directly consumed by the load or stored for later use. As recipients of body grid services, wearers can influence EMS by adjusting individual needs or altering behaviors such as relocating to a different environment. Indoor scenarios have a similar architecture that employs energy-consuming appliances to transform the natural environmental state (e.g. the air temperature before heating or cooling ({t}_{a,{NES}})) into a more comfortable objective environmental state (e.g. the air temperature after heating or cooling ({t}_{a,{OES}})). Here, body grid wearers can not only charge their energy storage from the power grid but also cooperate with appliances to reduce energy consumption of altering the space state. The combination of downscaled energy use and demand-side adjustment can produce new carbon saving regimes, which reduces power consumption from the kilowatt level to the watt level.
Body grid prototype and EMS
To explore the features of the body grid, we have designed and deployed a simplified prototype with internal devices shown in Fig. 2a, b, which integrates one energy harvester, three energy storage units and three types of loads (see details in Supplementary Table 1 and Supplementary Fig. 1). Energy harvesting is achieved through flexible photovoltaic (PV) panels on clothing or folding PV panels attached to a backpack. Battery A is a small-capacity lithium battery responsible for powering the low-consumption electronic components, Load A, which contains devices such as temperature sensor, MCU, Bluetooth, etc. Furthermore, the phone is regarded as both Battery B and Load B for internal integrated energy storage and load. The body grid is also equipped with a high-capacity lithium battery (Battery C) for the power adjustable heating pads (Load C). When the body grid is enabled, it will automatically adjust the current energy and information flow as illustrated in Supplementary Note 1.
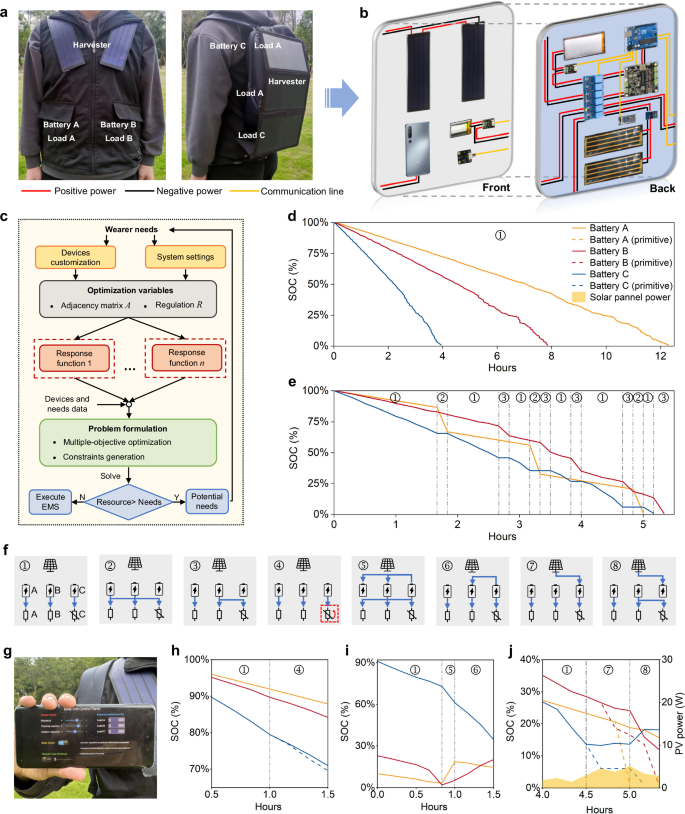
a Front and side views of the body grid prototype and main devices. b Connection diagram. c Need-oriented EMS. d SOCs variation of batteries over time in the outdoor test without body grid and PV power. e SOCs variation in the outdoor test with body grid. f 8 EMSs automatically switch during the test. g Interactive interface using a cellphone. h Demand response operation, and SOC-hours curve. i Transfer switch operation, SOC-hours curve. j Renewable energy utilization operation, the SOC-hours curve. The dotted line represents the original SOC trend without customization. EMS energy management strategy, SOC state of charge, PV photovoltaic. Experimental data are provided in Supplementary Data 1.
Extrapolating from these results, we propose a need-oriented EMS methodology that coordinates the operation and interaction between devices and the body. Its technical core involves converting individual needs into energy and information needs. As depicted in Fig. 2c, the first step entails customizing devices and system settings in the body grid based on wearer’s specific needs. Based on devices information such as types and electrical parameters, the body grid generates adjacency matrices A and regulation variables R that describe scheduling schemes (how to connect circuits and what power to apply) in the second step. For each need, the body grid creates a response function to evaluate the degree of fulfillment using physical modeling and data-driven methods (details in the Methods section), and the user feedback data will be continuously collected to refine the response function during the operation. Afterward, the system considers the wearer’s prioritized needs and the importance of different loads to formulate a multi-objective optimization problem, as well as adding constraints that adhere to device operation rules and operating restrictions for different EMSs. For example, the output voltage of an energy harvester must fall within a certain range to charge a battery. The third step involves solving EMS by optimizing the overall demand satisfaction (the sum of weighted response functions). Finally, the system assesses the current availability of energy resources. If resources are relatively scarce (e.g. the estimated endurance is less than the expected usage time), EMS tends to opt for real-time adjustment, i.e., executing current EMS. Otherwise, EMS tends to undertake long-term planning, suggesting more or enhancing needs, and initiate a new EMS solution cycle.
Internal synergy: need-oriented energy allocation in the outdoor scenarios
To validate the functionality of synergistic and integrated internal devices, we conducted an outdoor test on the body grid. Without synergy, each battery powers its corresponding load and has a distinct endurance (Fig. 2d), potentially limiting outdoor activity time due to the unsustainability of certain functions or services. However, with an expected usage time setting (6 h for all devices in the test), the body grid automatically adjusts the EMS based on individual needs and system state. For example, at hours equal to 2.7, Battery B supplied Load C to extend Battery C’s range. The total running time of each load is similar, avoiding the barrel effect of the device operation duration (Fig. 2e).
Wearers can easily adjust the priority of various needs, set expected runtimes for different loads, and choose renewable energy integration through the interface shown in Fig. 2g. The body grid system then autonomously adjusts its EMS based on these inputs, mirroring common operations in power systems. One operation is demand response. When wearers prioritize endurance by only dragging the “Endurance” button to 1, the body grid reduces the power of adjustable load (Load 3) from 4.7 W to 3.5 W, sacrificing some thermal comfort to extend endurance when energy storage is insufficient (Fig. 2h). Another operation is transfer switch, typically used in multi-battery setups with uneven state of charge (SOC) levels to maintain individual battery health by shifting the load to a different power source. As shown in Fig. 2i, when Battery A and Battery B near depletion, Load A is transferred to Battery A, and Battery A and B are charged by Battery A (loads in the cellphone can only be powered by its own battery). Battery A stops to power Battery A and Load A at hours equal to 1 when its SOC drops too fast. Moreover, when solar resources are abundant, the wearer can select whether to connect the PV panel by clicking the corresponding button. If yes, the body grid can intelligently allocate renewable energy to specific batteries to increase the endurance of all batteries (Fig. 2j). This demonstrates that the body grid can rationally schedule energy resources and consumption methods by coordinating internal devices to accommodate dynamic individual needs in energy-scarce and energy-rich scenarios. Since the body grid’s outdoor carbon reduction capability heavily relies on the output power performance of energy harvesters and individual low-carbon behaviors, incorporating external energy systems or devices into synergy in indoor scenarios is currently a more practical option.
Internal and external synergy: carbon reduction capability in the indoor scenarios
To investigate the mechanisms of indoor carbon reduction and the synergy with external energy systems, we conducted an experiment in a single office located in Shenzhen University Town (see details in Supplementary Note 2 and 3). The single office occupies 18.75m2 and is equipped with an adjustable heater rated at 2000W. We recorded the indoor air temperature ({t}_{a,{NES}}) without any active heating and measured the power consumption of the heater (PHeater) required to reach the target air temperature ({t}_{a,{OES}}) after heating. For example, in Fig. 3a, at a ({t}_{a,{NES}},) of 15 °C, the heater consumed 1557.1 W to achieve a ({t}_{a,{OES}}) of 23 °C. The data from PHeater, ({t}_{a,{NES}}), and ({t}_{a,{OES}}) conform to a regular distribution (Fig. 3d), which can be fitted with a polynomial surface, ({t}_{a,{OES}}) = f (({t}_{a,{NES}}), PHeater).
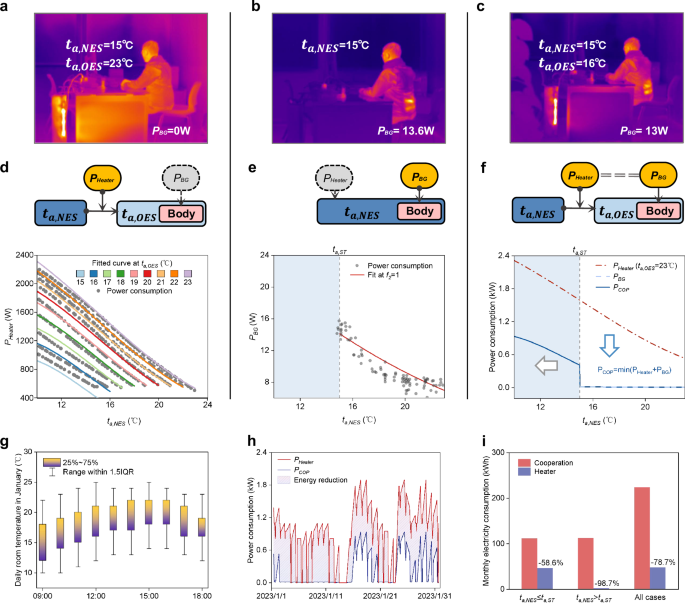
a–c Infrared images of using heater only, body grid only, and the cooperation with the same ({t}_{a,{NES}}), different ({t}_{a,{OES}},) and PBG. d, e Operation mechanisms and fitting curves of the heater and body grid with PHeater–({t}_{a,{NES}},) and PBG–({t}_{a,{NES}}). f Cooperation mechanism and optimal power consumption curve via ({t}_{a,{NES}}). g Shenzhen indoor temperature statistics in January. h Simulation of average hourly power consumption comparison between heater and cooperation during working hours. i Comparison of cumulative power consumption of heater and cooperation below and above ST. PHeater power of heater, PBG power of body grid, PCOP total power of cooperation, IQR interquartile range, ST service threshold.
In another set of experiments, we collected 142 records from 10 participants, including ({t}_{a,{NES}}), the power consumption of the body grid PBG, and overall thermal sensation votes (OTSVs). After data processing, we fit the heating power of body grid PBG under different ({t}_{a,{NES}}) and OTSVs. When the OTSV is set to 1 to approximate thermally neutral states, we can plot the relationship between PBG and ({t}_{a,{NES}},) with a curve, PBG = f (({t}_{a,{NES}})), as shown in Fig. 3e. This figure represents the power required to achieve a thermally neutral OTSV at the given ambient air temperature. For example, in Fig. 3b, at an ({t}_{a,{NES}},) of 15 °C, the body grid consumed 13.6 W to warm up the tester’s back for a comfort level comparable to heating the entire office. However, this experiment revealed the limitations of body grid’s thermal service: it can only guarantee thermal comfort over 15 °C range of ({t}_{a,{NES}},) due to limitations of power and size of own conditioner29, and higher PBG may lead to health risks. The lower and higher bounds here are called the service thresholds (ST), which means that the body grid device is stretched to its utmost limit.
We attempted to broaden the application scope of the body grid by proposing a new synergy mechanism between the body grid and heating appliances. After reaching steady-state operation, the heater’s ({t}_{a,{OES}},) was equivalent to the body grid’s ({t}_{a,{NES}}). Given a known ({t}_{a,{NES}}), power distribution between the heater and the body grid became an optimization problem with PHeater and PBG as variables and the lowest total power consumption as the objective. The curve of cooperation with changing ({t}_{a,{NES}},) is shown in Fig. 3f. When ({t}_{a,{NES}},) approached 15 °C, the heater ran at 536.9 W and the body grid consumed 13 W to keep the tester thermally neutral (Fig. 3c). As ({t}_{a,{NES}},) exceeded 15 °C and the body grid could satisfy heating demand, heater stopped working. To evaluate the energy-saving potential of this mechanism in practice, we collected the indoor temperatures of Shenzhen in January without heating equipment in Fig. 3g and simulated the average hourly power consumption of using the heater and the cooperation in Fig. 3h. In the simulation, the heating threshold is set to 20 °C according to testers feedback and relevant literature30, meaning the heating system activates when room temperature drops below this level. From Fig. 3i, when the indoor temperature was equal to or less than ST (15 °C), the combination brought around 58.6% energy savings compared to only using the heater; When the indoor temperature was greater than ST, only the body grid was at work and the energy saving reached around 98.7%. When all temperature conditions were considered, the total integrated energy saving of the cooperation could reach 78.7% compared to the heater. If more energy savings are desired, it is feasible to improve heating equipment performance (lower ST) on the body grid to cover a wider range of application scope (efficiency is discussed in Supplementary Note 5).
Large-scale application simulation
When expanding the application from a single office to an entire building, the potential for cooperation mechanism between the body grid and the building’s climate control system in multi-occupant rooms needs further exploration. We simulated one floor of an office building, consisting of 8 single offices (Office A), a 30-person office (Office B), and a 50-person office (Office C). Based on field measurement, we gathered data on outdoor air temperature, room parameters and the average occupancy over time as shown in Fig. 4a–c (see details in Supplementary Note 6). This simulation adopted a simplified steady-state method to calculate room heat loads only considering the heat dissipation through the external envelope and heat load differences from occupant heat dissipation. Thus, given a certain outdoor air temperature, the energy consumption in multi-occupant rooms varies with the occupancy rate. As shown in Fig. 4f, the heating power consumption of both cases (using the air conditioner only and the cooperation) reduces as the occupancy increases since occupants’ heat dissipation lowers heating demand. In the cold environment, the former requires the set temperature of air conditioner to be adjusted to 20 °C, whereas the latter, due to the cooperation mechanism, only needs to set the temperature to around 15 °C. As a result, the energy consumption base for the air conditioner is higher in the former case. However, the rates of the energy consumption reduction with increasing occupancy differ between the two cases, as cooperation also contributes to the energy consumption of the body grid. Therefore, when the room is fully occupied with 50 people, the total energy consumption for only using air conditioner is lower than the cooperation. This also explains why, at certain times in January, the energy consumption is higher when the cooperation is applied as shown in Fig. 4e.

a Diagram of the building and its cross-section. We set only using the air conditioner (COP = 4.0) in offices as the baseline for comparison with the cooperation. b Average outdoor air temperature in Shenzhen in January. c Average occupancy in office A, B and C. d Shenzhen commercial electricity time-of-use tariff. e Simulation of hourly power consumption of one floor between only using the AC and cooperation during working hours. f Power consumption via occupancy in 50-person room when outdoor air temperature ({t}_{o}=-3) °C. g Cumulative monthly electricity usage, and cost simulations for using only AC (baseline) and cooperation, and the energy consumption components in the cooperation. AC air conditioner, PAC power of using the AC only, PCOP total power of cooperation, IQR interquartile range.
By simulating the cumulative heating energy consumption for both cases over the course of a month and incorporating local time-of-use electricity pricing31, we obtained the results shown in Fig. 4g. The results indicate that, compared to using air conditioner alone, using the cooperation can save approximately 61.0% of energy consumption and 57.5% of electricity costs in January using the tiered price in Shenzhen in Fig. 4d. Upon analyzing the energy consumption composition for the cooperation, we found that Office A, Office B, and Office C account for 49%, 16%, and 35%, respectively, compared to 55%, 15%, and 30% when only air conditioners are used. This highlights that the energy-saving effect of the cooperation mechanism is larger in single rooms.
The body grid’s energy efficiency varies at different room temperatures compared to traditional cooling and heating methods (approximation in Supplementary Fig. 8). To assess the carbon reduction potential of the body grid on a global scale, we adopted and modified the Demand.ninja model32 to obtain accurate hourly indoor temperature and electricity demand for cooling and heating at all locations. Using the weather data in 2020, we calculated annual space cooling and heating demand per capita in Fig. 5a. The total annual electricity consumption considering all populations is about 13222 TWh (Fig. 5b). After applying the body grid, this value is reduced to about 6611 TWh (-50%) in Fig. 5d. Energy consumption per capita in the northern hemisphere remains higher in Fig. 5c, indicating a higher requirement for the heating efficiency of the body grid. Thus, improving the performance of wearable heating devices to lower the bound of ST will be an effective way to cut per-capita electricity demand. We have selected four energy-intensive areas as examples in Fig. 5e–h. The U.S. and China have similar electricity demand patterns across similar latitudes, but the difference in population numbers results in different demand magnitudes. India and the EU represent two types of demand patterns, cooling-dominated and heating-dominated types, respectively. This could lead to discrepancies in the body grid’s development strategy in different regions (more analysis in Supplementary Figs. 9-17).

The Demand.ninja model33 is used to estimate demand. The heating and cooling thresholds are set to 20 °C and 26 °C, respectively, while the service thresholds of the body grid are set to 15 °C and 30 °C. a The model-simulated electricity demand per capita by country is mainly affected by latitude. Traditionally energy intensive countries such as China do not have high per capita demand. b In the global annual electricity demand, heating demand is higher than cooling demand. c, d Introducing body grid and the cooperation mechanism can reduce per capita and total space cooling and heating demand globally. e–h Simulation of annual electricity demand with hourly resolution before and after applying the body grid, for (e) United States, (f) Mainland China, (g) India and (h) European Union. BG body grid.
New energy market innovations leveraging the body grid
We explored how to involve the body grid in the energy market to motivate wearers to participate in carbon reduction activities or adjust their behavior based on market signals.
The methods from the power system33,34,35,36 are adapted to design solutions for the body grid energy market. These methods are shown in Fig. 6. Method 1 suggests deploying energy harvesters and storage devices on the body grid to reduce dependence on the power grid and electricity bills. However, this method may have a low short-term return on investment due to current limitations of energy harvesters’ power level and storage’s energy density. Hence, the wearer could lease out redundant energy storage devices to the utility through the energy market for more profit. The utility could utilize these storage devices to support its own peak shaving and valley filling (Method 2). In Method 3 we propose that the wearer can trade energy with other suppliers such as other body grids, besides obtaining energy from the power grid. Moreover, the utility could motivate wearers to voluntarily shift or reduce their charging needs at certain times for subsidy according to the agreement (Method 4). Alternatively, setting the time-of-use price of the body grid could induce wearers to stagger electricity consumption (Method 5). In Method 6, the government can subsidize individuals based on the amount of carbon reduction by the body grid to mitigate environmental impact. As these approaches may require cooperation from wearers, utilities and the government, appropriate mechanisms or agreements need to be carefully designed.

Referring (a) 6 methods in power system for customers to participate in the energy market, wearers with body grids could join the energy market and form new mechanisms (b).
Discussion
Constructing a body grid using a framework comprising harvester, storage, load, and control units facilitates automatic scheduling and renewable energy absorption among wearable devices. We devised an energy management method tailored to the wearer’s needs and evaluated it outdoors. However, relying solely on internal energy management and energy harvesting yields relatively modest and inconsistent carbon reduction compared to energy consumption. Thus, we investigated the carbon reduction mechanism of the body grid in indoor and building environments. Indoors, the body grid excels at providing energy-efficient services, but its performance and applicability are constrained by factors such as portability, power level and health risks. Collaborating with external devices or systems may offer a solution, yet a challenge lies in harmonizing the body grid with external devices or systems that have disparate functions and goals, such as indoor heating systems. We have proposed a synergistic scheme that couples the operation of two systems by linking their states to optimize their joint performance and user comfort. Simulation results indicate that this cooperation mechanism can achieve 61.0% energy savings and 57.5% cost reduction, demonstrating huge individual carbon reduction potential. Expanding to the whole world and using year-round data, the body grid is possible to achieve a 50% electricity saving for space cooling and heating. Although we focused on thermal comfort services, our synergistic scheme can be extended to other services such as lighting or communication by applying analogous mechanisms to reduce energy consumption. Certainly, utilizing the body grid doesn’t imply a replacement of traditional methods, such as adjusting clothing layers for thermal comfort. It can serve as an optional wearable solution, especially when customized energy-consuming functions are needed. Moreover, current energy market methods can be partially adapted to the body grid to incentivize low-carbon behaviors and generate profits for individuals and utilities alike.
The body grid is envisioned as the future energy system’s terminal, capable of supporting various application scenarios beyond the existing power system’s capabilities. These applications fall into three categories: enhancing individual well-being (e.g. implanted body grids and specific applications), achieving collective tasks or objectives (e.g. body grid clusters and individual carbon reduction), and creating economic benefits (e.g. energy trading and commercialization). However, the body grid’s development necessitates a multidisciplinary effort. Future research could focus on incorporating more flexible materials37,38,39 and energy harvesting technologies40,41,42 to improve personal comfort and outdoor endurance. Regarding software, need-oriented EMS and interaction mechanisms with external systems indoors or outdoors warrant further exploration.
Methods
Outdoor applications of the need-oriented EMS method applied outdoors
Before the operation of EMS, the system first identifies the wearer’s specific needs and customizes devices in the body grid accordingly and requires the wearer to input the priority of each need ({p}_{n}). After that, the body grid saves devices parameters such as load rated power ({P}_{k}^{L}), minimum and maximum regulation coefficients ({R}_{k}^{min }) and ({R}_{k}^{max }), expected usage time ({ET}_{k}^{L}), battery capacity ({C}_{j}^{S}) and battery charging and discharging power ({P}_{j}^{{cha}}) and ({P}_{j}^{{dis}}), where k and j are indexes of loads and storage (k and j are equal to 3 in the experiment). Besides, it collects the measured data including battery ({{SOC}}_{j}) and the harvester output power ({P}_{i}^{H}) by the digital power meter and the Li battery fuel gauge sensor, where i is the index of harvesters (i equal to 1 representing the PV panel). Based on the number and types of internal devices, the system can generate an adjacent matrix A applying (0,1) to represent the connection state (HS stands for harvester to storage; HL stands for harvester to load; SS stands for storage to storage; SL stands for storage to load) (1):
where ({j}^{{prime} }) is index of other storage. The other optimization variable, the load regulation coefficients, is described as ({R}_{k}^{L}) with range from 0 to 1 and controlled by the PWM module. So ({R}_{k}^{L}{P}_{k}^{L}) is the practical running power of the load. After that, the EMS enters the operation of algorithm.
The next step is the generation response functions ({f}_{n}(A,{R}^{L})) according to wearer needs. Given device connected within the body grid, A and ({R}^{L}) can be reformed and applied in later functions. Each response function evaluates the degree of fulfillment of a specific need. Ensuring these functions accurately reflect the wearer’s actual needs presents a challenge. Two primary approaches exist for generating response equations ({f}_{n}): physical modeling and data-driven methods. Using our work as an example, three needs were defined for the wearer: Thermal comfort (heating), endurance, and carbon reduction, corresponding to the response equations ({f}_{1},) ({f}_{2}) and ({f}_{3}).
To evaluate the heating satisfaction ({f}_{1}), data-driven method is used by collecting OTSV data from 10 testers under various ambient temperatures and heating pad power levels, then fitting non-linear equations. During data processing, the OTSV range indicating cold sensation [-3,0] was linearly transformed to [0,1] (where values closer to 1 indicate higher thermal comfort), resulting in a fitting equation including ({f}_{1}) (OTSV), thermal load power ({R}_{k}^{L}{P}_{k}^{L}) and air temperature ({t}_{a}) with a goodness of fit ({R}^{2}=0.82936):
where parameters with 95% confidence are: (z0=36.22147pm 1.07053,) (A1=-1.8515pm 0.07868) and (C2=0.0252pm 0.00152). The P-value for parameters are less than 0.01 (close to 0), which indicates parameters are significant for the model. The decision variable in ({f}_{1}) is the power regulation of the heating pads.
For endurance need ({f}_{2}), the system can estimate the remaining time of energy storage to evaluate the endurance performance of each load. If there is energy harvesting, the power to storage can be expressed as ({delta }_{1}{P}_{i}^{H}{A}_{i{j}^{{prime} }}^{{HS}}) (not consider harvester to load due to unstable power generation). If there is transfer switch, the consumed power of discharged energy storage ({j}^{{prime} }) is ({delta }_{2}{P}_{{j}^{{prime} }}^{D}{A}_{{j}^{{prime} }j}^{{SS}}) and the received power of j is ({delta }_{3}{P}_{j}^{D}{A}_{{{jj}}^{{prime} }}^{{SS}}), where ({delta }_{1-3}) are the energy loss coefficients. Thus, we can define the function of storage change (SC) in next time interval (Delta t) (3) as:
Therefore, the simplified estimation of remaining running time of storage ({{RT}}_{{j}^{prime} }^{S},) and the response function are Eqs. (4, 5):
where (lambda) is the dummy variable to handle the situation where harvested power exceeds power consumption. This battery endurance was then translated into device endurance using adjacent matrix ({A}^{{SL}}) as ({{{RT}}^{L}={({{RT}}^{S})}^{T}A}^{{SL}}). The fulfillment of endurance needs was gauged by analyzing the gap between the wearer’s expected device usage time and the estimated runtime using equation:
where K is the total number of loads. As usage increases, the ({{ET}}_{k}^{L}) is automatically updated by subtracting the amount of time it has already been used.
For carbon reduction need, since the wearer cannot control solar irradiance, we evaluate carbon reduction needs based on whether the body grid opts to connect when solar power is available. Sometimes batteries will not accept solar energy because they need to be discharged, when ({f}_{3}=0)。Thus, the value of ({f}_{3}) is limited to 0 or 1 depending on ({A}^{{HL}}) and ({A}^{{HS}}).
Based on the above response functions and priority of needs, we can formulate EMS resolution as a multi-objective optimization problem:
where ({p}_{n}) is coefficient representing the personal priority of different needs. Equation (7) represents the range of regulation coefficients. (8) means each load is powered and only powered by one harvester or storage. (9) means the storage can be charged by at most one harvester or other storage. (10) explains the storage is not self-charging. (11) is used to supplements (4), indicating the power consumption is zero if the harvested power is higher than the operation power for a load. Based on device characteristics, there may be additional constraints. Next, if the remaining energy resource is abundant, for example ({{RT}}_{k}^{L}gg ,{{ET}}_{k}^{L}) the body grid will assess potential body needs and re-enter the EMS solving loop, otherwise the solved A and ({R}^{L}) are sent to MCU for execution.
EMS method of cooperation applied indoors
Indoors, the main needs of wearer are personal comfort and energy saving. Thus, achieving maximum energy saving while meeting personal comfort is the objective of EMS. Given the data of ({t}_{a,{NES}}), PHeater, ({t}_{a,{OES}}) and PBG, we can obtain the fitting functions of using external energy system (or device) only and body grid only as ({t}_{a,{OES}}={f}_{{{{rm{Heater}}}}}({t}_{a,{NES}},{{{{rm{P}}}}}_{{{{rm{Heater}}}}})) and ({P}_{{BG}}={f}_{{BG}}({t}_{a,{NES}})). Since ({t}_{a,{NES}}) = ({t}_{a,{OES}}) for the body grid in the cooperation mode, the objective function of EMS can be described as (12):
where ({P}_{{Heater}}^{min }), ({P}_{{Heater}}^{max }), ({f}_{{BG}}^{min }), ({f}_{{BG}}^{max }) represent the power limits of heater and the body grid, respectively. ({t}_{a,{NES}}^{min },) means the lowest room air temperature. If ({t}_{a,{NES}}, < , {t}_{a,{NES}}^{min }), the cooperation cannot guarantee the thermal comfort of wearers. Since the body grid automatically adjusts its power based on ({t}_{a,{NES}}) and ({t}_{a,{OES}}) to keep the wearer comfortable when ST is not exceeded, the optimization variable is only PHeater, which simplifies the cooperation complexity.
Building simulation method
In the simplified steady-state method: the thermal storage effect of walls is ignored; heat transfer through interior walls between rooms is ignored, and heat dissipation through the external envelope is considered; Heat load differences caused by indoor lighting and equipment usage are ignored, while heat load differences from occupant heat dissipation are considered. Based on the “Green Performance Calculation Standard for Civil Buildings [with Commentary]” (JGJ/T 449-2018), we used the equation to represent the heat load at the steady state:
where k is the heat transfer coefficient of the building envelope (weighted by the areas of external windows and walls), F is the area of the building envelope, ({t}_{a}) is the indoor air temperature and ({t}_{o}) is the outdoor air temperature.
Assume that the coefficient of performance (COP) of air conditioner is 4.0 and heat dissipation per person in regular and premium office spaces is 134 W per person43, the heating demand ({P}_{{AC}}) of using air conditioner only is related to the outdoor temperature ({t}_{o}) and the number of occupants n: ({P}_{{AC}}=frac{{Q}_{j,{t}_{{set}}=20}-134n}{4},) if ({Q}_{j,{t}_{{set}}=20}-134nge 0), or ({P}_{{AC}}=0.) For the cooperation, the heating demand ({{{{rm{P}}}}}_{{{{rm{Cop}}}}}) is the sum of air conditioner and body grid power: ({P}_{{COP}}=frac{{Q}_{j,{t}_{{set}}=15}-134n}{4}+{P}_{{BG}}cdot n,) if (frac{134n}{{kF}}+{t}_{o}le 15); ({P}_{{COP}}={P}_{{BG}}cdot n,) if (frac{134n}{{kF}}+{t}_{o}, > , 15); ({P}_{{COP}}=0,) if (frac{134n}{{kF}}+{t}_{o}ge 20). ({{{{rm{P}}}}}_{{{{rm{BG}}}}}) can be solved with the previous fitting function using the indoor air temperature considering the occupant heat dissipation, described as (frac{134n}{{kF}}+{t}_{o}).
Cooling and heating demand simulation
Referring to the method in the Demand.ninja paper33, we calculated the building-adjusted internal temperature (BAIT) with hourly resolution. Moreover, we set the cooling and heating threshold to 20 °C and 26 °C separately according to the survey30. Based on the smaller granularity of grid cell in each country or region, we obtained the population-weighted and cooling degree hours (CDHs) and heating degree hours (HDHs) for all countries in 2020 (see Supplementary Data 2 and 3). In the cooling and heating demand simulation, we first calculated the generic cooling and heating power coefficients in W/( °C.capita), representing the power consumption of one degree of cooling and heating per person. Given the regional cooling power ({P}_{{cool},r}) and heating power ({P}_{{heat},r}) of APAC, EU and US, we estimated generalized coefficients:
where c represents the countries, ({p}_{c}) is the population in each country and ({p}_{{{{rm{total}}}}}) is the total population in three regions. The total electricity consumption of each country ({P}_{{elec},c}) can be obtained by summing the cooling and heating demand that is the product of power coefficients, country population and HDHs or CDHs (Eq. (18)).
where (e) is the model error, possibly caused by the non-linear relationship between the cooling and heating demand and temperature change. Since we only evaluate the cooperation of the electric cooling and heating devices with the body grid, the savings with other energy sources such as natural gas and coal for heat are not counted. Based on hourly BAIT in counties, we can obtain the corresponding efficiency of body grid in reducing cooling and heating energy demand with Supplementary Fig. 8. Through multiplying the efficiency and ({P}_{{elec},c}), the hourly electricity consumption using the body grid in different countries can be estimated.
Limitation of heating model
According to previous studies, individuals often exhibit large differences in their thermal comfort responses to the environment, making it unreliable to use a fixed mathematical model to describe group thermal comfort universally44,45,46. In this study, we fitted the heating power corresponding to each participant’s OTSV values under different ambient air temperatures. While this model is not directly intended to describe group thermal comfort, it also has limitations in terms of generalizability: it is only applicable to the specific experimental environment and test group. In the future, the model could be continuously improved by increasing the sample size and incorporating real-time data feedback. But considering individual variability and the diversity of thermal comfort needs, we must state that this model cannot guarantee that all individuals will achieve a thermally neutral OTSV at the given ambient temperature and power level. To address personalization, we have proposed in Supplementary Note 4 a method for continuously collecting user feedback during use to optimize the model parameters. Such an optimized model would only be applicable to long-term users who provide feedback data.
Limitation of interface operation
During the system design process, we prioritized the overall endurance of the body grid to highlight its energy allocation capabilities. However, this setting does not reflect the priorities of all users. In practice, users may prioritize comfort over energy optimization, requiring them to configure their preferences in advance. Adjusting these priorities would necessitate users to familiarize themselves with the APP and its operation interface (instructions are provided within the APP interface). To reduce the learning curve for general users, future products could develop more flexible and user-oriented control interfaces.
Responses