Accurate compact nonlinear dynamical model for a volatile ferroelectric ZrO2 capacitor

Introduction
Antiferroelectric materials, such as PbZrO3, exhibit pinched double hysteresis loops in their charge versus voltage curves1,2,3. The antiparallel dipoles align along a single direction when an external bias is applied to an antiferroelectric capacitor, dramatically increasing the accumulated charge at the electrodes. When the bias is removed, the dipoles lose their orientation, releasing the accumulated charge4. The structural transformation, i.e., dipole alignment, consumes energy, resulting in the hysteretic charge versus voltage curve. Fluorite-structured ZrO2 and some HfxZr1-xO2 alloys represent another material system that manifests pinched double hysteresis loops5. Since their electrical response is similar, they have often been assumed to be antiferroelectric. However, the fluorite-structured ground state of these oxides is a high-symmetry nonpolar tetragonal phase (P42/nmc) without antiparallel dipoles. When an external bias is applied, the lattice loses its inversion symmetry and transforms into the ferroelectric orthorhombic phase (Pca21)6,7. Therefore, “field-induced ferroelectricity” or “volatile ferroelectricity” best describe the pinched double hysteresis in these fluorite-structured oxides.
ZrO2 and its derivatives are subjects of keen interest for their applications in memory devices8,9,10,11, piezoelectric systems12, energy storage devices13,14 and potentially oscillators and signal amplifiers resulting from negative differential capacitance (NDC) in the charge vs. voltage (QV) characteristic. However, a direct observation of NDC in ferroelectrics has been challenging because of the hysteresis in the dynamical QV curves. Khan et al. reported an increase in the charge on a Pb(Zr0.2Ti0.8)O3 (PZT) capacitor using a series resistor during which the indirectly measured voltage across the capacitor decreased15. Cheng et al attributed the observation of imaginary impedance in a ZrO2 capacitor as an indicator of NDC16. Other researchers have interpreted the enhanced capacitance of a ferroelectric/dielectric stack to have been caused by NDC of the ferroelectric17,18,19. There are also reports where researchers have designed material stacks and pulsed-voltage experiments in an attempt to probe inside the hysteresis loops of a HfO2 and ZrO2 capacitor20,21. In addition to the experimental investigations, efforts have also been focused to accurately model ferroelectric capacitors22,23,24,25,26.
In this work, we investigated the QV characteristics of ZrO2 capacitors using explicitly dynamical measurements and compact modeling of the experimental results. We found that a simple static model based on a sixth-order polynomial Landau–Ginzburg–Devonshire (LGD) theory and dynamical response from Landau–Khalatnikov (LK) theory agreed extremely well with our experimental measurements. For ZrO2, we found that any NDC was extremely small if not negligible, and that the hysteresis loops were caused by a dynamic (frequency-dependent) resistance that accounted for the energy loss in the lattice degrees of freedom and possibly radiated energy during cycling of the capacitor. We computed and compared the reversible energy stored on the capacitor during a charge-discharge cycle to the irreversible energy dissipated, and found they were similar.
Results
Electrical characterization of ZrO2 capacitor
We first checked to see if there was a measurable tunneling current through the ZrO2 capacitor. Quasi-static current-voltage (IV) characteristics measured using the circuit of Fig. 1a are shown in Fig. 1b. It is important to measure and model this leakage current, since it can contribute significantly to low-frequency dynamical measurements of the capacitive signal and induce a phase shift between the voltage and charge that can interfere with the data analysis if not properly included in a model. In the dynamical measurement circuit schematic shown in Fig. 1c, the voltage input was applied by the function generator as a triangular waveform, and the voltages across the ZrO2 and 1 nF linear capacitors were collected independently using an active differential probe and a passive probe, respectively. The amplitude of the input voltage waveform was adjusted to ensure a maximum voltage drop of 4 V in either polarity across the ZrO2 capacitor. The voltage waveform across the linear capacitor was converted to charge by scaling it with the linear capacitance (Q = C × V). The charge across the ZrO2 capacitor should be identical to that measured for the linear capacitor, which is the Sawyer-Tower circuit used to measure the charge hysteresis in Rochelle salt27. The voltage and charge waveforms are plotted against time in Fig. 1d. As shown in the figure, the voltage waveform across the ZrO2 capacitor is not triangular because of its non-linear nature. We emphasize the importance of measuring the capacitance across a non-linear element using a circuit such as Fig. 1c. A strong nonlinearity may distort the signals measured by a capacitance meter, whereas the entire circuit can be included in the analysis model of the signals measured in Fig. 1c to extract the behavior of the nonlinear element.

a Schematic of the measurement setup used to obtain quasi-DC IV characteristics of the ZrO2 capacitor. b Quasi-DC IV characteristics of the device obtained at 83 mHz. Current is plotted in both linear and logarithmic scale to reveal the tunneling current. c Schematic of Sawyer-Tower circuit used to obtain dynamic QV characteristics. d Voltage waveform measured across the ZrO2 capacitor using a differential probe and the charge waveform on the series capacitor measured using a passive probe. e Dynamic QV characteristics of the ZrO2 capacitor obtained at 3 frequencies (50, 100 and 200 kHz) and f with input voltage amplitudes from 1 to 4 V across the ZrO2 capacitor at 100 kHz.
To investigate the dynamical QV characteristics of the ZrO2 capacitor, input voltage frequencies of 50 kHz, 100 kHz, and 200 kHz were applied for 4 V triangular wave amplitude. The results are shown in Fig. 1e. The near independence of the observed hysteresis on frequency is interesting and will be discussed later. As the frequency decreased, the saturation charge slightly increased and the coercive voltage slightly decreased, yielding an apparent small rotation of the traces anti-clockwise about the origin, an effect attributed to local ferroelectric domains with different relaxation times28,29. The voltage amplitude across the ZrO2 capacitor was then increased from 1 V to 4 V at 100 kHz, with the results shown in Fig. 1f. At lower amplitudes (1 V & 2 V), the ZrO2 capacitor exhibited linear QV characteristics without hysteresis. At larger amplitudes (3 V & 4 V), non-linearity emerged in the form of pinched double hysteresis loops, with a small apparent remnant charge at zero voltage. The area of the hysteresis loops increased with voltage amplitude, indicating an increase of the amount of material undergoing the field-induced ferroelectric phase transition6 after a critical internal field has been attained. Such qualitative behavior in ZrO2 capacitors has been consistently reported in the literature and described using various models5,7,20.
Compact nonlinear model of ZrO2 capacitor
An accurate compact model is essential for emerging electronic devices, particularly for non-linear devices such as ZrO2 capacitors, to extract and compare key parameters, simulate and analyze circuits, and design integrated circuits and systems. We tested several different models (including a memcapacitor model because of the double-pinched hysteresis, described in the SI). By far the best agreement with our experimental results came from the venerable Landau–Ginzburg–Devonshire (LGD)30,31 theory for the static (but not directly measurable) ferroelectric QV characteristic, and the dynamical response with the Landau-Khalatnikov (LK) equation22,32. Since we are constructing a compact model, we use the physically measurable quantities voltage V and charge Q rather than field and polarization, which is essentially averaging over edge effects, dead layers, domains and domain boundaries of the ZrO2 capacitor.
Using the LGD theory and truncating after ({q}^{6}), the static free energy ({{mathcal{F}}}_{q}) of a ferroelectric sandwiched between two capacitor plates can be modeled as
where (a), (b), and (c) are scaled Landau parameters, and (v) is the voltage across the terminals of the capacitor.
The corresponding version of the LK equation is
Thus, the resultant dynamic equation becomes
where ({R}_{{dyn}}) is a frequency-dependent dynamical resistance of the ferroelectric. Rearranging Eq. (2.1), we obtain
which states that the voltage across the ZrO2 capacitor is divided between the static ferroelectric (first three terms) and the dynamic series resistance (the last term).
To include the experimentally observed tunnel current in the model, a non-linear resistor was added in parallel to the series combination of the nonlinear capacitor and dynamical resistance. The experimental tunneling current (Fig. 1b) was fitted using an exponential equation to model the nonlinear tunnel resistance:
where ({i}_{0}) and (B) are the fitting parameters.
Together, the nonlinear capacitor, the dynamic resistance and the tunnel resistance constitute the compact model for the physical ZrO2 device. Finally, the linear capacitor in Fig. 1a was included to model the circuit as a whole (including the known characteristics of the probes did not affect the results for the ZrO2 device), which is shown in Fig. 2a. Applying Kirchhoff’s current law at node N results in a pair of coupled nonlinear first-order ordinary differential equations (ODEs) that models the circuit:
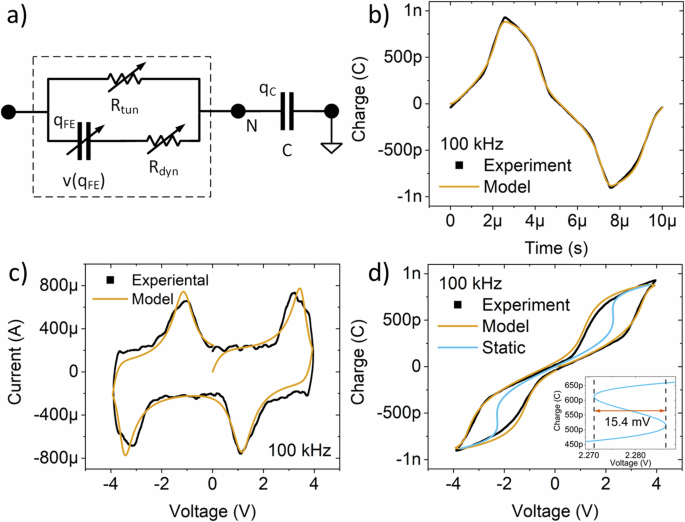
a Schematic diagram of the ZrO2 device model (boxed) and the series capacitor in the measurement circuit. b Calculated dynamic charge Q vs. time of a ZrO2 capacitor overlapped on top of the experimentally measured waveform demonstrates the quality of the model. c Ferroelectric switching current of the model and experiment measurements. d The experimental and best-fit modeled dynamic QV characteristic, along with the calculated static QV characteristic extracted from the model. The inset in panel d shows an expanded view of the static QV around 2.28 V, where a 15.4 mV wide region of NDC was calculated. All the data in panels b–d are for the case of 100 kHz and 4 V amplitude across the ZrO2 capacitor.
Here, ({q}_{{FE}}) and ({q}_{C}) are the charges on the ZrO2 and the linear capacitors in series, respectively, and (v) is the source voltage. Because of the linear capacitor in series, the voltage across the ZrO2 capacitor becomes (v-{q}_{C}/C).
The parameters of the ODEs, specifically the scaled Landau parameters ((a,b,c)), and dynamical resistance (({R}_{{dyn}})), were initially optimized manually through trial-and-error. This involved comparing the solution (({q}_{C})) of the ODEs in Eqs. (4.0) and (4.1) with the experimental data (in Fig. 1d). Equation (2.1) indicates that ({R}_{{dyn}}) needs to scale proportionally with frequency, as the current ((d{q}_{{FE}}/{dt})) scales accordingly. This scaling condition ensures that the left-hand side term in Eq. (2.1) (({R}_{{dyn}}cdot d{q}_{{FE}}/{dt})) is of the same order as the terms on the right-hand side ((v,{aq},b{q}^{3},c{q}^{5})), which is what maintains the area of the hysteresis loops nearly independent of applied AC voltage frequency. The manually optimized ODE parameters were further refined by using them as inputs to the Levenberg–Marquardt (LM) algorithm33,34,35, which resulted in a model that agreed well with the experimental data as shown in Fig. 2b for the case of 100 kHz. The fitting results for 50 kHz and 200 kHz are available in the Supplementary Information (see Supplementary Fig. 6). The set of optimized Landau parameters ((a,b,c)) remained highly consistent across the frequency spectrum (see Supplementary Table 1), with coefficients of determination R2 > 0.99, as they are characteristic of the static energy of the capacitor.
The circuit current, both experimental and model, was computed by differentiating the charge–time data collected at 100 kHz, as shown in Fig. 2c, and then plotted against voltage. To mitigate noise in the experimental current data, the Savitzky–Golay filter was applied to smoothen the raw data. The model succeeded in quantitatively predicting the experimental current measured across a series resistor. The results corresponding to 50 kHz and 200 kHz and for measurements across a resistor are available in the supplementary information (see Supplementary Figs. 5 and 1).
The tunneling charge overshadows the ferroelectric characteristics in the QV curves at low frequencies (see Fig. 1a, b). Additionally, input impedances from the instruments and parasitics interfere, making it essentially impossible to obtain true quasi-static ferroelectric characteristics directly from experimental measurements. However, at higher frequencies and including the entire circuit in the model, we can determine the Landau parameters to high accuracy by fitting the dynamical data and thus use them to construct the static model:
This is plotted in Fig. 2d along with the experimental and modeled dynamical curves obtained at 100 kHz, using the optimized parameters. A close examination of the two transition regions in the static curve revealed a negative slope region less than 16 mV wide, which is smaller than the thermal voltage (25.85 mV) at room temperature (300 K). We thus see that the ~1.5 V width of the hysteresis in ZrO2 is not determined by a large snap-back or ‘negative capacitance’ and instability in the static QV curve, but rather is almost entirely the result of the dynamical resistance, which models the energy dissipated in the ZrO2 as a result of the field-induced ferroelectric transition6,7 and possibly radiative loss.
The model was analyzed in more detail to gain a deeper understand of the ZrO2 capacitor. Firstly, the static (({E}_{{stc}})) and differential (({E}_{{dif}})) elastances (reciprocal of capacitance, to avoid physically unmeaningful divergences) were calculated as:
and plotted parametrically against voltage (using Eq. (5) to convert from (Q) to (V), see Fig. 3a). Two distinctive points of inflection are evident in the plots of ({E}_{{stc}}) and ({E}_{{dif}}), where the ({E}_{{stc}}) curve bends inward before spreading outwards again, and the ({E}_{{dif}}) curve transitions from positive to negative. These plots are the visual markers for the field-induced ferroelectric transition. Contained in the inset of Fig. 3a is the Free Energy curve of the ZrO2 capacitor, plotted using Eq.(1.0) at zero voltage bias ((v=0)) and optimized Landau parameters. The curve is remarkably featureless, with no local minima and only the single global minimum at (Q=0), representing the nonpolar and highly-symmetric tetragonal phase (P42/nmc) ground state of ZrO26,7,36.
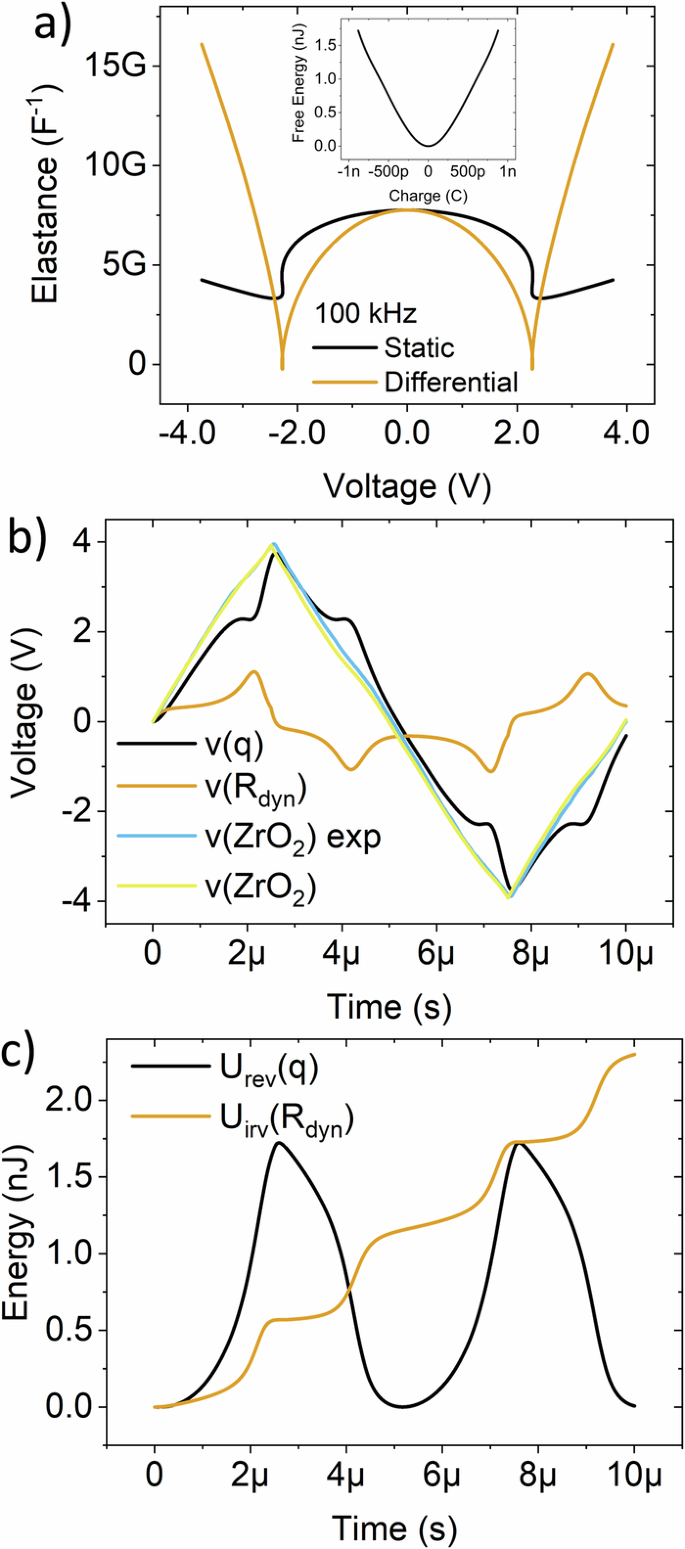
a Static and differential elastances obtained from the model show two regions of negative differential elastance corresponding to the negative slope in the static QV curve. Inset contains the free energy at zero applied voltage calculated from the model where only the minimum at (Q=0{C}) was observed. b Voltage waveforms from the model are plotted against time: voltage across the nonlinear capacitor from the model ((v(q))), voltage across the dynamic resistance ((v({R}_{{dyn}}))), and experimental and modeled voltages across the ZrO2 capacitor. c Reversibly stored energy in the device capacitance and irreversibly energy loss due to the dissipated energy through the dynamical resistance of the ZrO2 capacitor. Panels b and c are for 100 kHz and 4 V amplitude across the ZrO2 capacitor.
Dynamic characteristics and energy of ZrO2 capacitor
The applied voltage across the terminals of the ZrO2 capacitor is distributed between the two principal elements of the model: the nonlinear capacitance and the dynamical resistance. It follows from Eq. (2.2) that (v(q)) and (v({R}_{{dyn}})) are the voltages across them, defined as:
These voltage waveforms, for the case of 100 kHz, plotted against time, can be found in Fig. 3b. The peaks in the (v({R}_{{dyn}})) waveform correspond to the ferroelectric switching in the ZrO2 capacitor. The ferroelectric characteristics of the ZrO2 capacitor were also obtained using a series resistor in place of the series capacitor in the circuit shown in Fig. 1c. Characterization results with the series resistor can be found in the SI. The measured voltage waveform across the series resistor is quite similar to the (vleft({R}_{{dyn}}right)) waveform, and thus reinforces the consistency of our measurements.
The (vleft(qright)) waveform provides insight into the nonlinearity of the ZrO2 volatile ferroelectric capacitor. The plateaus in the (v(q)) waveform align with the peaks of the (vleft({R}_{{dyn}}right)) waveform, which again correlate to the ferroelectric switching. Utilizing these voltage waveforms, we calculated the stored (or reversible) and dissipated (or irreversible) energies of the ZrO2 capacitor. Since energy can only be stored in the capacitance of the model, the reversible energy is defined using Eq. (7.0) as:
Optimized parameters were used to calculate ({U}_{{rev}}left(qright)). Due to the dynamical resistance in the model, energy was also dissipated. The irreversible energy loss is
Both ({U}_{{rev}}left(qright)) and ({U}_{{irv}}left(tright)) were plotted against time for one period of the applied voltage (see Fig. 3c). As the charge on the ZrO2 capacitor increases (or decreases), energy is stored (or returned to the circuit). However, irreversible energy lost to thermal and radiative losses in the ZrO2 capacitor accumulate with time. The trend in irreversible energy loss shows a periodic sharp rise, which coincides with the peaks observed in the (vleft({R}_{{dyn}}right)) waveform, followed by a plateau.
Discussion
This study elucidated the field-induced ferroelectric behavior of nonlinear ZrO2 capacitors through comprehensive experimental measurements and modeling. We developed a compact dynamical model based on the Landau–Ginzburg–Devonshire and Landau–Khalatnikov theories that agreed extremely well with experimental data, and enabled us to quantify the energy storage and dissipation mechanisms of the ZrO2 capacitor. The validation of the model against experimental data provided valuable insights into the frequency-dependent dynamical resistance, nonlinear responses, and negative differential capacitance characteristics of ZrO2 capacitors, the latter of which was found to be extremely small. Our findings not only deepen the understanding of field-induced ferroelectricity in ZrO2 capacitors but also pave the way for the exploration of similar materials that may potentially be used to build oscillators and amplifiers.
Methods
Fabrication of the ZrO2 capacitors
The Zirconium Oxide (ZrO2) capacitors were fabricated in a class 1000 cleanroom. A 100 mm Silicon wafer with 100 nm thermally grown silicon dioxide (SiO2) was chosen as the substrate. A 200 nm thin film of Tungsten (W) was deposited as a blanket film onto the substrate for the bottom electrode using DC sputtering at 100 W power and 4 mtorr working pressure in an AJA Orion 8 Sputtering System. The wafer was then cut into 25 mm ×35 mm coupons. A 10 nm ZrO2 thin-film was deposited on top of the W electrode at 200 °C using a Cambridge NanoTech Savannah 100 Atomic Layer Deposition (ALD) system. Tetrakis(dimethylamido)zirconium (TDMAZr or Zr[N(CH3)2]4) heated to 75 °C and water (H2O) at room temperature served as the Zr and Oxygen (O) precursors, respectively. Photolithography was used to pattern the top electrodes as 50 µm × 50 µm pads, for which 100 nm of W and 50 nm of Platinum (Pt) was sputtered at 100 W and 4 mtorr, followed by lift-off. A second level of photolithography was performed to selectively etch through regions of the ZrO2 to expose the buried bottom electrode. After patterning and developing the photoresist, ZrO2 was dry-etched using Sulfur Hexaflouride (SF6), O2 and Argon (Ar). Subsequently, a 10 nm thin film of Titanium (Ti) and a 50 nm thin film of Pt were deposited using DC sputtering again. The thin film layers were then lifted off to complete metallization and hence define bottom electrode contact pads. Ohmic contact to the bottom electrode was achieved and confirmed using quasi-static linear DC current versus voltage (IV) characteristics and from the low measured resistance. The coupon was annealed at 600 °C for 1 min in nitrogen gas environment in a Rapid Thermal Annealing system to crystallize the ZrO2 thin-film and complete the fabrication of the ZrO2 capacitors. The coupon containing the capacitors was diced and packaged in a dual in-line package (DIP) using wire bonding directly onto the top contacts. This procedure yielded 10 out of 11 good devices as determined from the reproducibility of their measured electrical characteristics. Several devices were subjected to high voltage inputs and long duration waveforms to characterize and recognize device degradation and failure. Other devices were also measured using probe tips that yielded similar but less reproducible results. An appropriately sized sample was subjected to X-Ray Diffraction (XRD) analysis to determine the crystallographic structures of the thin films that made up the ZrO2 capacitors. The XRD analysis was performed with a Rigaku Smartlab X-ray Diffractometer using Copper K-alpha radiation operated at 44 kV and 40 mA. The measurements were acquired at an incidence angle of 1° and a step size of 0.01°, in the range from 20° to 110° (see Fig. 4a–d).
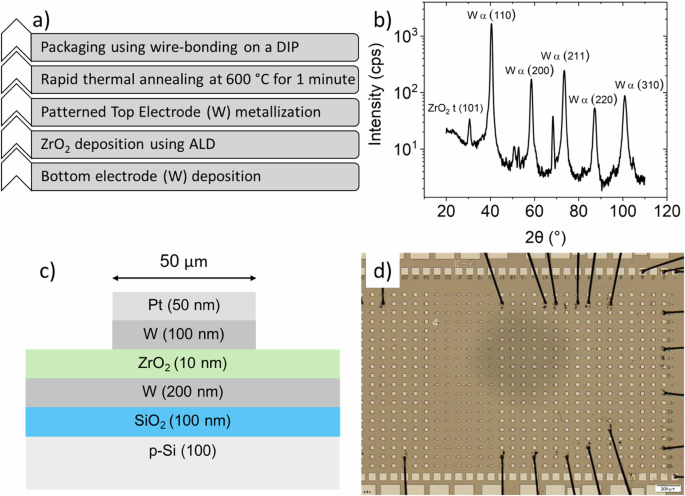
a Fabrication process flow of the ZrO2 capacitors from start (bottom) to finish (top). b Grazing incidence x-ray diffraction data from the ZrO2 thin film confirming its major phase as the tetragonal (P42/nmc) lattice structure. c Cross-sectional schematic of the ZrO2 capacitor fabricated on a Si substrate with 100 nm thermal oxide. d Optical image of the wire-bonded coupon of ZrO2 capacitors. Top and bottom rows of pads are bottom electrode contacts, whereas all those in between are top electrode contact pads.
Electrical characterization
Quasi-static DC IV characteristics were measured using a Keysight B1500A Source Measurement Unit (SMU) at 83 mHz. Dynamic characteristics were obtained using a circuit consisting of a ZrO2 capacitor in series with either a 1 nF linear capacitor or a 910 Ω resistor. A differential probe (Keysight N2750 Differential Active Probe) and a passive probe were used to simultaneously monitor the voltage drops across the ZrO2 capacitor and the series circuit element (resistor or linear capacitor), respectively. Triangular voltage waveforms with different voltage amplitudes and frequencies (1–200 kHz) were supplied as the input signal using a function generator (Keysight 33500B Trueform Waveform Generator). Since this circuit was mounted on a breadboard, necessary precautions were taken to minimize ground loops and to have a unified grounding point. The chassis grounds of the function generator and the oscilloscope were connected using a thick, short, and good electrical conductor. Data from this set-up was used to generate dynamic QV characteristics. The voltages across the two elements being measured were collected in two channels of the Keysight’s MSOX6004A Mixed Signal Oscilloscope.
ODE solver
The Livermore Solver for Ordinary Differential Equations (LSODE/LSODA) was utilized in Python by employing the “integrate” function from the SciPy Library to solve the non-linear first-order ordinary differential equations (ODEs) for the dynamical model37. Optimization of the ODE parameters involved a non-linear least-squares fitting process, achieved through the “curve_fit” function of the SciPy Library. The Levenberg–Marquardt (LM) algorithm was the primary method used for the nonlinear least-squares fitting, whereas the trust region reflective algorithm was used to constrain parameters and prevent unphysical solutions because the LM algorithm can yield unstable results when parameter ranges are bounded33,34,35.
Responses