Feeling Nature: Measuring perceptions of biophilia across global biomes using visual AI

Introduction
With its reliance on technologies, modernisation has led to a significant shift towards indoor living, with people spending ~90% of their time indoors1. This reduced exposure to nature has negative impacts on individual health and social relations2. Additionally, ample evidence3 indicates that regular and direct contact with the natural world can be linked to better physical4 and mental5 well-being, higher life satisfaction3 and pro-environmental behaviours6. Particularly, this holds for densely populated urban areas since cities need nature to thrive7, provide vital ecosystem services8, preserve biodiversity9, and promote human health10. The United Nations Sustainable Development Goals also recognise the pivotal role of urban nature in making cities inclusive, safe and resilient11.
In past decades, an increasing number of studies focused on the connection between people and nature12. Special attention was given to biophilia, which emphasises the inherent human affiliation with other forms of life13. Wilson first introduced the concept of biophilia as a hypothesis of evolutionary biology, advocating that humans’ dependence on nature remained unchanged in their transition from wild to anthropised habitats due to its genetic origin14. The effects of people–nature interaction were examined across various disciplines, including medicine15, psychology16, ecology17, social science18, architecture19, urban planning20, politics21 and economics22. Expanding on this foundation, biophilic design23 and biophilic urbanism24 have emerged as approaches to integrate nature into the built environment, thereby maximising its benefits in cities.
We establish our research on biophilic perceptions (BP) in urban areas by defining biophilia as the positive emotional and sensory effects experienced when humans interact with nature. In this context, nature includes living beings, bio-based elements within the cityscape, and anything possessing a life of its own. Among biophilic experiences in urban contexts, BP mainly offers psychophysical25 and emotional26 benefits. These effects depend on both the quality of the experience in nature and the quality of nature itself27. Numerous studies on psychological restoration in nature examined various environmental features that foster biophilic effects, highlighting the relational values between humans and nature28 and the diverse qualities of nature8 that contribute to personal well-being4 and environmental restoration9. Despite the strong correlation between real-world nature exposure and its benefits27, recent studies showed comparable health benefits from biophilic experiences conducted indirectly or through virtual reality29. Further investigation is needed, particularly in linking biophilia and human perception through AI-driven applications.
In this paper, we concentrate on visual perceptions to explore how individuals experience biophilia in urban environments. Although biophilia relates to all senses, we prioritise BP for two primary reasons. Visual interaction with nature offers the most direct pathway to experience biophilia and enjoy its benefits. Moreover, the abundance of visual datasets for cities worldwide enables the quantitative measurement and comparison of BP on a global scale. Most research on BP and perceived restoration in cities30 focused on green space preferences31 and emotional states32, or being limited to specific locations, employing methods that are challenging to replicate and automate. Existing research on urban perception highlights the importance of nature quality but fails to identify the aspects affecting it33 or to distinguish between human-made and natural elements in the cityscape34. Within the same topic, global comparative studies explored urban dimensions35 rather than geographical differences, ignoring cross-gender visual mechanisms such as plant blindness—the human inability to notice plants in everyday life36—which causes a loss of information and emotional effects37.
This study addresses both theoretical and methodological gaps in current research on BP. Despite the importance of biophilia to all humans, we undertook a theoretical investigation to determine whether BP is universally experienced or influenced by geographical conditions and variations in nature. To achieve this, we analysed city cases distributed across eight biomes on different continents. Methodologically, we implemented machine learning models and Google Street View (GSV) images33 to measure how people perceive biophilia in cities. In this direction, visual artificial intelligence38 (visual AI) has experienced significant growth in recent years due to openly accessible data sources34, thus showing promise for quantifying BP. We developed a two-step approach that evaluates multiple aspects of the cityscape affecting BP beyond only greenery and incorporates the opinions of the local population. First, we applied machine learning models to assess BP through 25 visual biophilic classes (BC) in each city, which refers to nature-based elements of the urban environment as the biophilic settings (BS), employing metrics based on coverage, diversity, distribution, intensity, and specificity. Second, we used the visual AI model to calculate the biophilic metrics based on feedback from 400 individuals residing in our city cases to quantify BP on a global scale.
In addition to contributing to the understanding of the universality of BP, our research provides novel biophilic metrics derived from a scalable visual AI model application. These measurement tools can be deployed in any city worldwide to enhance biophilic experiences and to inform urban planning decisions accordingly.
Results
The primary findings of this study centre on comparing the presence of biophilia, represented by nature-based elements within the urban environment (termed BS), and the perceptions of biophilia within the cityscape (termed BP). This comparison was conducted across eight cities and their corresponding terrestrial biomes (see Fig. 1): Trondheim (tundra); Amsterdam (temperate forest); Quebec City (coniferous forest); Singapore (tropical forest); Barcelona (Mediterranean forest); Buenos Aires (grassland); Nairobi (savanna); Dubai (desert). The rationale behind this site selection is detailed in the “Methods” section and further elaborated on in Supplementary Table 1.

Selection of terrestrial biomes and their corresponding city cases considered in this study (data from ref. 40). Additional information on global biome classification is available in Supplementary Table 1.
The subsequent sections begin by presenting the biophilia status quo measured in the existing settings (BS) through specific metrics. Following this, we detail the BP based on the outcomes of the “Feeling Nature” survey conducted in each city case, as outlined in the “Methods” section and Supplementary Figs. 2 and 3. Lastly, we report on the BP assessed by calculating the same metrics applied to the BS with survey outputs. Derived from both quantitative and qualitative analyses, the results focus on 25 BC identified through a machine learning model known as dense prediction transformer39 (DPT), which utilises visual AI to categorise pixels in GSV imagery. These BC, selected from a broader set of 150 semantic classes detected by the DPT model, represent natural elements and bio-based features present in the urban environment, as depicted in Supplementary Fig. 4. Furthermore, the 25 BC pertain to four biophilic categories of the cityscape: greenscape; waterscape; landscape; living beings (see the “Methods” section and Supplementary Fig. 4).
Biophilic settings
BS was used to gauge the presence of biophilia in each city case through 25 BC identified using a visual AI model (DPT) applied to GSV images. This assessment is based on three metrics: coverage measures the extent of the BS by quantifying image pixels associated with the 25 BC; diversity evaluates the variety of BS by counting the number of diverse BC present within each street image; distribution examines the spatial spread of the BS. Among the 25 BC, the highest BS values are attributed to ‘tree’, ‘grass’ and ‘plant’, with significant coverage values observed in seven out of eight cities. The ‘tree’ class dominates in Singapore (0.60), whereas Dubai exhibits a minimal value (0.06) for the same class. Nairobi stands out with the highest coverage value for ‘earth’ (0.33) within the landscape category (Fig. 2; Supplementary Table 3). Diversity presents low values in all cities. However, Trondheim is the city most diversified in terms of BS, with 8 BC detected as opposed to the less diverse Buenos Aires, where only four distinct BC out of 25 were identified. These four classes, including ‘tree,’ ‘grass,’ ‘plant’ and ‘earth’, are common across all biomes although in different percentages. As illustrated in Fig. 3, peak values are 64% for ‘tree’ in Barcelona (Mediterranean forest), 54% for ‘earth’ in Dubai (desert), 32% for ‘grass’ in Quebec City (coniferous forest) and 14% for ‘plant’ in Nairobi (savanna). In terms of biophilic categories, diversity in BS is associated with greenscape in Singapore (93%) and landscape in Dubai (61%). The spatial distribution allocates a major presence of BS in Singapore and Quebec City, with higher rates in suburbs and the countryside than the city core in all cities (Fig. 4).
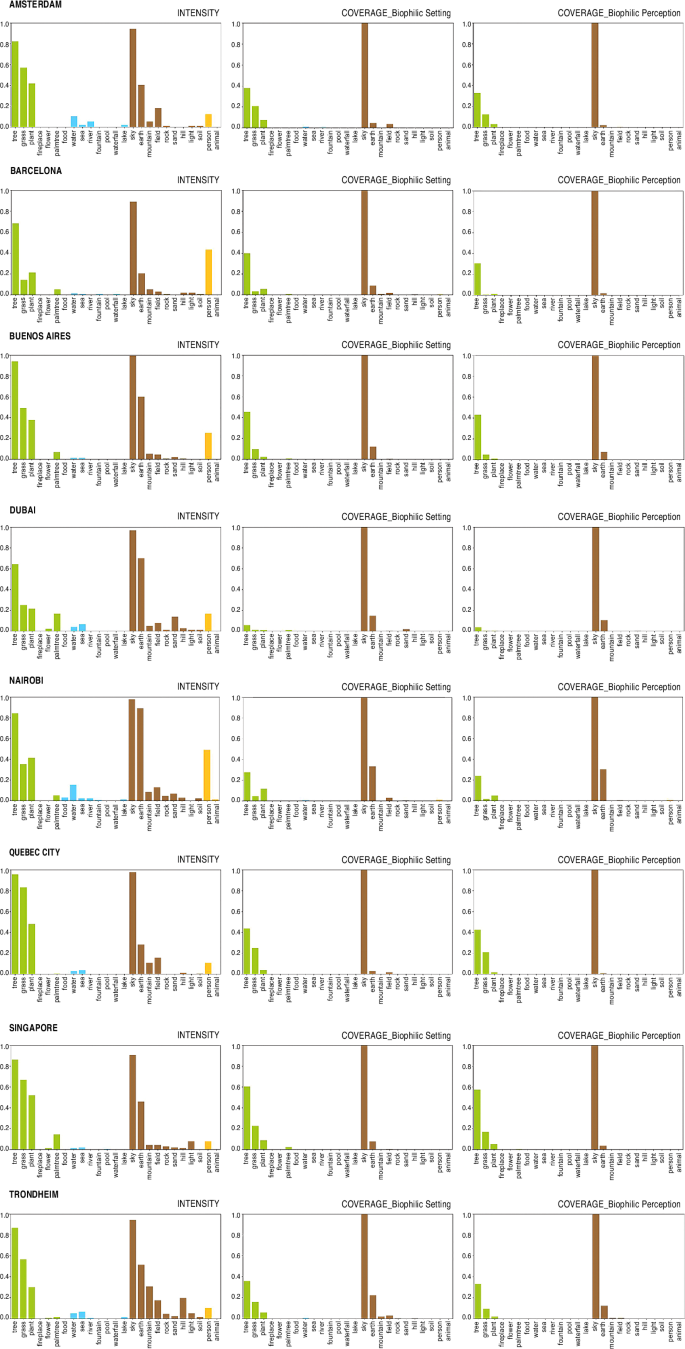
This figure illustrates the values of intensity, BS coverage and BP coverage. Bar plots of intensity are separately displayed in the leftmost column as a biophilic coefficient. Bar plots of BS coverage and BP coverage are juxtaposed in the second and third columns for each city case, respectively. The y-axis of the three bar plots shows values ranging from 0 to 1, whilst the x-axis denotes 25 BC. Numerical values corresponding to the bars are provided in Supplementary Table 3.
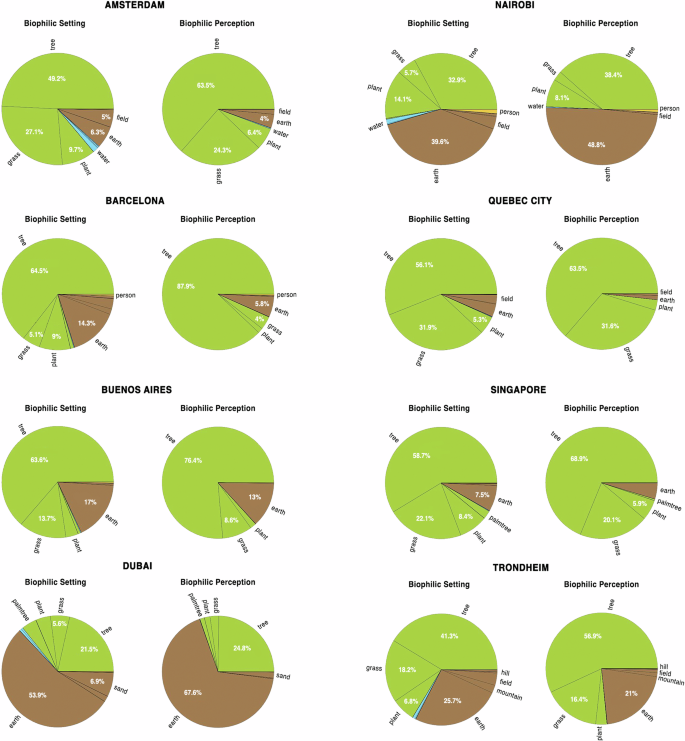
This figure illustrates BS diversity and BP diversity values in the left and right pie charts, respectively, for the eight city cases. Whilst diversity values were calculated for all 25 BC, the pie charts depict the relative prevalence of specific BC in BS and BP, excluding the biophilic ‘sky’ class due to its disproportionate number of pixels in GSV images processed via DPT, overshadowing other BC. Complete results for BS diversity and BP diversity are provided in Supplementary Fig. 5.
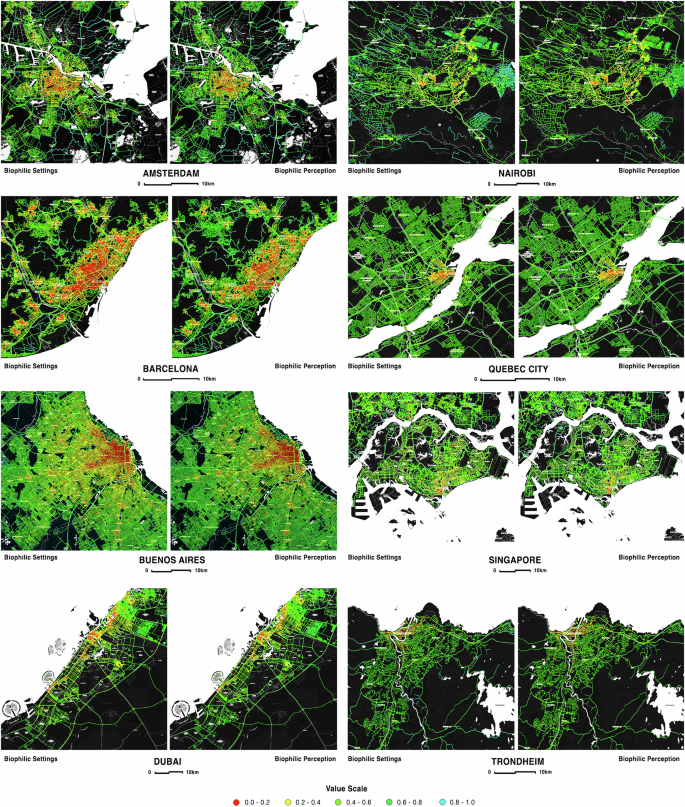
This figure presents a comparative overview of the eight city cases mapped through BS distribution on the left and BP distribution on the right. All maps are oriented north and scaled to the metrics of each city. BS and BP values are divided into five intervals, each incrementing by 0.2 and ranging from 0 to 1. These intervals are represented by five colour shades: red, yellow, light green, dark green and cyan. Warmer shades (red) indicate lower values, whilst cooler shades (cyan) represent higher values.
These findings highlight a significant correlation between local geographies and the measured BS, with greenscape prevailing in forest-based biomes (tropical, coniferous, Mediterranean) and landscape dominating in drier biomes (desert, savanna).
Biophilic perceptions: Insights from the Feeling Nature survey
We conducted the Feeling Nature survey with 400 participants, 50 from each of the eight city cases. Their feedback allowed us to evaluate BP via metrics aimed at identifying urban features that elicit more positive feelings. Additional information on the survey can be found in the “Methods” section and Supplementary Figs. 2 and 3. Among the participants, 54% were women, with the majority falling within the 26–40 age group. Dubai was the only city where young adults under 25 years constituted the majority of survey participants (42%). Minority groups, in terms of both age and gender, comprised <3% of the total participants in each city. Despite offering six language options, most respondents preferred to complete the survey in English. Further demographic details are provided in Supplementary Table 2.
Based on the survey outcomes, BP values were explored quantitatively and qualitatively. Through the intensity metric, which assesses the significance of BP from the most positively rated images in the Feeling Nature survey, Visual AI computation revealed that higher BP values are linked to BC within the biophilic categories of greenscape and landscape (Fig. 2; Supplementary Table 3). Regarding the 25 BC, ‘sky’ is the biophilic element perceived most positively across all cities, showing the highest value in Buenos Aires (0.99), followed by ‘tree’ (which exceeds the threshold of 0.82 in six out of eight cities), ‘grass’ (0.83, Quebec City) and ‘plant’ (0.52, Singapore). Respondents living in arid or rocky biomes, such as Nairobi (savanna), Dubai (desert) and Trondheim (tundra), were most attracted to land-related BC. Individuals in Amsterdam exhibited a higher BP towards waterscapes, whereas those in Nairobi showed a stronger affiliation towards people and wildlife (living beings).
These visual preferences are validated by comments gathered in the Feeling Nature survey. We quantified the BP using language processing (NLP) to model textual survey data. The outcomes of this analysis are represented in cosine similarity scores and matrices aimed at evaluating the semantic analogies between texts and the 25 BC based on word frequency. Figure 5 depicts BC within greenscape being highly ranked, with ‘tree’, ‘grass’ and ‘plants’ consistently occupying the top positions across all cities. As explicitly mentioned in the survey comments, ‘light’ elicited more positive feelings among the BC of the landscape category. The survey comments were analysed using specificity, a qualitative biophilic indicator introduced to identify urban features beyond 25 BC that evoke more positive feelings, to uncover additional aspects of BP. Under this metric, cityscape elements were categorised into four main topic clusters and 14 sub-topic clusters, as described in the “Methods” section. Among the latter, four fall under nature-based topics, whilst the remaining 10 fall under non-nature-based topics. The specificity metric indicated that a nature-based environment drives positive feelings in 49% of the comments in all cities and biomes, followed by the anthropogenic environment (28%), feelings and concepts (19%), and city identifier (4%) (see Supplementary Table 5). Figure 6a presents the interrelations between each city and the 14 sub-topic clusters, highlighting Quebec City leading in greenscape (44%) and Trondheim in landscape (22%), among the nature-based sub-topic clusters. Under the non-nature-based topics, specificity reveals that emotional and sensory effects analogously experienced through BP are associated with intangible aspects of the urban environment, with Trondheim dominating in positive feelings (25%) that include cleanliness, liveability, safety, and homeliness. Tangible features also contribute to BP benefits, as evidenced by Nairobi standing out in terms of mobility and infrastructure (19%), whilst Barcelona (18%) focuses on the built environment. According to the city identifier topic cluster, Barcelona was the most recognised city (6%), while Buenos Aires was the least recognisable (1%). Local features enhancing BP by inspiring feelings of belonging to the place, but they vary from case to case: bikes (Amsterdam); building types (Buenos Aires); historical neighbourhoods (Barcelona); desert (Dubai); motorcycle taxis (Nairobi); river (Quebec City); public housing (Singapore); snow (Trondheim). Regarding BP attributes, nature-based features, such as environmental effects (sunlight, shadow, glare, cooling), seasonal elements (flourishing canopies, snow), and colour aspects (green trees, blue skies), are correlated with higher BP values. The specificity metric allowed us to identify gender differences in BP. Figure 6b indicates that the nature-based environment is perceived more positively across genders in all cities, with higher BP values reported among women from Quebec City (63%) and men from Dubai (58%). Concerning the other topic clusters, a benefit-oriented peak is observed in the anthropogenic environment among men from Dubai (56%) compared to women (44%), whereas women from Trondheim prioritise feelings and concepts (54%) more than men (36%). Further specificity data are available in Supplementary Tables 5 and 6.
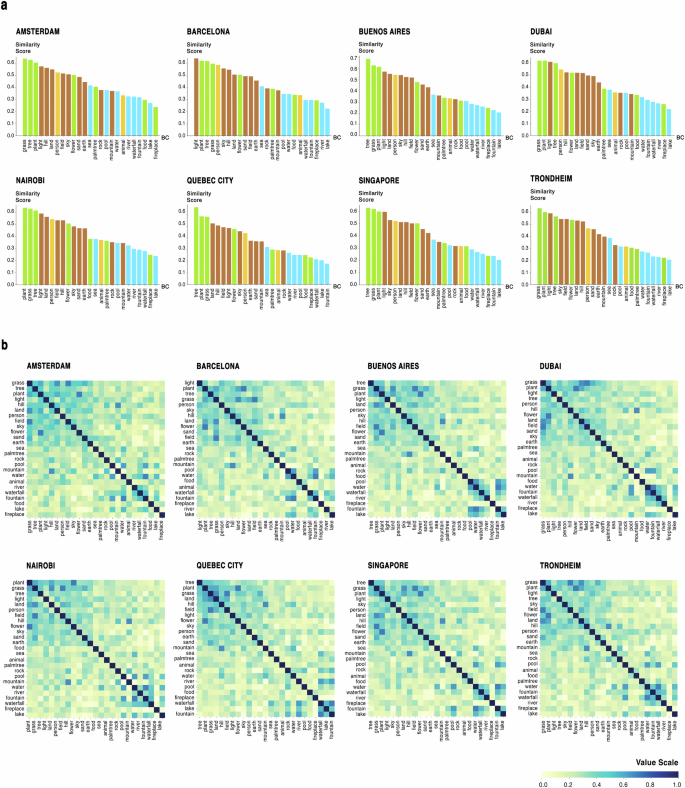
a Bar graphs for each city case display the percentage values of cosine similarity scores on the y-axis (ranging from 0 to 1), with the 25 BC depicted on the x-axis. b Seaborn heatmaps illustrate the cosine similarity matrices, indicating the pairwise similarities between the 25 BC for each city case. Numerical values corresponding to the analyses are provided in Supplementary Table 4.
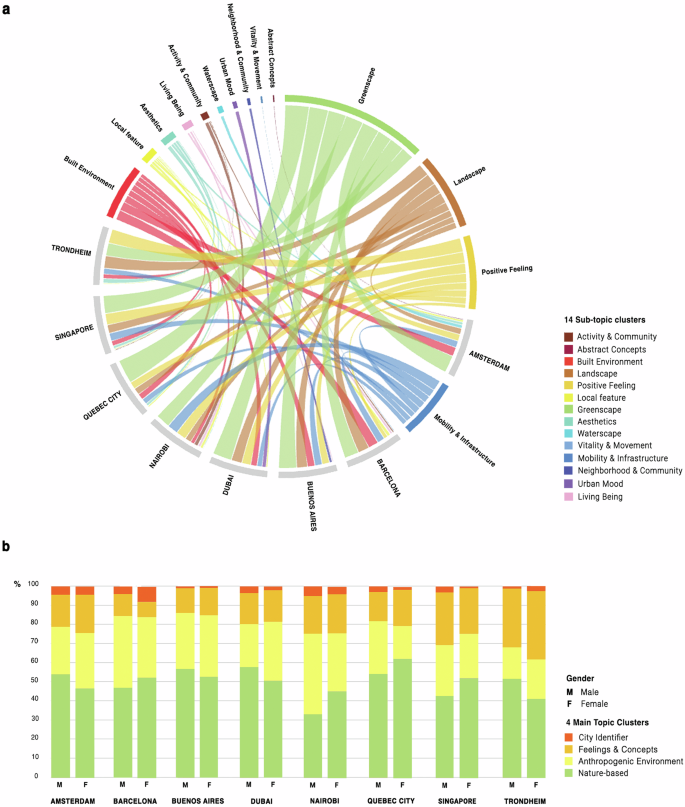
This figure outlines the qualitative indicator of specificity, associating the highest values of BP with cityscape elements grouped into four main topic clusters or 14 sub-topic clusters resulting from topic cluster modelling of survey comments. a The chord diagram highlights interrelations between each city case (grey arcs) and 14 sub-topic clusters (colourful arcs) based on descending values of BP. b The double-bar chart displays the values of BP by specificity, considering the four main topic clusters perceived more positively by male and female respondents in the Feeling Nature survey. The x-axis represents gender-based pair bars per city, whilst the y-axis rates BP in percentage values. The related datasets are included in Supplementary Tables 5 and 6.
Biophilic perceptions: metric-based computation
We estimated the three biophilic metrics of coverage, diversity and distribution based on the intensity values obtained from the Feeling Nature survey, and then evaluated BP across the eight city cases and biomes. The details of these adjusted metrics, termed perceived coverage, perceived diversity, and perceived distribution, are thoroughly explained in the “Methods” section. Figure 2 illustrates perceived coverage, indicating lower values in BP when compared to the original coverage values related to BS across all cities. Notably, Trondheim (0.29) exhibits the greatest disparity between BS and BP in coverage, followed by Barcelona (0.27) and Amsterdam (0.25), whilst Quebec City (0.11) shows the least difference. Based on perceived diversity, there was a decrease in the number of diverse BC; however, their perceptions increased among the predominant classes of BS in the same cities. For instance, ‘tree’ increased from 64% to 88% in Barcelona, whilst ‘earth’ rose from 54% to 68% in Dubai (Fig. 3). Greenspace is the most perceived biophilic category in six out of eight cases, while landscape dominates in the remaining two (Dubai, Nairobi). Figure 4 presents the spatial distribution of BP across the eight cities. The comparative maps highlight a general increase in BP, particularly in urban central areas, which are perceived as more biophilic than the existing BS. This positive difference between BP and BS is more pronounced in Barcelona, Amsterdam and Singapore.
Discussion
The benefits arising from human–nature interactions are garnering growing interest across various disciplines, particularly within the biophilia research field. This study offers a global outlook on how individuals experience the visual aspects of biophilia in urban environments in the eight biomes. Since nature varies in terms of geography, climate and biodiversity, we assess whether BP is universal or influenced by local conditions quantitatively, qualitatively, and spatially. To test the hypothesis of BP universality, we compared BS and BP.
Across all sampled cities, our quantitative analysis reveals that the actual presence of biophilia (BS) exceeds people’s perceptions of it (BP) in the same urban scenario. This discrepancy, common to all cases, is not a contextual preference but rather confirms an atrophied evolutionary trait of humanity, as Wilson13 argued: while modern humans adapt to indoor urbanisation, they remain unchanged in their inherent need for nature14. Findings from the coverage metric show that the greatest and least disparities between BS and BP are encountered in the tundra and coniferous forest, respectively, two biomes close in geographical location but quite distinct in terms of their greenscape and landscape features. Among land-based biomes, for instance, the tundra exhibits the highest discrepancy in the landscape category, with only five out of eight biophilic classes perceived in the urban environment. Conversely, among forest-dominated biomes, the coniferous forest shows the minimum gap between biophilic presence and perception in greenspace. We observe a significant correlation between urban elements quantified in BS and the local biome aspects perceived through the 25 BC or their corresponding four categories (BP). Specifically, the highest values of BP are associated with greenscape elements in forest-based biomes (tropical, coniferous, Mediterranean) and landscapes in drier biomes (desert, savanna). This association demonstrates the extent to which the local biome influences BP. Based on the discrepancies in diversity metric between BS and BP, we note that BP and its positive effects depend more on the diversity among biophilic elements than on their relative quantity in the cityscape. Even our spatial analysis supports such a correlation: although the disparities between BS and BP maps are minimal, individuals tend to perceive natural elements in urban cores more positively, irrespective of their real presence or amount. According to the distribution metric, Singapore emerges as the most balanced case between the existing BS and their perceptions (BP) in both the city centre and suburbs, owing to the abundance of vegetation in the tropical biome. While raising awareness of urban nature’s diverse values and promoting their preservation8, our biophilic maps emphasise the crucial role of BP in sustainable urban development11, both locally and globally. BP encourages the careful design of green spaces regarding presence, quantity, and spatial distribution, particularly in city centres where nature is scarce. Its universality makes BP an evidence-based strategy for global planning.
Our qualitative analysis expands the boundaries of the biophilic experience beyond nature. The Feeling Nature survey uncovered that BP is influenced by both nature-based and non-nature-based elements in urban areas. However, the positive feelings stemming from visual interaction with the cityscape are predominantly linked to natural environments, whereas individuals are more responsive to the specific characteristics of the local biome within the nature-based environment globally. This observation is consistent with the BP attributes elucidated in our survey. Nature indirectly influences the perception of urban elements by featuring them with evocative patterns, natural hues, seasonal variations, or other environmental factors. Moreover, BP depends on the emotional sphere, even in contrasting biomes such as tundra and tropical forests. Lastly, BP is further enhanced by anthropogenic features and city identifiers, particularly in cities with historically established built environments like Barcelona, making it more recognisable among all the cities examined. The major qualitative differences in BP across cases are not linked to the natural environment and its qualities but are rooted in the human and civic values that uniquely shape each city through urban morphology.
All comparative analyses highlight that positive emotions and sensory effects experienced through BP are mostly associated with nature-based elements of the urban environment, regardless of cities, biomes, or gender. This supports the hypothesis of the universality of BP. Nevertheless, BP still varies according to the contextual biome and its biodiversity.
Our quantitative and qualitative results shed further light on psychological restoration in nature: 25 BC identify environmental features universally recognised for their impact on mental well-being4; they uniform these qualities of nature8 across diverse geographies to preserve their multiple values9; and they support the benefits of visual and digital biophilic experiences28. Whilst confirming previous studies30 on the significance of greenery as the predominant biophilic element associated with BP benefits. Our findings challenge the theory of plant blindness36, showing that the human eye, regardless of gender or location, is more attracted to natural elements than to anthropic ones across all cities; in 6 out of 8 cases, these elements are green.
This study advances the biophilia research field with both conceptual and methodological advancements. Conceptually, we extend the biophilia framework in three ways. (1) We emphasise the primary role of visual perception—specifically BP—in experiencing biophilia in urban settings and its psychological and emotional effects. These benefits are equally estimated in direct and indirect interactions with nature. (2) We investigate the biophilic connection between humans and nature through geographical entities (terrestrial biomes) and gender profiles. This approach allowed us to demonstrate the universality of BP by addressing the contextual limitations (city, country, continent) found in previous studies35 and recognising gender as a significant factor in BP. This is the first study to test how biophilia is perceived globally based on these two criteria. (3) We argue that while human-nature relations mostly drive BP benefits, positive feelings about a city may transcend its natural elements or specific locations. Methodologically, we propose a set of AI-driven metrics to quantify and qualify biophilia using BS and BP, applicable to any city. These digital measurement tools encourage city-makers to prioritise BP in the urban agenda, aligning with citizens’ preferences. Furthermore, we introduce the 25 BC as a means to decode the urban environment through the lens of biophilia. This approach enhances research on urban perception by applying a machine-learning model34 to better evaluate natural capital.
Although valuable, this study also has limitations. Biophilia was examined indirectly through an online survey, relying solely on vision and declared emotion, without measuring biophilic experiences through direct contact with the environment and multiple senses: these limitations are due to the adopted AI-visual approach, which prioritises image-based perception over the quality of the experience itself27. The selection of city cases by biome and the global scale, along with the number and demographics of participants in the Feeling Nature survey, may have influenced the results. Despite the low survey sample size, it is sufficient to calibrate the DPT model based on online responses. The varied imagery and textual feedback from respondents ensure the research’s robustness, confirming our hypothesis across all case studies. We acknowledge the convenience of disseminating the Feeling Nature survey through personal and public networks. Additionally, using a limited number of GSV images for survey pair comparison, albeit chosen from those scored as the most lively and beautiful from the Place Pulse 2.0 dataset35, could have impacted the findings. Moreover, due to the 3 years of GSV capture, temporal and seasonal mismatches among the cases may have impacted the survey respondents’ perceptions differently. While the DPT model39 represents a powerful tool for dense prediction tasks in computer vision, especially with large-scale datasets and various input sizes, its application has limitations. DPT processes an image as a grid of pixels, assigning each pixel to one of the 25 BC based on spatial relationships, without considering the potential co-presence of multiple biophilic features or class overlapping within the same image element. To address this constraint, we complemented the visual analysis with textual analysis, employing other transformer models built on similar deep neural network architectures to determine the effective values of BP. Finally, the coverage metric revealed an eventual bias in using DPT to measure BP through 25 BC, attributed to the disproportionate predominance of pixels related to the biophilic ‘sky’ class in outdoor images. To mitigate this, we differentiated our results by considering them both with and without this class (Fig. 3; Supplementary Fig. 5).
Future research could explore other classifications of biomes, some of which suggest a wider array of biomes. Whilst our focus was on outdoor biophilia within the cityscape, investigating the impact of BP in indoor and liminal environments would provide valuable insights. The further development of measurement tools is recommended to address one of the main knowledge gaps in the biophilia research field. Finally, involving city-makers, local government, and NGOs as survey respondents could provide valuable perspectives for future insights.
Methods
Study area
To test the hypothesis that BP is universal—meaning that people perceive nature in urban environments similarly regardless of their geographic location—we conducted the study in eight cities spanning five continents, representing the main terrestrial biomes40. The biome concept organises large-scale ecological variations based on factors such as climate, temperature, light, precipitation and soil type, which collectively influence the density and diversity of vegetation and wildlife40. Earth scientists have differing opinions on biome classification, ranging from 4 to 38 categories, including domains, ecozones, life zones, and biomes; and there is no universal consensus except for the dual classification distinguishing terrestrial and aquatic biomes. After conducting a review (summarised in Supplementary Table 1), we selected the eight terrestrial biomes that are both highly urbanised and commonly found in various classifications. Subsequently, we chose eight cities with historical or cultural significance to represent each biome. Figure 1 illustrates the selection of cities and corresponding terrestrial biomes considered in this study: Trondheim (tundra); Amsterdam (temperate forest); Quebec City (coniferous forest); Singapore (tropical forest); Barcelona (Mediterranean forest); Buenos Aires (grassland); Nairobi (savanna) and Dubai (desert).
Research design
Our methodology combines quantitative and qualitative approaches and comprises five steps. First, we collected data in the form of streetscape images using GSV as an open-source platform. These images served as a database for quantifying both nature-based elements of the urban environment (termed BS) and human perceptions of biophilia via vision and declared emotions in the same urban context (termed BP). Second, we identified city features related to BS and BP in the eight selected cities and processed GSV imagery through semantic segmentation. This involved applying a specific vision transformer model39 (DPT) that utilises visual AI technology to associate pixels with objects of the built environment under a biophilic classification. The categorisation was derived from an initial selection of 25 BC chosen from the existing 150 semantic classes provided by the DPT model (Supplementary Fig. 4). Then, we computed BS via three metrics: coverage, diversity and distribution. Third, for each city, we constructed a survey using a selection of GSV images scored as the top and bottom 5% in terms of being lively and beautiful resulting from the Place Pulse 2.0 dataset35. We employed a machine learning model trained to predict emotional perceptions of the cityscape based on GSV images34, using data from thousands of people worldwide (Supplementary Material 1). We disseminated this online survey in our eight city cases to gather first-hand data on which visual features related to BP bring more positive feelings to the respondents, who should have lived in the corresponding city for at least 12 months. Fourth, we utilised the survey feedback to weigh our biophilic metrics and measure BP employing the DPT model. Additionally, we implemented spatial analysis using the distribution metric to map BS and BP in each case study. Last, we conducted a qualitative analysis of the survey comments to gain insights into BP through machine learning models for natural language understanding. Finally, we compared metrics and maps to interpret BP worldwide.
Datasets
The present study utilised two datasets: a visual database comprising GSV images collected from eight cities and the results from our online survey (Feeling Nature).
We gathered GSV images within a 15–25 km radius of each city centre. The number of GSV images collected varies across cities as follows: Amsterdam (122,240); Barcelona (107,560); Buenos Aires (464,724); Dubai (117,224); Nairobi (111,052); Quebec City (106,048); Singapore (178,224), Trondheim (38,752). These images were sampled at 15-m intervals along each city’s road network. Each sampling point is characterised by a location point ID, capture timestamp (expressed in year and month), GPS coordinates, image size (480 × 600 pixels), horizontal field of view (90°), and the compass heading of the camera, which divides the 360° spherical view into four viewing angles of 90° each corresponding to the four cardinal directions. The images were captured between 2022 and 2024, and collected by the authors between May 2023 and February 2024. This image dataset was used to calculate both the BS and BP for each city. To compute the related metrics, we ran the Feeling Nature survey based on a selection of GSV images derived from the application of a deep learning model trained34 on the Place Pulse 2.0 dataset35. Launched in 2013 by Dubey and colleagues35 from MIT Media Lab, Place Pulse 2.0 is a web interface designed to measure how people perceive subjective aspects of the urban environment through pairwise comparisons from users. Place Pulse 2.0 dataset contains 110,988 images from 56 cities and 1,170,000 pairwise comparisons provided by 81,630 online volunteers from 162 developed and developing countries35. For each pairwise comparison, respondents indicated whether both images inspired the same feeling or if one image scored higher across six perceptual dimensions: safe, lively, boring, wealthy, depressing and beautiful. From these dimensions, we selected lively and beautiful as two ‘positive feelings’ that evoke emotional responses, serving as the baseline to build our dataset for measuring BP (further details about the results from Place Pulse 2.0 dataset are provided in Supplementary Material 1). Lively closely aligns with the biophilia concept introduced by Wilson because it pertains to ‘the innate tendency to focus on life and lifelike processes’14. Beautiful is an aspect of the human inclination toward the aesthetics of nature and living forms, playing a fundamental role in biophilic design by fostering a place-based relationship between people and nature through attraction and beauty41. We initially ran a deep learning model pre-trained34 on the Place Pulse 2.0 dataset35 for our eight cities, selecting the top 5% of images with the highest scores (‘top lively’, ‘top beautiful’) and the bottom 5% of images with the lowest scores (‘bottom lively’, ‘bottom beautiful’). Then, we randomly compiled the four groups of GSV imagery for each city, with each group consisting of an equal number of images (N = 40). These subsets served as the image sources in our online survey (Feeling Nature), conducted as a subsequent phase of our study.
Recognising the significant role that contextual knowledge may play in BP, we conducted the Feeling Nature survey (Supplementary Figs. 2 and 3) from August to October 2023. The survey was disseminated through the personal and public networks of the research team, both within and outside academia. Despite receiving over 500 completed surveys, they remain disproportionate among cases, with the lowest count being 53. Therefore, we established a minimum threshold of 50 respondents per city, totalling 400 participants globally (Supplementary Table 2), considering this sample size is sufficient to calibrate the DPT model based on online responses. The online Feeling Nature survey consists of ten screens, nine questions and five sections (see Supplementary Fig. 2). A summary of the survey sections is presented as follows:
-
(1)
General information: The first section provides details about the research project, including its purpose, topic, team and participating institutions. It also includes information on the survey duration, implementation mode, voluntary participation, and data processing and protection measures. Participants were provided with an online informed consent and the option to choose from among the six languages officially spoken in the eight case study cities (English for Singapore and Nairobi; Dutch for Amsterdam; Spanish for Barcelona and Buenos Aires; French for Quebec City; Norwegian for Trondheim; Arabic for Dubai). This language opportunity is intended to make respondents more familiar with the survey interface and comfortable in replying in a language that aligns with their device settings and cultural background.
-
(2)
Requirement for participation: Participants were asked to select a city in which they had lived for at least one year. If they lived in more than one city for at least one year, they could select another city.
-
(3)
Pair image comparison: This involved a method used to gather urban perceptual preferences. Participants were presented with a series of six pairs of images, resulting in 2400 selections across the eight cities. They were tasked with selecting the image (left or right) evoking more positive feelings and providing feedback on the elements and aspects that contributed to these feelings. The paired images were automatically selected from the four subsets of ‘top’ or ‘bottom’ lively and beautiful and presented in a fixed sequence of ‘left vs. right’ combinations, as depicted in Supplementary Fig. 3. To ensure research reliability, no image was repeated more than five times. The online survey utilised a total of 1280 images, with each city case allocated 160 images (40 images from each of the four different image subsets).
-
(4)
Personal data: This portion inquired about participants’ age and gender.
-
(5)
Closing information: At the end of the survey, an expression of gratitude and a contact form were provided. Additionally, a ‘restart’ button invited participants to repeat the survey for any city that met the initial participation requirement. The survey was developed using Vercel’s Frontend Cloud and hosted on Amazon AWS to ensure secure worldwide access and data collection.
Quantifying biophilic settings
The quantitative analysis involved two steps using visual AI to assess biophilia in each city: measuring BSs without any resident input and measuring BP based on the results of the Feeling Nature survey. To quantify BS and BP, we introduced four biophilic metrics derived from visual AI applications. We utilised a state-of-the-art semantic segmentation model39 (DPT) known for its high performance in image recognition. For the convolutional neural network specific to the three-step image processing (classification, detection, segmentation), we employed a DPT model pre-trained on the ADE20K dataset42. This model categorises each pixel of an image into one of 150 semantic classes, including both anthropic and natural objects. From this extensive list, we identified 25 BC representing natural elements and bio-based features. These 25 BC, illustrated in Supplementary Fig. 4, were further grouped into four biophilic categories of the cityscape:
-
Greenscape (7): tree, grass, plant/flora, fire, flower, palm tree, natural food;
-
Waterscape (7): water, sea, river, fountain, swimming pool, waterfall, lake;
-
Landscape (9): sky, earth/ground, mountain, field, rock/stone, sand, hill, light/sunlight, land/soil;
-
Living beings (2): person, animal/fauna.
In the initial phase of our quantitative analysis, we applied DPT to process complete sets of GSV images for each case study, estimating the overall level of biophilia through BS. To achieve this, we assigned equal weights to the 25 BC within the DPT model. We evaluated BS using the following three metrics:
-
Coverage represents the fraction of pixels belonging to BC in relation to the total number of pixels in an image. It can be expressed as
$${rm{COV}}=frac{{{rm{px}}}_{{{{bc}}}}}{,{{rm{px}}}_{{{{tot}}}},}$$(1)where ({{{rm{px}}}}_{{{rm{bc}}}}) denotes the total of pixels of 25 BC, and ({{rm{px}}}_{{{rm{tot}}}}) corresponds to the total pixels in an image.
For a given BC (i), ({{rm{COV}}}_{i}) indicates the fraction of pixels belonging to that class in relation to the total number of pixels in an image.
$${{rm{COV}}}_{i}=frac{{{rm{px}}}_{i}}{,{{rm{px}}}_{{{{tot}}}},}$$(2)where ({{{rm{px}}}}_{i}) stands for the pixels of BC (i), whilst ({{rm{px}}}_{{{{tot}}}}) expresses the total pixels in an image. The mean coverage of BC (i) across all samples in a city is denoted as ({overline{{rm{COV}}}}_{i}). Coverage ranges from 0 to 1, with values closer to 1 denoting a higher presence of BS in the city case (Fig. 2; Supplementary Table 3).
-
Diversity indicates the relative proportions of the 25 BC in a city, which intends to measure the relative prevalence of the classes in different cities. The fraction (({{F}}_{i})) of class (i) across all samples in a city is the ratio of the coverage of that class to total biophilic coverage in that city. This indicator can be calculated as
$${{F}}_{i}=frac{{overline{{rm{COV}}}}_{i}}{overline{{rm{COV}}},}$$(3)Here, ({overline{{rm{COV}}}}_{i}) represents the mean coverage of BC (i), and (overline{{rm{COV}}}) is the mean coverage of all BC in the city. Diversity is expressed as a percentage (Fig. 3; Supplementary Table 3).
-
Distribution describes the spatial distribution of the coverage of all BC across a city, which can be represented in a map (see Fig. 4).
The values obtained for the BS metrics were normalised using min–max scaling, which ensures that each value falls within the specific range of 0–1, corresponding to the metric scale. This process involved subtracting the minimum value from each value in the dataset and then dividing by the difference between the maximum and minimum values. Only the normalised values are visualised in Figs. 2–4. However, both normalised and non-normalised biophilic metric values for each city can be found in Supplementary Table 3.
Quantifying biophilic perceptions
In the second stage of our quantitative analysis, we computed BP by applying DPT to a dataset containing only the selected images from the Feeling Nature survey. Treating the modelling results as BP data, we determined which visual elements of the cityscape, represented by the corresponding BC, elicited more positive feelings among the survey respondents. Thus, we introduced a fourth biophilic metric as a measure of perceived biophilic significance:
– Intensity for BC (i) indicates the fraction of all positively rated survey images in a city containing that class. It is defined as follows:
where ({N}_{i}) denotes the number of positively rated survey images with BC (i), and ({N}_{{{rm{tot}}}}) stands for the total number of positively rated survey images. The range of intensity spans from 0 to 1 (Fig. 2; Supplementary Table 3).
To test our hypothesis on the universality of BP, we used the computed intensity values associated with each BC as weights to adjust the DPT results based on the survey perception data. Subsequently, we derived refined values for perceived coverage, perceived diversity, and perceived distribution by scaling them with the intensity coefficient to quantify and spatially delineate BP across each city case, as follows:
-
Perceived coverage represents the ratio between the weighted sum by the intensity of pixels belonging to BC and the total number of pixels in an image. It can be expressed as
$${rm{PCOV}}=frac{{sum }_{i=1}^{n}{{rm{px}}}_{i}{{rm{INT}}}_{i}}{,{{rm{px}}}_{{{rm{tot}}}},}$$(5)where ({{rm{px}}}_{i}) denotes the pixels of BC (i), and ({{rm{INT}}}_{i}) corresponds to the intensity of BC (i) (4). Ranging from 0 to 1, perceived coverage values closer to 1 indicate a stronger perception of biophilia associated with a particular site in the city (Fig. 2; Supplementary Table 3).
-
Perceived diversity indicates the weighted proportions of the 25 BC in a city intended to measure the relative prevalence among the classes perceived more positively in each city and expressed by the fraction (({{rm{PF}}}_{i})). Thus, perceived diversity results from:
$${{rm{PF}}}_{i}=frac{{overline{{rm{PCOV}}}}_{i}}{,overline{{rm{PCOV}}},}$$(6)Here, ({overline{{rm{PCOV}}}}_{i}) denotes the mean perceived coverage of BC (i), and (overline{{rm{PCOV}}}) indicates the mean perceived coverage of all BC in the city. Perceived diversity is represented as percentage values (Fig. 3; Supplementary Table 3).
-
Perceived distribution illustrates the spatial distribution of perceived coverage across each city case and is depicted through the corresponding BP maps (Fig. 4).
Even the values of BP metrics underwent normalisation through min–max scaling to calibrate them within the range of 0 and 1, as established by the metric rate. The related normalised values are displayed in Figs. 2–4, whilst the complete dataset is presented in Supplementary Table 3.
In addition to conducting visual AI modelling using DPT, we quantified BP through NLP applied to the received comments in the Feeling Nature survey. We utilised Bidirectional Encoder Representations from Transformers (BERT), a widely used pre-trained model for NLP. BERT identified morphological, semantic and syntactic similarities with the 25 BC, which were established as keyword entities to be recognised in the biophilic term classification process. After consolidating survey comments into a single document per city, BERT was implemented across seven tasks: (1) pre-processing: the initial text was divided into individual sentences, which underwent tokenisation, segmentation and positional embeddings to facilitate the sentence encoder; (2) feature extraction: semantic features were extracted using the 25 BC as keywords for specific inputs; (3) embeddings: sentences were converted into tensors through sentence embeddings, keyword embeddings and combined embeddings; (4) 25 BC’ keyword embeddings: embeddings for all 25 BC keywords were computed, with a threshold of 0.5 set to classify items with higher similarity values as biophilic only; (5) entity recognition: the closest embeddings (3–4) were identified for biophilic term classification; (6) similarity computation: embedding results were represented as numeric values through cosine similarity43 (measures the cosine of the angle between two vectors, providing a measure of similarity between them) ranging from 0 to 1, and visualised in bar graphs (Fig. 5a). Vectors that are semantically more similar have values closer to 1, whilst more opposite vectors are indicated by values tending towards 0 (Supplementary Table 4); (7) similarity matrices: the cosine similarity between all pairs of keyword embeddings was calculated to generate similarity matrices shown in the form of seaborn heatmaps, which depict the 25 BC’ keywords along both the x and y axes (Fig. 5b).
Qualifying biophilic perceptions
We conducted a qualitative analysis of the comment section in the Feeling Nature survey to explore how specific aspects of the urban environment positively influence human perceptions. We introduced a qualitative parameter termed specificity, which considers both biophilic elements associated with the 25 BC and non-biophilic elements identified through NLP techniques. The goal of non-biophilic term classification was to uncover additional nuances related to BC, thereby identifying features beyond the 25 BC that could favourably influence respondents’ perceptions of their cities. This approach provided valuable insights into the effects of urban imagery on citizens, even in familiar settings.
Building on previous quantitative analyses conducted through transformer models (DPT and BERT), we utilised the generative pre-trained transformer (GPT-3.5) by OpenAI44 to process textual survey data. Unlike BERT’s bidirectional transformer architecture, GPT-3.5 employs a unidirectional transformer architecture. Similar to BERT, it is a deep learning model trained for NLP using word embedding vectors. GPT-3.5 generates contextually meaningful texts through a stack of decoder layers and specific prompts. The analysis involved distributing document–topic–word combinations and clustering textual survey data into topics, with a special emphasis on non-biophilic subjects. The data set for each city underwent clustering into nature-based or non-nature-based topics and was sorted based on word frequency. We imposed a maximum of 10 clusters for each city and implemented fine-tuned instructions to sort clusters, avoid repetition, integrate abstract concepts and identify local features. The resulting clusters were labelled with semantically coherent terms, comprising a total of 14 sub-topic clusters. Although all 14 sub-topic clusters provide beneficial effects, only 4 fall under the nature-based topics and were associated with the biophilic categories (greenscape, landscape, waterscape, living beings). The other 10 topics fall under non-nature-based topics, including the built environment, mobility and infrastructure, human activity, neighbourhood and community, urban mood, positive feelings, aesthetics, abstract concepts, vitality and movement, and local features. The sub-topic clusters were then organised into four main topic clusters, encompassing nature-based environment, anthropogenic environment, feelings and concepts, and city identifier. Specificity was computed as percentage values and visualised in a chord diagram illustrating the interrelations between each city case and the 14 sub-topic clusters, arranged by descending BP rates (Fig. 6a; Supplementary Table 5).
Through the qualitative analysis, we further explored potential gender differences in BP based on survey comments. Focusing primarily on women and men due to the limited numbers in other gender categories, we filtered the survey outputs accordingly. We then repeated the GPT-3.5 topic cluster modelling for each gender-based document to estimate the qualities of the cityscape perceived more positively by male and female respondents. Finally, we synthesised the results considering the four main topic clusters (nature-based environment, anthropogenic environment, feelings and concepts, city identifier). The resulting values are displayed in a double-bar chart, with gender-based pair bars represented on the x-axis and specificity percentage on the y-axis (Fig. 6b; Supplementary Table 6).
Inclusion and ethics statement
This research, conducted on a global scale, utilised models that were appropriately cited throughout the study. Roles and responsibilities were agreed upon among collaborators before conducting the research. The Feeling Nature survey was collaboratively designed and approved by the ethical boards of MIT and TU Delft, with respective letters of approval from each institution. TU Delft and MIT are the main institutions supporting the implementation of this study.


Responses