Stakeholders’ perceptions of and willingness to pay for circular economy in the construction sector

Introduction
Today’s business-as-usual building construction promotes a culture of demolition, wherein building components and materials are no longer valued at end-of-life. Transitioning from a linear to a circular economy (CE) offers an opportunity to reduce the impact of the built environment and accelerate value creation1. The current linear economy, following a take-make-dispose model, has created an industrial ecosystem with consistent, significant resource loss, including excessive energy use, waste during production, and waste at the end of product life1. CE in the construction sector transcends the typical take-make-dispose model of the building that is the current industry norm1 in favor of a make-use-reuse approach.
The need to transition is evident in the volume of waste the construction sector generates; in 2018, the U.S. produced 600 million tons of construction and demolition waste (C&D waste), four times the amount generated in 1990 and primarily comprised of demolished building materials2. Around the same time, the European Union produced ~300 million tons, whereas China produced ~3,200 million tons of C&D waste in 2021, according to recent reports3,4. While 455 million tons of the U.S.-based C&D waste was diverted to its ‘next use’2 in 2020, there was no reliable data for the recovery and recycling of waste in the EU3. Existing waste diversion efforts speak to a nascent market for circularity.
As C&D waste continues to increase in different markets, so does the quantity of buildings required. Globally, 226 billion square meters of surface area is projected to be built in the next three decades, with the ratio between new built area and existing building area greatest in Asia, Africa, and other emerging economies5. At the same time, the European Commission aims to cut greenhouse gas emissions by 55% by 2030 and achieve carbon neutrality by 20506. As the twin imperatives of new buildings and reduced emissions become more urgent, there is a need to rapidly implement sustainable and resilient solutions. All actors (used interchangeably with stakeholders in this paper) along the construction value chain are involved, and one strategy is embracing a CE in the built environment7.
In general, circular adoption implies designing out waste, keeping products and materials in use, and regenerating natural systems in industrial ecosystems8. There are many opportunities for CE in the built environment, including new tenanting models, nature-based solutions, and approaches to material and product use8; the last of which this research primarily addresses. In this paper, ‘circular practices’ refers to any strategy that substitutes waste streams with reducing, reusing, or recycling materials in buildings9. Adopting circular practices has the potential to reduce embodied carbon in the built environment10.
A plethora of policies are emerging to promote construction circularity efforts, such as the proposed policies in the EU Circular Economy Action Plan11, whole life cycle building analysis requirements in Singapore12, and tools such as the Carbon Leadership Forum’s Embodied Carbon Policy Toolkit13. There is also evidence of commercial interest in CE, as a number of technologies have come to market that facilitate circular construction methods across new build, renovation, and demolition practices, in addition to emerging digital platforms14,15. Additionally, several non-governmental organizations focused on green building certification incentivize circularity, including LEED and BREEAM Certification. This has economic implications, especially when considering how different sustainability scoring platforms value circular strategies. For example, new building projects meeting material reuse–a circular strategy– criteria for v4.1 LEED Certification are valued at 200% of their cost for the purposes of the credit achievement calculation; this means building projects with reuse are likely to score higher in their evaluation and more easily receive green certification16. Despite growing interest and increasing incentives and regulations, circular practices have yet to be implemented at scale.
In part, this is because of the scarce detailed comprehension of the actual market potential for circularity. Further, there are gaps in understanding the prevalence of current practices around waste materials and builders’ perceptions of circular building practices—including the costs, benefits, and associated risks (real and perceived) of these practices. Current research about the economic landscape associated with building circularity involves surveying barriers and drivers to circular economy17,18, circular project or product-specific19, anecdotal cost reporting, and high-level circular business model theory20,21. Nevertheless, additional work surrounding widely applicable quantification of willingness to pay and financial value for circularity and current perceptions is needed. The literature sorts barriers to circular economy into four categories: cultural barriers (lack of interest, obstinance of industry, lack of collaboration), regulatory barriers (lack of regulatory framework, lack of incentives), financial barriers (high upfront costs, poor business case examples, and limited funding), and sectoral barriers (confused incentives, lack of coherent vision and collaboration, and more)17. Industry-facing case studies have identified company profitability and effects on the supply chain as a key criterion for companies to implement circular practices22.
Cost premiums of circular practices, which refer to the increase in cost for implementation when compared to a baseline or business-as-usual option, have long been highlighted in the literature. An early 2005 comparison of deconstruction and project demolition of residential homes in Massachusetts demonstrated a 17–25% cost premium for deconstruction19. A more recent study analyzed four circular scenarios in a single residential home: utilizing recycled and biobased materials did not increase lifetime building costs; scenarios implementing disassembled building components had a higher initial purchasing cost that was counterbalanced by a decrease in end-of-life costs; the scenario employing the reuse of structural elements, however, raised the overall lifetime costs23. Macro-scale studies have identified economic benefits for recyclers and C&D waste generators, and end-users can benefit from circular products if recycled materials are used24. Additional literature has quantified retrofit-as-service models to encourage building circularity25. One study found the reuse of structural steel in the UK to be less expensive than new steel when refurbishment costs remained below raw material costs26, which demonstrates that the cost for implementing circular practices changes based on building case and technology. Circular business models and policy initiatives have the potential to enable value capture from circularity20 but have not been fully quantified. Theory reviews on circular value-creation and sustainable business models are often not sector-specific21 but have been applied to the built environment in some cases at a high level27.
This work attempts to quantify willingness-to-pay and perceived cost premiums at the level of the building sector to support the case for circularity in the building industry. In general, additional research is needed to understand whether different stakeholders in the construction sector are aware of circular practices in the industry, and which types of carrot or stick would induce the adoption of circular practices. This study assesses circularity practices across three stakeholder groups—developers, design and construction teams, and material suppliers—via an industry survey. This sectoral-level assessment attempts to help characterize the current economic landscape of circularity, and to enable policymakers and market makers to better regulate and incentivize the circular transition in the building sector. Specifics about the sampling methodology and survey dissemination can be found in the Methods section.
This paper attempts to characterize the economic landscape through an industry survey designed to: (1) Understand current perceptions of circularity and reuse. (2) Quantify willingness to pay for adoption of circular practices. (3) Identify economic incentives and regulations that could accelerate the adoption of future circular strategies.
Results and discussion
Respondent demographics
The survey gathered input from a diverse range of 58 participants across 3 building sector roles: Design & Construction, Real Estate, and Suppliers. The majority of respondents, 36 in total, have target markets in North America, while 12 more each focus on Europe and Asia. Because the survey prioritized the location of the building as opposed to the residence of the respondent, several respondents indicated multiple markets. It is possible the market presence of circularity could influence the result of the survey, considering the circularity policy discussed in the introduction, but this was not explicitly measured. The methodology section addresses potential limitations in the sampling method. Architecture and design firms were the most prevalent among the Design and Construction respondents, development was most common in the Real Estate category, and manufacturers were the most frequent among material suppliers. The specific distribution of respondents by domain, role of the firm, role in the firm, and geographic market is detailed in Table 1 below. The specific survey questions are described in the methodology section. The sampling method included targeting existing networks of stakeholders, a procedure further outlined in “Methods”, which also discusses the survey’s shortcomings and limitations.
Perceptions
The concept of circularity was already familiar to the majority of respondents, with 83% indicating that they had heard of it before participating in the survey. The remaining 17% were introduced to the concept through the survey. When asked if they had encountered inspiring examples of component reuse, responses ranged from those who had no personal experience to those who cited examples such as the material reuse of asphalt for road paving, recycled concrete for roadworks, and reuse of building materials at places such as Circle HQ in Amsterdam and Qatar’s Stadium 974. Some respondents also mentioned the recycling of steel reinforcements, window materials, and bricks from historic structures. Still other inspiring examples include the upcycling of decommissioned awning brackets for solar PV support structures, and various residential projects with a high degree of reused components.
The adoption of circular practices within respondent companies was relatively balanced, with 47.5% indicating they had already incorporated such practices, and 35% indicating they had not. The remaining 17.5% were unsure. These percentages are based on the overall sample size. Among the 84% familiar with circularity, 53% had implemented circular practices, 15% were unsure, and 32% had not. Conversely, of the 16% unfamiliar with the concept, 17% still implemented circular practices, 33% were unsure, and 50% had not. The reported circular practices include salvaging and reusing building materials, using post-consumer crushed concrete aggregate, designing circular industrial practices, and writing reports on reducing embodied carbon in real estate. This underscores the budding acceptance of circular economy principles in the building sector, albeit with varied approaches and some uncertainty.
Nevertheless, perceived impediments to the adoption of circular practices are significant. The respondents highlighted various obstacles, as presented in Fig. 1.

A Perceived barriers to the implementation of circular practices by stakeholder type; B perceived barriers to the implementation of circular practices stakeholder type by market type.
These challenges included higher costs (12.5%), a lack of standardized structural assessment methods (15.9%), and client disinterest (15.9%). Other factors such as uncertainty about supply (11.4%), lack of information about the process (11.4%), and more complex logistics (12.5%) were also regarded as significant obstacles. 3 respondents viewed longer construction time as a deterrent, while 2 respondents declared they were not interested in these practices. Figure 1 organizes these barriers by the respondent and market type, which yielded different trends. For example, Design and Construction firms identified lack of client interest and lack of standardized structural assessment methods as the largest deterrent, whereas for material suppliers, complex logistics and supply uncertainty are the biggest barriers. Real Estate was chiefly concerned with two things: structural assessment, and higher costs.
Respondents were asked to estimate what they perceived as cost and time premiums for circularity by percentage, which is broken down in Table 2. The average of all respondents believed there would be an average cost premium of 66.4% at a standard deviation of 54.23 for deconstruction compared to traditional demolition methods. Moreover, they forecast an average increase of 46.4% at a standard deviation of 49.20 in construction time, implying a substantial alteration to project timelines. The perceived cost premium for Material suppliers was 105.5% (range of 2–200%) premium, whereas the design and construction teams, along with real estate, understood the premium to be lower, at 54.9% (range of 0–135%) and 66.7% (range of 5–161%) respectively. The median values for perceived cost premiums provide a more balanced understanding of the results by reducing the impact of outliers. The median value is 101.5%, which reduces the skewness caused by extremely high values like 200%. Similarly, the median cost premium for design and construction is 50%, and for real estate, it is 40%, which better reflects the respondent’s middle ground. Material suppliers also believe the time premium to be around 98.8%, (range of 15–200%, median of 124%), with lower perceived premiums from both design and construction (43.0%, range of 0–135%, median of 27.5%) and real estate teams (31.7%, range of 2–81%, median of 25%).
Supply chain interventions
When asked about the biggest bottleneck and enabler for reuse in the value chain, responses varied significantly (Fig. 2). The design phase was considered the largest enabler across all actors and regions, whereas current demolition and landfill practices/waste diversion, were understood to be the largest bottlenecks in the current supply chain. Landfill and waste to landfill were also cited to be one of the largest enablers. This parallel indicates that supply chain bottlenecks and enablers are not mutually exclusive, and instead, bottlenecks can pose as enablers when efforts are focused on solving them.
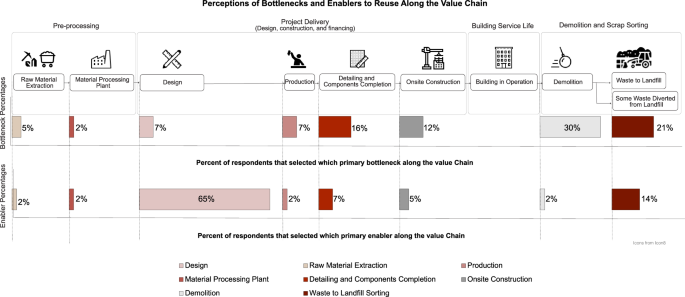
Perceptions of drivers and bottlenecks for reuse along the value chain.
Qualitatively, a common issue was how to integrate reused materials into new, high-quality buildings on the market. The importance of thorough sorting during the demolition phase and the design of buildings with disassembly in mind was also mentioned. The cost of demolition and reconstruction emerged as another concern. Despite these challenges, detailed component design to facilitate disassembly and reuse was still recognized as a significant opportunity.
Some respondents pointed to broader systemic issues hindering circularity: the current industrial and governmental ecosystem, and the status quo in design practices driven by cost minimization. To address these issues, suggestions included developing disruptive methods to transform the supply chain and fostering leadership to enable design and detailing for reuse. These insights underscore the multifaceted challenges and opportunities in pursuing circularity in the building sector and the necessity of systemic solutions.
Willingness to pay and future adoption
As depicted in Table 3, the respondents were willing to absorb higher costs to achieve circular construction outcomes. Willingness-to-pay depended on stakeholder groups, and respondents were asked about willingness-to-pay by percent cost premium as a normalized assessment metric. Percentage was used in order to avoid complications associated with the time value of money and differing regional currencies. Respondents were provided options ranging from 0% to 100% for their willingness-to-pay responses. For instance, in the case of material suppliers, a cost premium of 149% means that the suppliers are willing to pay up to 149% more than the cost of virgin materials to adopt circular practices. This percentage directly represents the premium they are willing to pay over the standard cost, simplifying the analysis by avoiding conversion complexities. On average, material suppliers were willing to pay a 54.2% premium to implement circular practices (49.27 standard deviations, median of 37.5%). The respondents in real estate expressed a readiness to bear an increase in construction costs by an average of 9.6% (6.45 standard deviation, median of 10%) if it can ensure a minimum of 52.9% (24.55 standard deviation, median of 50%) reduction in embodied carbon. This finding underscores the growing recognition among industry stakeholders of the urgent need to minimize carbon footprint in construction processes. Material Suppliers were ready to accept an average premium of 23.3% (23.08 standard deviation, median of 15%) for materials capable of reuse. Design teams indicated a willingness to allocate a mean of 23.7% (30.09 standard deviations, median of 10%) of project design profits towards implementing circular practices. The median value respondents indicated they were willing to pay was, across all stakeholders, significantly lower than their aforementioned perceived cost premium values.
The reasons that drove the respondents to consider adopting circular practices were varied. As per Fig. 3, 19% were influenced by regulatory demands, while an equal percentage was driven by client requirements. The aspiration for a net-zero future motivated 20.7% of respondents. Other factors included design team recommendations (13.8%), marketing or brand enhancement opportunities (10.3%), and government incentives (5.2%). When broken down by stakeholder groups, additional trends emerge. In design and construction teams, both client demand and future net zero goals were cited as motivations for current and future adoption. Real estate also cited future net zero goals, in addition to government regulations encouraging circularity. Material suppliers had the smallest sample size for this question, and therefore no clear trend emerged. Regionally, client demand and future net zero goals were most present in North America, Asia, and Europe, with government regulation the third most frequently named as a motivator everywhere.
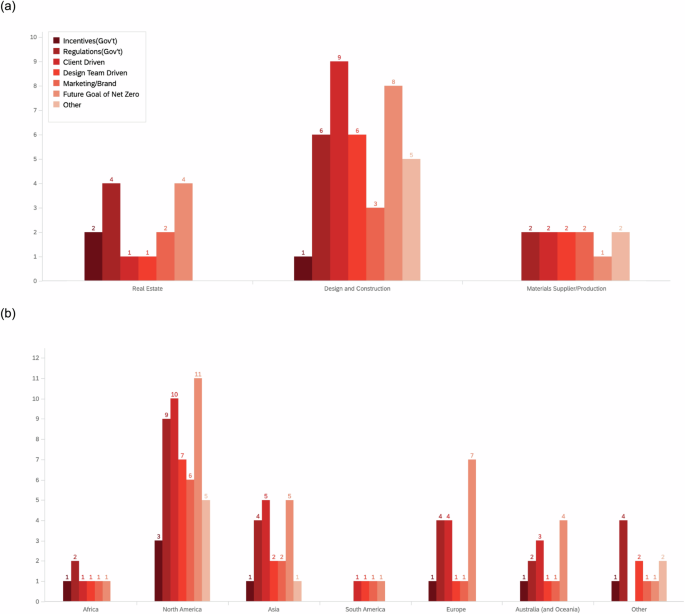
A Previous and future motivations for implementing circular practices by stakeholder type; B previous and future motivations for implementing circular practices by market type.
A significant majority of respondents are open to circular construction practices, even in the face of potential challenges. For those indicating lack of information and higher costs as a major barrier, 7 and 10 respondents, respectively, still would consider circular adoption. Respondents specifying complex logistics and supply uncertainty have similar results, with 11 and 9 respective respondents undeterred. When potential client disinterest was a concern, 11 remain willing to embrace circularity. However, 5 respondents who indicated other obstacles to adoption not captured in the survey express a desire for increased incentives. The prospect of a longer construction time doesn’t necessarily deter the three respondents who indicated this as a barrier: all are open to the idea. 5 26 respondents would consider the adoption of circular practices, and an additional 12 might be swayed with the right benefits, hinting at the potential for policies or incentives to bridge the gap. Conversely, only 1 respondent would adopt only if regulations demanded, with 1 respondent outright opposing. This data presents a promising landscape: a strong foundational interest in circular construction practices exists, and with appropriate incentives and policies, even broader adoption is achievable.
Key takeaways and limitations
The survey results provide insights into the state of circular practices in the construction industry.
Participants demonstrated a readiness to accept increased construction costs for significant reductions in embodied carbon. They also indicated a willingness to incorporate circular practices in their operations, even if it meant dealing with more complex logistics, higher costs, and longer construction times. Despite these encouraging signs, the survey results also highlighted several challenges. While a majority expressed interest in circular practices, the perceived high cost of deconstruction, increased construction time, and perceived risks of new practices present significant hurdles.
It’s noteworthy that the potential of incentives, such as tax exemptions and other benefits that cover the cost premiums of adopting reuse practices, were highly favored by participants. This could be crucial to increasing the adoption of circular practices in the industry.
While the survey provides meaningful insights, it is important to acknowledge its limitations. While a sample size of 58 partial responses and 42 majority responses can impact the generalizability of the findings, the survey was of similar scope to existing literature. A study surveying the implementation of circular economy business models by small and medium-sized enterprises (SMEs) in all sectors, including the building sector, had a sample size of 52 business cases21. Additional literature interviewed 13 and 30 stakeholders, respectively, about perceived barriers to reuse26,28. Another study examining the Built Environment Professionals’ willingness to pay for green buildings in Ghana had a sample size of 15329. That being said, larger, more diverse samples would provide a more accurate picture of the industry’s views on circular practices.
The survey largely captured qualitative data, which, while valuable, is harder to quantify and compare directly. A more nuanced combination of qualitative and quantitative questions might provide deeper, more actionable insights. Lastly, the survey focused on the willingness of companies to implement circular practices, but it did not extensively explore such other important areas as consumer demand for sustainable buildings, potential regulatory barriers, or the feasibility of training the existing workforce in new construction techniques.
These limitations indicate areas future research could cover. Namely, further exploration into the practical challenges and potential solutions for the wider adoption of circular practices in the construction industry. Still, this survey provides a sectoral overview of the state of circularity amongst actors and can be a stepping stone for the next phase of granular economic analysis and regulatory research.
Methods
The methodology for this study follows an iterative surveying process, beginning with exploratory interviews with industry experts, literature review and survey development, pilot survey dissemination, final survey dissemination, and data analysis and interpretation.
Survey development
Survey development began with a two-pronged approach of literature review and informal industry expert interviews. Initial interviews with 6 stakeholders asked three questions: do you have successful reference projects demonstrating circularity to share? Have you encountered any beneficial incentives or regulations that have facilitated circular building practices? What are the two most critical elements (when shown in the scheme of the construction supply chain in Fig. 4) to achieve a circular system? The results from the preliminary informal interviews drew three primary takeaways: inconsistent understanding of reuse practices and definitions of reuse and circularity, several elements along the supply chain acting as points of concern for the adoption of circular practices, and regulations acting as potentially a better facilitator of reuse.
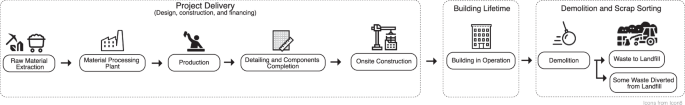
Building element supply chain throughout a building’s lifetime.
The informal interviews included developers, design and construction teams, and circularity experts. The lack of consistent sectoral definitions of circularity highlighted the need to write questions specific to three stakeholder groups: developers, design and construction teams, and material suppliers. The survey questions are therefore divided into two question groups, wherein the first group all stakeholders answered, and the second was specialized by actors. The survey had five sections: company characteristics, conceptual circular economy, supply chain, high-level, circularity incentives, and willingness-to-pay questions. Figure 5 details the survey questions.
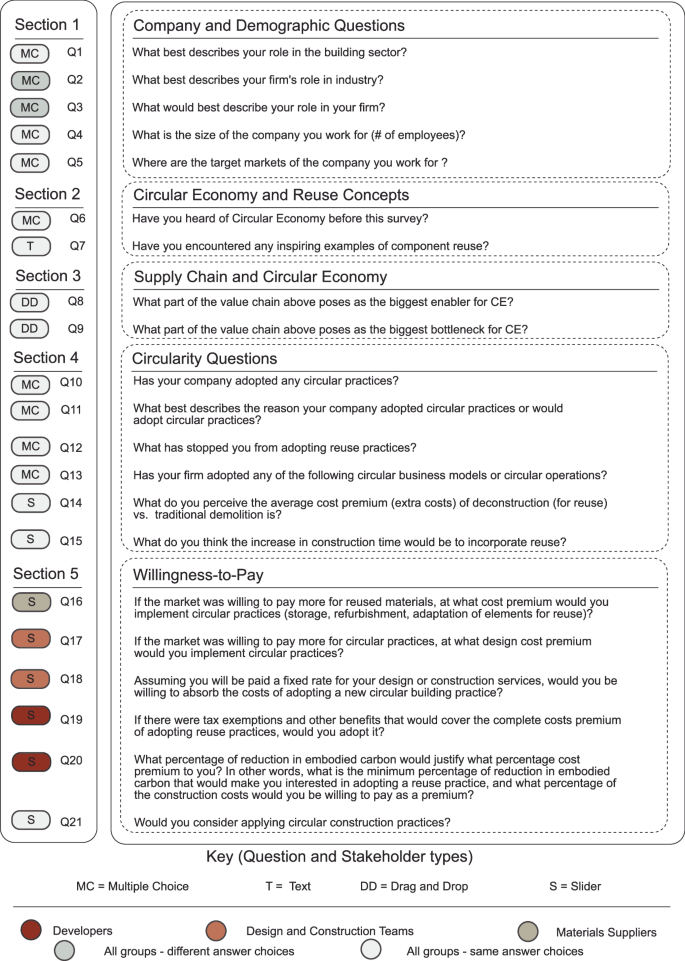
Divided into five sections, the question blocks cover: Section (1) Company and demographic questions; Section (2) Circular economy and reuse concepts; Section (3) Supple chain and circular economy; Section (4) Circularity; Section (5) Willingness-to-pay.
Survey distribution and sampling
Data was collected using a closed-ended questionnaire to inquire about the views of professionals in the real estate, manufacturing, and design sectors on the factors. Existing literature has utilized a closed-ended questionnaire method to evaluate willingness to pay for green buildings30.
The survey was initially sent to 10 professionals to receive feedback; 4 gave feedback, 5 neglected to respond, and 1 declined. After incorporating their feedback, the validity of the instrument was tested, piloting it with 5 professionals in real estate, manufacturing, and design. The instrument was revised and refined based on the pilot to ensure that the questions were clear and to ensure the collection of cohesive data. The final questionnaire was administered using Qualtrics Experience Manager. The link to the online survey was distributed to key industry practitioners.
The difficulty in obtaining the required sample size made the researchers resort to non-probability sampling techniques in selecting all the respondents for this study. Non-probability sampling techniques are useful and economical in order to obtain a representative sample31. The first technique used purposive sampling, by which a sample was quickly reached, thereby allowing the selection of individuals well-informed about the topic of interest. This technique enabled respondents with suitable knowledge and experience from the three organization categories (designers, real estate, and material suppliers) to participate in the study. Through referrals (i.e., snowball sampling technique) from these initially consulted respondents, other respondents were reached.
The survey was distributed to various networks spanning several hundred people. It was opened by 95 people, partially completed by 58 people (at least 5% answered), and the majority completed by 42 people (over 50% answered). All of these 58 respondents consented to the use of their responses in this analysis. All answers from this group were considered valid for the respective questions they answered, and were used for the statistical analysis. This sample was deemed appropriate as the number falls within the ranges in other literature (as discussed above).
The survey distribution was targeted at existing networks, associations, organizations, and collaboratives composed of various stakeholders (referred to here as member bodies), in order to take advantage of existing communication infrastructure. The survey was distributed to between one and three member bodies per stakeholder group, which constitutes a nexus of several hundred stakeholders. Because each member body was responsible for dissemination, the sample size of people who had access to the survey is unknown. The member bodies for each stakeholder group were also supplemented with professional contacts from the author’s individual network, in addition to industry partners of the MIT Center for Real Estate and the MIT Climate and Sustainability Consortium, which amounted to over 65 stakeholders. Of the whole sampling group, 58 completed at least one question of the survey, and 42 completed the majority of the survey.
Reliability and consistency
Before analyzing the collected quantitative data, the reliability and consistency of the survey questionnaire were evaluated using Cronbach’s alpha coefficient (CAC). This analysis enabled the critical factors and scale used to be checked for consistency. Some literature deem that reliability should be considered high when Cronbach’s alpha is equal to or greater than 0.7 before utilizing a survey instrument32. Cronbach’s alpha coefficient (α) is depicted in Eq. (1), Where, N is number of items, c̅ is mean covariance between items and v̅ is mean item variance.
To check CAC score, two common questions (Q14 and Q15 in Fig. 5) between all the three were used to check the reliability of all with 33 respondents answering both questions. Both questions were considered answered if there was a numerical value as a response (blank answers were not considered). For this question set, a CAC value of 0.877 was obtained, indicating that the total collected data had an acceptable internal consistency and reliability.
Since there were over 30 partial responses from designers, CAC was calculated to check the validity of their survey results. All four quantitative questions for designers were used to check the reliability: Q14, Q15, Q17, Q18 in Fig. 5. 14 respondents answered all four questions, and these responses were used to produce a CAC value.
For the designer specific study, a value of 0.812 was obtained for designers who answered all four questions, indicating that the collected data had acceptable internal consistency and reliability.
For real estate and material suppliers, the number of respondents was not enough to calculate CAC value. With that in mind, additional sampling is needed to ensure the consistency of responses from the material suppliers and real estate.
Responses