Multi-sectoral efforts are required for decarbonising the building sector: a case in Hong Kong

Introduction
The building sector is responsible for a significant portion of anthropogenic activities, leading to substantial carbon emissions. In 2021, the building sector contributed to 39% of global carbon emissions1. The numerous emissions from the building sector have considerably impacted global climate change. Consequently, deep decarbonisation of the building sector is urgently needed to deal with the 1.5 °C targets issued by the Paris Agreement and the carbon neutrality visions of countries and regions. Many international organizations have issued policy documents to put forward decarbonisation roadmaps for the building sector around the world2,3,4.
Joint efforts of multiple contributing sectors are critical to decarbonise the building sector, as it is a typical end-use sector that consumes numerous fuels and materials5,6. Carbon emissions from the building sector depend on the performances of not only the sector itself but also other sectors. For example, electricity is the primary fuel for building operation7, and thus the emission performance of the electricity sector significantly affects energy consumption-related carbon emissions of the building sector. Another example lies in the building material consumption. Reinforced concrete and brick-and-concrete structures are predominant in modern buildings, consuming large amounts of emission-intensive building materials such as steel and cement8,9. Therefore, cleaner production levels in the manufacturing sector are critical for reducing embodied carbon emissions in building construction. In this situation, it is necessary to identify the influential mechanisms between the building and other contributing sectors, such as manufacturing, transportation, and electricity sectors, to analyse the comprehensive decarbonisation roadmaps of the building sector. This mechanism is the basis for quantifying the carbon mitigation effects of the relating measures and developing the decarbonisation strategy for the building sector.
Many previous studies have investigated the decarbonisation strategies for the building sector. They mostly adopted top-down regression models to predict the socio-economic factors’ mitigation effects on the building sector. For example, Dong et al.10 combined the machine learning regression approach and the stochastic impacts by regression on population, affluence, and technology model to forecast the carbon footprint of Hong Kong’s building sector. Their results showed that electricity consumption efficiency and clean power measures contribute to decarbonisation. Linton et al.11 compared the technical pathways in the existing and new buildings in eight cities in Canada, the US, and North Europe to qualitatively analyse the deep decarbonisation roadmaps for their building sector. Huo et al.12 built a system dynamics model to divide the building sector into population, building, end-use energy, and carbon emission subsystems. The model was adopted to forecast the carbon emissions of the building sector in Chongqing, China, under different energy efficiency and emission intensity levels. Similar methodologies have been adopted to examine the emission stages of the building sector, such as material consumption13,14,15,16, energy consumption17,18, and waste recovery19.
These previous studies have identified critical driving factors for the decarbonisation of the building sector. However, they have generally failed to provide comprehensive decarbonisation strategies that incorporate relevant contributing sectors. That is because they have focused on the measures applied to the building sector and predicted key parameters of other contributing sectors based on simplified assumptions. In fact, the mitigation measures in other sectors may substantially contribute to the long-term decarbonisation of the building sector. Therefore, a detailed analysis of multi-sectoral efforts, including a full list of relevant measures and their mitigation effects, is necessary. However, since most previous studies have considered the measures from other sectors as exogenous factors, their results might suffer subjective biases and thus not support the decarbonisation of the building sector accurately.
The process-based life cycle assessment (LCA) method provides a solution to this problem abovementioned. As this method traces the impacts of a system’s “cradle-to-grave” stages, it calculates carbon emissions from the building sector’s operational and embodied stages20. Consequently, the combined decarbonisation strategy can be placed under a unified framework, with the mitigation effects from all stages and related contributing sectors clarified. Many previous studies have utilised the LCA method to account for the carbon mitigation potentials of the buildings21,22,23,24,25,26. These studies have divided the building systems into several stages and identified the measures’ effects on each stage, but still had flaws in two expects. First, most studies have only considered the measures within individual sectors, not covering the carbon emission mitigation of buildings throughout the life cycle stages. For example, some studies have analysed the mitigation effects from the improvement of individual types of materials or appliances, such as steel or heat pump systems. In fact, buildings usually involve several types of materials and energy end-uses, which should be covered in the comprehensive decarbonisation strategy. Second, the influential mechanisms how the multi-sectoral mitigation measures contribute to decarbonising the building sector are not clearly identified. The building sector has several stages, involving its construction, operation, and demolition activities. Carbon mitigation measures applying to the multiple contributing sectors have various impacts on different stages of the buildings, with their mitigation effects interacted by other measures. Thus, the interconnections within the life cycle stages of the building sector, the contributing sectors, and the related mitigation measures should be investigated and clarified.
To address the knowledge gaps in the existing literature, we propose a novel “stage-sector-measure” analysis framework, which is based on the process-based LCA and bottom-up modelling theories, and develop a combined multi-sectoral decarbonisation roadmap for the building sector. This framework clarifies the carbon mitigation mechanism of the building sector by linking its life cycle stages to the contributing sectors and measures and thus supports the accurate identification of a comprehensive measure list and the quantification of the mitigation potential for the building sector. Totally, 23 items of measures in six categories from four contributing sectors are identified. Meanwhile, a two-phase calculation method is developed to quantify the mitigation effects of the measures. In addition, we employ sensitivity analysis to assess the effects of key parameters’ fluctuation on the carbon mitigation results. Using the proposed framework, we examine Hong Kong Special Administrative Region of China, a typical high-rise and high-density city, as a case study to quantitatively evaluate the mitigation effects of its building sector during the period of 2020–2050. Through the improvements in the carbon mitigation modelling methodology for the building sector, we aim to provide policy suggestions for decarbonising Hong Kong’s building sector and inform similar efforts in other regions.
Results
A novel framework for analysing the decarbonisation effects of the building sector
As a typical end-use sector, the building sector is decarbonised through the combination of efforts from multiple contributing sectors. To develop a comprehensive decarbonisation roadmap, it is essential to recognise the mechanisms by which activities across multiple sectors affect the life cycle stages of the building sector and to identify a list of key measures that apply to these sectors and change these mechanisms. Accordingly, a three-dimensional framework, called “stage-sector-measure”, is developed based on the process-based LCA and bottom-up modelling methods (see Fig. 1). The process-based LCA is used to divide the whole building sector into several stages and examine the carbon emissions in each stage20,27. Meanwhile, the bottom-up modelling approach systematically identifies the changes in carbon emission performance of each stage into several key factors and relates them to the contributing sectors and measures.

The first column is the six life cycle stages of the building sector. The second column is the four contributing sectors and the third column is the types and items of the measures. The connection lines show the linkages between the elements in different columns.
The ‘stage’ dimension reflects the life cycle boundary of the building sector, covering all building-related activities28. Based on the process-based LCA methods, six stages, i.e., material production (stage 1), material transportation (stage 2), construction (stage 3), operation (stage 4), demolition (stage 5), and waste transportation and disposal (stage 6), are identified. New buildings involve material production, material transportation, and construction stages; the building stock refers to the operation stage; and demolished buildings encompass the demolition and waste transportation stages (See details in Supplementary Note 1).
The ‘sector’ dimension comprises the contributing sectors that affect the carbon emission performance of the life cycle stages of the building sector. The emission performance of each stage is influenced by one or more factors that are related to both the building sector and other sectors. For example, the carbon emission performance of the material production stage is influenced by two factors, i.e., the emission factors of materials and the quantity of materials used in building construction. The former factor is related to the manufacturing sector that produces the materials, while the latter is related to the scale and construction methods of the building sector. Therefore, both the manufacturing and the building sectors affect the carbon emissions of the material production stage. In total, four contributing sectors – manufacturing, transportation, building, and electricity sectors – and their influencing mechanisms on the six building stages are identified (see the details of key factors and related contributing sectors in Supplementary Table 1).
The ‘measure’ dimension covers the measures that apply to the contributing sectors. The measures are identified as they can contribute to decarbonising the six building stages through altering the factors related to the four contributing sectors. Still using the above factors as an example, the measure of cleaner production of building materials can reduce the carbon emission factors of materials by improving energy and production efficiency during their production, while the measure of construction mode innovation can decrease the quantity of materials used in building construction by reducing the waste rate of materials. Thus, these two measures are linked to the manufacturing and building sectors, respectively, as they can change the factors of these two sectors to achieve decarbonisation. In a nutshell, these measures can be divided into six types, namely, cleaner production of building materials, phase-out of diesel goods vehicles, construction method innovation, building energy efficiency, building electrification, and clean electricity. These six types in total cover 23 measures. (see the details of measures in Supplementary Table 2).
Prediction on the scale of Hong Kong’s building sector
This study considers Hong Kong, a typical high-rise and high-density city, as a case study. The building sector undertakes the majority of residential, commercial and industrial activities in Hong Kong, which is the primary contributor to the city’s carbon emissions. Therefore, decarbonising the building sector is critical for achieving the carbon neutrality target in Hong Kong. To quantify the carbon mitigation effects in Hong Kong’s building sector, we predict the scale of Hong Kong’s building sector in the future. The time boundary is set as the period of 2020–2050, during which a deep transition towards carbon neutrality is expected to experience in Hong Kong29.
By combining the per capita floor area prediction method and development plans in Hong Kong (See details in Supplementary Note 2), this study predicts the floor areas of residential, commercial, and industrial buildings in the city, as shown in Fig. 2. In general, the floor areas of building stocks are expected to continually rise during the period from 2020 to 2050. The residential buildings will experience rapid expansion to meet the growing per capita floor area of accommodation demand, with floor areas rising from 109.8 million m2 in 2020 to 176.3 million m2 in 2050. Meanwhile, the floor areas of commercial and industrial building are estimated to rise more slowly, from 48.5 million m2 to 53.0 million m2 and 23.0 million m2 to 25.1 million m2, respectively. The floor areas of demolished buildings will also present similar trends to those of building stocks. From 2020 to 2050, the floor areas of demolished residential, commercial, and industrial buildings climbed from 26.0 to 56.7 hm2, 19.4 to 21.2 hm2, and 9.2 to 10.0 hm2, respectively. In contrast, the floor areas of all new buildings are anticipated to decline over time. That is because the population growth in Hong Kong is predicted to slow down over the next 30 years, reducing the demand for increasing building stock. In addition, the construction of public residential housing flats, including public rental housing and subsidised housing, is expected to slow down in a few years30, leading to a sharp decrease in the floor area of new residential building.
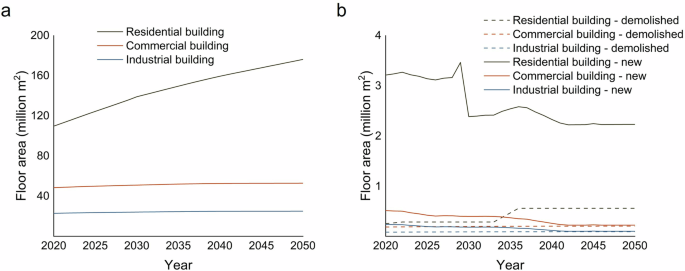
a The status and predicted gross floor areas of building stocks, b new and demolished buildings in Hong Kong.
The predicted carbon emissions of Hong Kong’s building sector
This study develops two approaches to estimate the carbon emissions of Hong Kong’s building sector. One approach is a two-step calculation method: the first step establishes the influential mechanism between the contributing sectors to the carbon emissions of the life cycle stages of the building sector, and the second step quantifies the effects of the mitigation measures on those contributing sectors. By that means, the compound carbon mitigation effects of each measure can be clarified. The other approach is the prediction method on the measures, which forecasts the application of the six types of measures during the period from 2020 to 2050 (see details in ‘Methods’ Section).
Based on the proposed methods, the carbon emissions of Hong Kong’s building sector without and with mitigation measures taken are calculated and presented in Fig. 3a. In general, carbon emissions without measures taken, i.e., under business-as-usual scenarios, are expected to experience continuous and moderate growth, from 27.0 Mt in 2020 to 32.2 Mt in 2050. By contrast, emissions with measures taken, i.e., under the decarbonisation scenario, exhibit significant mitigation effects, reaching only 4.2 Mt in 2050.
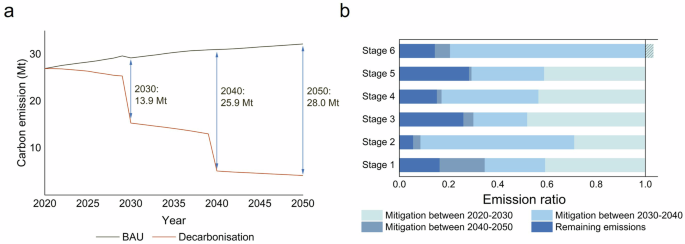
a The overall carbon emissions of the sector, and b the comparative carbon emissions by life cycle stage and by period.
Considering different periods, substantial mitigation effects can be found during the periods of 2020–2030 (13.9 Mt) and 2030–2040 (12.0 Mt), followed by narrower effects during the last ten years between 2040 and 2050 (2.1 Mt). In addition, two sharp decreases in carbon emissions can be expected in the years of 2030 and 2040, when CCS technology will come into use, with numerous electricity consumption-related carbon mitigation effects. CCS technology, installed in the electricity generation facilities, can capture and mitigate 90–95% of generated carbon dioxide31,32. Therefore, its application in Hong Kong’s electricity sector, expected to complete in two steps by 2030 and 2040, will lead to considerable carbon mitigation effects. This result reveals that deep decarbonisation is achievable in Hong Kong’s building sector through multi-sectoral efforts. Hong Kong’s building sector is therefore considered to be capable of achieving the carbon neutrality target on time by 2050, as some carbon offset measures, such as rooftop planting and photovoltaics, can offset the remaining emissions.
Furthermore, this study breaks down the carbon emissions of Hong Kong’s building sector by stage and decade (Fig. 3b). In 2050, the carbon emissions of the six stages are estimated to range from 5.6% (material transportation stage) to 28.4% (demolition stage) compared to the 2020 level. Carbon emissions in the material transportation stage and the waste transportation and disposal stage are expected to be mitigated mostly since the goods vehicles are expected not to generate any fuel combustion-related emissions. By contrast, 26.1% and 28.9% of the carbon emissions in the construction and demolition stages cannot be removed in 2050, primarily because the floor areas of new and demolition buildings keep high levels. In addition, the carbon mitigation effects in four stages (material production, construction, operation, and demolition) are found the largest during the period of 2020–2030 within the three decades. As the material production and operation stages have the largest contribution to carbon emissions, the period of 2020–2030 is critical for the decarbonisation of Hong Kong’s building sector (see the detailed carbon emissions of Hong Kong’s building sector by stage in Supplementary Figs. 2–3).
Carbon mitigation effects by contributing sector and measure
This study quantifies the mitigation effects of Hong Kong’s building sector by contributing sector, as presented in Fig. 4. In general, the electricity sector is expected to have the most significant contributions to the decarbonisation of Hong Kong’s building sector, with mitigation effects of 11.6 Mt, 20.6 Mt, and 20.1 Mt during the periods of 2020–2030, 2030–2040, and 2040–2050, respectively. That is because the electricity sector will undergo deep decarbonisation through alternative fuel mix and CCS. The electrification of the building and transport sectors will further amplify this clean electricity measure’s effects. Moreover, improvements in the building sector itself have the second-largest contributions, along with the continuous increase in building energy efficiency over these 30 years. In contrast, the mitigation effects in the transportation sector are negative before 2040. The reason is mainly that electric goods vehicles have higher carbon emission factors than traditional diesel ones before the deep decarbonisation of electricity generation. This result quantitatively reveals the interactions between the contributing sectors and measures and demonstrates the necessity of combining the multi-sectoral efforts to the comprehensively strategy.
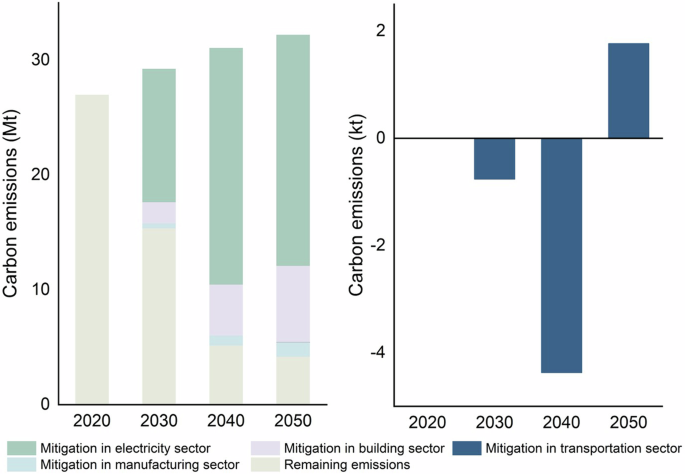
The sectors including the manufacturing, transportation, building, and electricity sectors.
Further, we consider the mitigation effects of the measures, which are summarised in Fig. 5a. In general, the clean electricity measures have the largest contribution, accounting for 71.8% of the carbon mitigation effects. In addition, considerable mitigation effects can be found in the measures of building energy efficiency and cleaner production of building materials, contributing to 20.6% and 4.5% of the effects, respectively. These results reaffirm the dominant role of electricity generation retrofits in decarbonising Hong Kong’s building sector from the life cycle perspective.
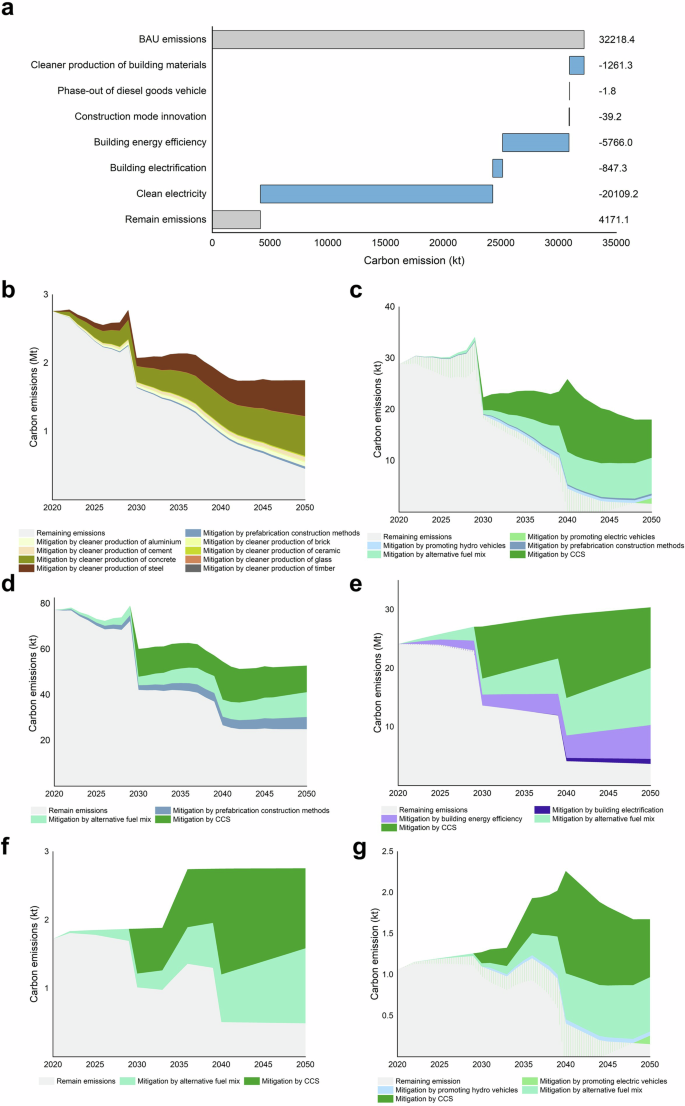
a The overall mitigation effects of the whole sector and in the b material production, c material transportation, d construction, e operation, f demolition, and g waste transportation and disposal stages.
We divide the carbon mitigation effects of the measures into stages, as presented in Fig. 5b–g. The cleaner production of concrete and steel measures have the largest mitigation effects in the material production stage by 32.9% and 30.0%, respectively. This measure, accompanied with decreased material demand for new building construction (see details in Supplementary Fig. 4), can achieve deep mitigation in material consumption-related embodied carbon emissions. Moreover, the alternative fuel mix and CCS are most crucial for the decarbonisation in the other stages, which can together achieve 80.1%, 42.7%, 66.0%, 82.2%, and 81.7% of carbon mitigations in material transportation, construction, operation, demolition, and waste transportation and disposal stages. In contrast, it is estimated that none of the measures related to the building sectors (i.e., the construction mode innovation, building energy efficiency, and building electrification measures) contributes mostly to carbon mitigation at any stage. This result reveals the significance of integrating other sectors’ efforts to the carbon mitigation of the building sector.
Specifically, building energy efficiency measures have tremendous contributions to mitigating carbon emissions in the operation stage of the building sector. Figure 6 presents the carbon mitigation effects of building energy efficiency by energy end-use. The energy efficiency of air conditioning is expected to mitigate 2.66 Mt of carbon emissions, accounting for 46.1% of this measure. This ratio exceeds the energy consumption ratios of this end-use in the three types of buildings (25–34%). Other end-uses contribute evenly, from 0.16 Mt (laundry) to 0.70 Mt (others). Thus, air conditioning is identified as a crucial part to mitigating energy consumption-related carbon emissions in building operations.
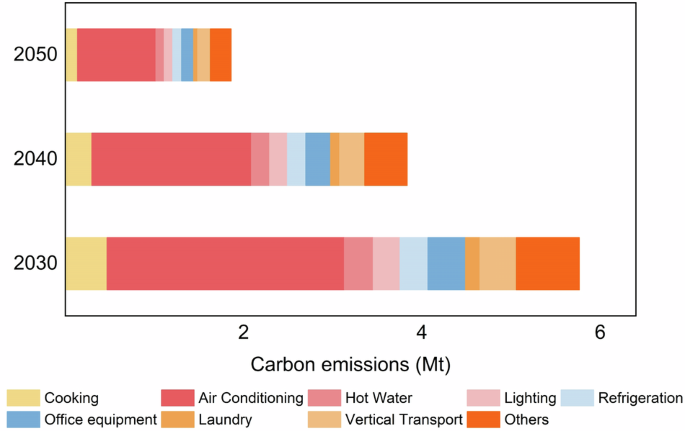
Carbon mitigation effects of building energy efficiency measured by end-uses in 2030, 2040, and 2050.
Exceptions exist as some electrification measures, i.e., building electrification and promoting electric vehicles, have net negative mitigation effects in most of the periods (These negative mitigation effects are filled in with vertical lines on the areas of “remaining emissions”, as they are equivalent to increasing the total emissions). That is because the current emission factor of electricity generation in Hong Kong is quite high, and thus substituting electricity for other fuels may instead increase the emissions. However, these measures still have positive effects in the long term as they can enhance the consumption ratio of electricity. Along with the decarbonisation of electricity, the increased consumption of electricity can achieve more significant mitigation effects. This result also reveals the existence of interactions between different measures.
Sensitivity analysis of the key influential factors to carbon mitigation results
We adopt the elasticity coefficient indicator to measure the sensitivity of the key parameters that may affect the carbon mitigation results (See details in ‘Methods’ section). The results of nine types of parameters are summarised in Table 1. In general, the values of the elasticity coefficients have substantial differences by four orders of magnitude. The carbon removal rate by CCS parameter is identified to be the most sensitive one, the change of which by 1% can lead to the change of remaining emissions by 2.76%. Moreover, the parameters of floor areas of buildings stocks and the emission factors of electricity generation by various fuels are also identified as sensitive to the emissions. These parameters may significantly influence the effectiveness of the decarbonisation roadmap, and thus the roadmap should be modified if these parameters deviate from the theoretical values.
Discussion
The building sector is a typical consumption sector, and thus many relating sectors play essential roles in its decarbonisation, which should be given significant attention by policymakers. We develop a “stage-sector-measure” analysis framework to evaluate the carbon mitigation effects of four contributing sectors and 23 mitigation measures in six types. Our results reveal that multi-sectoral efforts can achieve deep decarbonisation in Hong Kong’s building sector, with 85% of carbon emissions mitigated during the period of 2020–2050. This ratio differs from the results of other studies focusing on Hong Kong (70.1%)10, Beijing (93.8%)33, and Changsha (47.9%)16 due to the different stages of urbanisation in these cities and the parameter settings for other sectors (e.g. the carbon emission factor of electricity generation). Despite these differences, they all revealed the considerable decarbonisation potential of the building sector at the city level. The electricity sector is found to have the largest contribution to decarbonising the building sectors’ carbon emissions from the life cycle perspective, accounting for over 70% of the mitigation effects. Also, the manufacturing sector plays significant roles in the decarbonisation of Hong Kong’s building sector, particularly in terms of its embodied carbon emissions. This finding is consistent with the findings in previous studies in Mainland China15, the US14, and Swizerland34, which indicate that reducing building material consumption-related carbon emissions is the key to embodied carbon mitigation in the building sector regardless of the region.
The core contribution of this study is to establish a comprehensive modelling and accounting framework for decarbonising the building sector from the life cycle perspective. Previous research considered the specific measures from individual or partially selected sectors, not covering the interconnections between the life cycle stages, contributing sectors, and related measures. Therefore, the results were insufficient for the development of decarbonisation pathways for the building sector since the mitigation effects of some measures are overlooked or relied on exogenous predictions. The proposed framework overcomes this problem by facilitating the study of the measures more comprehensively. Furthermore, this study clarifies the interactive mechanisms between the measures, contributing sectors, and different stages of the buildings. For example, the promotion of electric and hydrogen goods vehicles from the transportation sector is expected to have adverse mitigation effects, but they can contribute to the decarbonisation of the building sector in combination with clean electricity measures. Only full coverage of the measures from multiple sectors can characterise such interactions and thus further enhance the accuracy of the results. The framework can be replicated in other cities or regions as it proposes a general approach to simulate the system and quantify the carbon mitigation effects. While applying this framework, one should acquire the localised data, make proper assumptions about the promotion of measures, and apply the calculation approach to obtain effective results.
Several types of policies should be formed to support the decarbonisation of Hong Kong’s building sector. One type is of economic incentive policies such as issuing economic subsidies and establishing carbon trading market. According to the results, clean electricity measures have the largest mitigation effects on the emissions in Hong Kong’s building sector. However, the implementation of these measures suffers high economic costs. According to previous studies, the levelised costs of electricity from solar energy and offshore wind are about 1.70 and 1.48 HKD/kWh35,36, much higher than the specific cost of thermal power generation (0.58 HKD/kWh37). Meanwhile, the specific cost of CCS technology is estimated to be over 200 HKD/t CO238. To smooth their promotion, on the one hand, some economic subsidies can be issued to encourage the installation of these technologies. For example, the practice of setting higher feed-in tariffs for distributed renewables can be replicated for large-scale photovoltaic, offshore wind, and thermal power plants retrofitted with CCS39. On the other hand, the carbon trading market should be introduced to the electricity sector to provide economic benefits for carbon mitigations from clean electricity measures.
Another type of policy is of raising public awareness of the significance of net-zero buildings. The building energy efficiency measure has the second-largest mitigation effect among the measures. However, unlike the measures in the manufacturing, transportation, and electricity sectors, this measure involves the efforts of millions of households. Thus, public awareness plays an essential role in the implementation of building energy efficiency measures. Previous studies have revealed that public knowledge is a significant barrier to net-zero building policies40,41. To accelerate the implementation of this measure, strong campaigns are needed to encourage low-carbon behaviours, such as using energy-efficient appliances, avoiding waste, and reducing fossil fuel consumption. Moreover, social investigations should be conducted to clarify the relationship between public awareness and low-carbon behaviours, which supports formulating the appropriate encouragement approaches.
Some limitations exist in the present study. One is that the predictions on the mitigation measures’ application mostly rely on the policy requirements or reports without detailed mechanisms explained. For example, the building energy efficiencies of the nine end-uses are assumed to increase annually with certainty percentages. However, the energy efficiency in the operation stage depends on several factors, such as human behaviours, building design, and the energy efficiency rating of appliances. These factors should be considered to make predictions more precisely in future studies. Another is the lack of economic analysis. As cost and benefit performances are primary motivations for governmental and business decisions, the specific costs of the measures are dominant factors for their promotions. In this situation, future research should undertake a comprehensive cost-effective analysis of the mitigation measures to support differentiated promotion strategies. Finally, along with the rapid development of the socio-economic system, more sectors (e.g. service sector) and measures (e.g. Artificial Intelligence in building energy system management) may play more significant roles in decarbonising the building sector, which are not considered in this study. The system boundary should be expanded in future research.
Regardless of these limitations, this study provides novel insights into the evaluation of the long-term carbon mitigation effects in the building sector at the city level. The methodologies can raise the awareness that decarbonising the building sectors should integrate multi-sectoral effects. Furthermore, the findings should support the formulation and review of carbon neutrality targets and decarbonisation strategies for the building sector in Hong Kong and other cities.
Methods
Calculation approach of the carbon mitigation effects of the building sector
The carbon mitigation effects can be calculated by comparing the carbon emissions with and without taking the measures. A two-step calculation method is established to fulfil the calculation: The first step is to quantify the carbon mitigation effects on the building sector from the changes in key factors from multiple contributing sectors, and the second step is to quantify the measures’ effects on those changes. The first step puts forward the quantification method of the carbon mitigation effects on the six life cycle stages of the building sector. This method quantifies the changes in key factors in relevant contributing sectors. All stages are relevant to one or more sectors, and thus their carbon mitigation potentials are discussed respectively (See the full definition of all abbreviations in Table 2).
The building material production stage is relevant to the manufacturing and building sectors. On the one hand, the decreased emission factors for material production in the manufacturing sector directly mitigate the carbon emissions of this stage. On the other hand, the changes in material waste rate, depending on the construction methods of the building sector, would affect the demand for building materials and relating carbon emissions. In general, prefabricated construction methods have lower waste rates than traditional cast-in-situ method42,43. Therefore, the mitigation potentials of the building material production stage can be calculated by Eqs. (1–3):
The carbon emissions in the material transportation stage are relevant to the transportation, building, and electricity sectors. The shares of goods vehicles in the transportation sector determine the fuel mix of building material transportation. The total quantities of transported materials are influenced by the material waste rate, which depends on the construction methods. Meanwhile, as electricity is a type of fuel, the emission factor for electricity generation is also a driving factor for the carbon emissions in this stage. Thus, the mitigation potentials of this stage can be calculated through Eqs. (4–9):
The construction stage is relevant to the building and electricity sectors. The energy consumption in this stage depends on the construction mode, while the emission factor for electricity generation has effects on the electricity consumption-based emissions in this stage. The calculation in this stage can be fulfilled via Eqs. (10, 11):
The operation stage is relevant to the building and electricity sectors. Since this stage only has energy consumption-related emissions, the fuel mix of building operation and the emission factor for electricity generation are the two influential factors. The mitigation potentials of the operation stages can be calculated by Eqs. (12, 13):
The demolition stage is only relevant to the electricity sector. Diesel and electricity are required to motivate the demolition machines. Therefore, the carbon emissions in this stage are affected by the emission factors for electricity generation. Having similar principle with the previous stages, the calculation of mitigation potentials is provided in Eq. (14):
Finally, the waste transportation and disposal stage is relevant to the transportation and electricity sectors, with the same principles as those in the material transportation stage. Moreover, since most building wastes are currently disposed by landfill, it is expected to have no carbon emissions. Therefore, the calculation method of this stage is given in Eqs. (15–19):
The second step identifies how the application of the measures changes these key factors in each contributing sector. As mentioned above, five types of key factors, i.e., the emission factor for building material production, the shares of goods vehicle, the fuel mix for building construction, the fuel mix for building operation, and the emission factor for electricity generation. These five factors are the performances of the manufacturing, transportation, building, building, and electricity sectors, respectively. Then, this study matches these factors to the measures to define the calculation methods for the changes of these factors.
Moreover, the carbon emission factors for material production are affected by the measures of cleaner production. These measures can reduce the carbon emission factors by many means, such as increasing energy consumption efficiency, waste energy and material recovery, and promoting advanced production equipment44. By referring to previous studies15, this studies consider the changes in emission factors for material production as the effects of cleaner production measure.
The factor of shares of goods vehicle is related to the phase-out of diesel goods vehicle measure. This measure eliminates the traditional goods vehicles and promotes clean energy vehicles, such as vehicles powered by electricity and hydrogen. This measure changes the shares of different vehicles and thus determines the fuel mix of goods transportation and the carbon emissions. In this situation, the carbon emissions in transporting materials and wastes by goods vehicles with different types of fuels are calculated by Eq. (20):
The factor of fuel mix for building construction is affected by construction method innovation measure. By promoting prefabricated construction methods, electricity and diesel consumption for new building construction can be conserved. Meanwhile, this measure can decrease material demand by changing the material waste ratios. The indicators of fuel consumption in building construction and material waste ratios can be calculated via Eqs. (21, 22):
Moreover, the fuel mix for the building operation factor reflects to the electricity, LPG, and coal consumption per square metre in the operation stage. The fuel consumption is affected by two measures, i.e., building energy efficiency and building electrification measures. The building energy efficiency measure reduces the energy consumption amount annually, while the building electrification measure increase the proportions of electricity consumption within the three types of fuels. The indicators of fuel consumption during the building operation stage are calculated via Eq. (23):
Finally, the clean electricity measure decreases the emission factors for electricity generation by alternative energy mix and CCS. The alternative energy mix can increase the proportions of cleaner energy in electricity generation, such as nuclear, wind, photovoltaic, and waste-to-energy. Moreover, CCS can be applied to thermal power facilities to mitigate the generated carbon emissions by capture and store them into geological sites. The emission factors of electricity are calculated by Eqs. (24, 25):
The prediction on the mitigation measures related to Hong Kong’s building sector
This section predicts the application of the six types of mitigation measures during the period of 2020–2050. The first type of measure is the cleaner production of materials. Many commonly used building materials are emission-intensive, and thus consuming these materials for building construction may lead to numerous carbon emissions. The material production stage is expected to contribute to over 80% of embodied carbon in the building sector45,46. Totally, eight types of materials, i.e., aluminium, brick, cement, ceramic, concrete, glass, steel, and timber, are selected as they account for over 95% of material consumption in new buildings47,48. Moreover, since most consumed building materials in Hong Kong are imported from Mainland China49, in where the cleaner production of the building materials industry significantly mitigate the building sector’s emission in Hong Kong. Therefore, the carbon emission factors of the eight materials under the cleaner production measures are predicted, as listed in Supplementary Table 3.
The second type of measure is the phase-out of goods vehicle. So far, most goods vehicles in Hong Kong are fuelled by diesel. According to the prediction by World Resource Institute50, all diesel goods vehicles will be phased out before 2040, with all light-goods and 50% of heavy-goods vehicles fuelled by electricity and the other 50% of heavy-goods vehicles fuelled with hydrogen. In addition, considering the maturity of these vehicles, the electric goods vehicles are assumed to begin to promote since 2020 and the hydrogen goods vehicles begin to promote since 2030. Based on these references, this study predicts that the shares of goods vehicles fuelled by electricity and hydrogen will reach to 60 and 40%, respectively, in 2050 (See the detailed changes in the ratio of different types of goods vehicles in Supplementary Table 4).
The third type of measure is construction mode innovation. Prefabrication is the typical innovative construction method that manufactures and assembles building components before installing them on the construction site. In addition to reducing labour inputs and enhancing construction efficiencies, prefabrication also brings environmental benefits in multiple stages. For example, the prefabrication mode has a standardised process to produce building components, thus decreasing the loss rates of building materials. Moreover, prefabricated buildings consume less diesel in the construction stage than traditional cast-in-situ buildings. Since there are no official statistics on the current prefabrication rate in Hong Kong’s urban buildings, this study refers to the field research by Lee et al.51 and sets the value as 20% in 2020. The prefabrication rate is expected to increase steadily until 70% in 2050 gradually.
The building energy efficiency measures mainly apply to the operation stage, which has the most substantial contribution to the carbon emissions of the building sector. In Hong Kong, the building sector accounted for 93% and over 70% of domestic electricity and liquefied petroleum gases (LPG) consumption in 2020. Thus, the energy efficiency measure can dramatically decrease energy consumption and related carbon emissions. The Hong Kong Government has counted the energy consumption of the nine energy end-uses in the three types of buildings in 2020, presented in Supplementary Fig. 152. Since the energy efficiency measures involve many equipment and appliances that are complex to simulate, this study considers the energy intensities of the nine end-use types, i.e., energy consumption amount per square metre of floor area, as the variables. The energy intensities will decrease under the application of energy-efficient appliances and digital electricity distribution systems. By referring to the predictions by Energy Innovation53, this study sets the energy efficiency improvement speeds as 0.4% per annum for cooking, hot water, lighting, and other end-uses; 0.8% per annum for refrigeration, office equipment, and laundry; 1% per annum for vertical transport; and 1.2% per annum for air conditioning. Therefore, the energy intensities of the end-uses (energy consumption of each end-use per m2 of square metre) of the three types of buildings can be predicted, presented in Supplementary Tables 5–7.
The building electrification measure involves the improvement of the fuel mix in the operation stage of the building sector. According to statistics52, 28.1%, 10.8%, and 7.0% of energy consumption in the residential, commercial, and industrial buildings in Hong Kong relied on fossil fuels, respectively. As electricity has lower carbon emissions than fossil fuels in the long term, more electricity should be consumed in the operation stage of buildings to achieve decarbonisation. In specific, coal is expected to be phased out of energy use in buildings before 2025, while the share of LPG in all types of buildings will gradually decrease. Therefore, this study predicts that the shares of electricity in residential, commercial, and industrial buildings will increase gradually to 85.4%, 92.8%, and 93.0% in 2050, respectively, while the rest of them are supplied by LPG (See the detailed fuel mix in building operation in Supplementary Table 8).
Finally, the clean electricity measures commit to reduce carbon emissions from electricity generation. Hong Kong’s electricity supply mainly comes from domestic thermal power stations (72%) and imports from the Mainland of China (28%). Since domestic power stations are fuelled by coal and natural gas, this part of electricity generation has led to significant carbon emissions. In 2020, the carbon emission factor of electricity generation in Hong Kong was 720 g CO2-eq/kWh37, much higher than that in the Mainland of China (610 g CO2-eq/kWh)54 and the US (417 g CO2-eq/kWh)55. Thus, the clean electricity measure is a crucial solution to decarbonising the building sector. For the alternative energy mix measure, coal-fired electricity is expected to be eliminated before 2030, while the shares of three types of clean energy sources, i.e., waste-to-energy, solar energy, and offshore wind power, will experience a slow growth to 10% in 205056. Moreover, more electricity is expected to be imported from Mainland China to Hong Kong, with shares from 28% in 2020 to 30% in 2030, 40% in 2040, and 50% in 2050, respectively. The detailed fuel mix of electricity generation in Hong Kong is presented in Supplementary Table 9.
The other is CCS for gas-fired power stations. CCS can capture the generated CO2 and store it in carbon sinks, such as oil fields and deep saline aquifers in basins, preventing it from being released into the atmosphere57. CCS is therefore regarded as a revolutionary solution to decarbonising the electricity generation industry. A previous study found that the northeast of the Pearl River Delta Basin, about 100 km from Hong Kong, is a promising site for carbon storage58. This finding demonstrates the feasibility of applying CCS to Hong Kong’s gas-fired power stations. As CCS technology is still immature, applying CCS in Hong Kong is currently challenging. Thus, this study predicts that half of the gas-fired power stations will be retrofitted with CCS in 2030 and the rest in 2040.
Data collection
Five types of data, i.e., material intensity, transportation distance, energy intensity, emission factor, and technical effect, are required to calculate the carbon mitigation effects in Hong Kong’s building sector. Material intensity data refer to the material consumption in constructing per floor area of new buildings. The transportation distance data means the average distance to transport raw materials or wastes. Energy intensity data includes the energy consumption parameters per unit activities, such as transporting one ton of goods in one kilometre and constructing per square metre of buildings. Emission factor data indicates the carbon emissions of fuel combustion or electricity generation. Finally, the technical effect data is the mitigation effects of the measure. The values and sources of the data are listed in Supplementary Tables 10–11.
Sensitivity analysis
Calculating the decarbonisation roadmap’s mitigation effects relies on a series of parameters obtained from multiple sources or predictions. However, as the development of the building sector system is difficult to forecast accurately in the long term, these parameters’ uncertainty may exist. Thus, sensitivity analysis is introduced to this study to test the robustness of the proposed roadmap and identify the key parameters that have great effects on the results59. This study adopts the elasticity coefficient indicator to measure the sensitivity of the key parameters to the carbon emission mitigation effects of the building sector. Nine types of key parameters, i.e., floor areas of the building stocks, floor areas of the new buildings, floor areas of the demolished buildings, material intensities of new buildings, transportation distances, energy intensities of goods vehicles, energy intensities of building construction and demolition, emission factors of electricity generation by fuel, and carbon removal rate by CCS, are selected for sensitivity analysis (see detailed description in Supplementary Table 12). The elasticity coefficient is the ratio between the rate of change of the input and that of the output. The higher value of the elastic coefficient indicates that the fluctuation of the parameters has a more significant effect on the results. The calculation method of this indicator is presented in Eq. (26):

Responses