More urbanization, more polarization: evidence from two decades of urban expansion in China

Introduction
The turn of the century has witnessed rapid urban expansion in many developing countries1,2,3. One concern with this expansion is mega-metropolitan growth outpacing that of smaller cities4, particularly when these faster-growing regions already possesses initial advantages in terms of agglomeration economies5,6 or when national policies and state-led institutions favor uneven development7. Such uneven development, reflected in increasing distinctions in city size distribution8, is known as urban polarization9. Urban polarization may lead to socioeconomic disparities among cities and their hinterlands and, perhaps, social instability and discontent among the populations residing in smaller places10. These issues are pertinent to a broader effort to understand the challenges arising from hyper-urbanization and “left behind places”11,12,13.
The research community remains divided on the evidence of this polarization and, therefore, its consequences. Some researchers note that urban polarization has been more substantial in past decades14,15, while others indicate that the city size distribution has remained stable with time16,17,18. Exploring the city size distribution and revealing the phenomenon of urban polarization, if it exists, is significant, both conceptually and in practice, especially for urban planning and management19,20.
China has experienced one of the most rapid urbanization processes in the world21. Between 1978 and 2015, the number of cities increased more than threefold, from 193 to 65022, making China the most urbanized country in the world. An increasing number of these urban areas are mega-cities (i.e., cities with a population over 10 million). Their dramatic growth raises concerns regarding urban polarization—the distinction between larger and smaller cities—especially in terms of economic performance23. China has sought to reduce polarization through spatially targeted interventions9. Codified in its 2014 New Urbanization Plan24, China seeks, among numerous objectives, to marshal more rural migrants to cities, while improving interregional economic equality through efficient, coordinated, and sustainable urban agglomerations25. Meanwhile, urban agglomeration has been advanced as a strategic task of optimizing urban scale and structure26. Several studies have examined the consequences of these objectives through the lens of city size (i.e., population) distributions and the growth of urban agglomerations27,28; these researches commonly focused on one agglomeration or some set thereof, especially large agglomerations along coastal China29,30. There has, however, been limited comparative analysis of city-size development encompassing all urban agglomerations in China. Consequently, further research is necessary to comprehend China’s urban hierarchy and inform its development policies31.
City size distribution has a long history of exploration across research fields, leading to such generalities as the law of the primate city32,33, rank-size rule or the Pareto principle34,35,36, Zipf’s law37,38,39, and urban scaling or power laws40,41. Investigation into these dynamics is now being greatly enhanced by advances in high-resolution land use data42,43,44,45. If these concepts do not apply empirically to the city size distributions (e.g., a country), the assumption follows that local socioeconomic and political conditions have ‘perturbed’ the development process. China is a case, which deviates significantly from more widely observed patterns of regional development, such as confirming to the rank size rule46,47. Part of the explanation for this deviation may be the agglomeration strategies noted above. This observation leads to the basic question of our research: in the context of urban agglomeration policies in China, is there polarization occurring within and across the core agglomerations?
The measure applied in city size distributions historically is that of population, with implications that larger populations are associated with greater economic performance. This measure has many merits but various problems as well. For instance, the Chinese government measures the number of citizens by the household registration system (also called ‘hukou’ in China), which restricts the official changing of citizens’ permanent residence, and prevented those with rural registration from integrating into urban communities and gaining access to urban public services21. Population statistics of this nature underrepresent urban polarization, as they overlook temporary migrants and the intermittent movement of seasonal labor from rural areas towards larger cities48. It is also well noted that there is inherent uncertainty in measuring the population of urban entities (from city to metro-area and to agglomeration)49, their level of economic development50, and their physical size (i.e., area)4,51. The measurement of the physical infrastructure of the urban area – the facilities and installations comprising the city (e.g., roads, buildings, and homes) – provides an alternative means to study city size distributions and urban agglomerations, foremost its areal expansion and infill. As such, satellite remote sensing data of the terrestrial surface and nighttime light¸ combined with machine learning techniques, provide fine-grain spatial and temporal assessments of city-size infrastructure that are now increasingly being used to study city size distributions and urban agglomerations52,53,54. Indeed, studying city size distributions in this way has advantages beyond traditional population-based approaches51.
Adopting a physical or infrastructure size measure, we identify built-up area (BUA) in China from 1995 to 2018 using an efficient and low-cost algorithm to identify the size of urban areas. The algorithm utilizes nighttime light imagery as training data to conduct a pixel-based image classification of built-up area from Landsat imagery and has been applied to cities in China and elsewhere55,56. The results of the classification are used to examine city-size dynamics for 23 urban agglomerations in China. These agglomerations and the 168 cities within them are those identified by the Chinese government in the 11th Five-Year Plan of the People’s Republic of China for 2006-2010. The agglomerations, ranked by GDP and strongly linked to population and areal expanse, are arranged along three elongated clusters or spatial axes: coastal, northern inland, and southern inland. The results of our classification—the physical or infrastructural area of the agglomerations are used to address the city size distributions and polarization questions undergirding this research. The primacy index and the Pareto exponent are employed in this exploration, with special attention given to the three largest agglomerations. The Pareto distribution works well for China based on evidence from the first decade of this century46. The details of the remote sensing methods, agglomerations examined, and the measures employed in our assessment are provided in the Study Area, Methods, and Data section at the end of this study and in Supplementary Information.
Results
China’s built-up area
The total BUA for China was 51,238.66 km2 in 1995. This area increased in successive years, resulting in the area of 198,602.14 km2 for 2018, an astounding 287.60% increase in area compared to 1995 (Fig. 1, Table 1). These estimates rely on land-cover classifications with accuracy rates averaging over 90% (Table 1). For the 23 urban agglomerations examined in this study, the BUA increased from 33,622.42 km2 to 128,069.24 km2, increasing by 280.90% over the study period, accounting for about 65% of the total BUA of China. As phenomenal as these urban growth rates (i.e., infill and expansion) may appear, they are consistent with rates of urbanization reported in other studies57. Other studies report that 142 Chinese cities more than tripled in urban area between 1978 and 2010 and doubled in population, with total urban land in coastal China increasing by 4-5 times over the same period58.

a Northern Slope of Tianshan Mountains, b Guanzhong Plain, c Central Yunnan, d Beijing-Tianjin-Hebei, e Yangtze River Delta, f Pearl River Delta.
The number of large urban agglomerations has increased as well. In 1995, China had only one urban agglomeration with a BUA over 5000 km2, five urban agglomerations with BUAs between 2000 and 5000 km2, and 17 with BUAs below 2000 km2. By 2018, the number of urban agglomerations with BUAs over 5000 km2 increased to eight and those below 2000 km2 decreased to the same number. In general, China’s urban agglomerations experienced rapid development over the 23-year period of our study, consistent with the growth reported by previous studies57,58.
More polarization among urban agglomerations
Coastal agglomerations were relatively larger in BUA, while inland agglomerations were smaller (Fig. 2; Table 2). The average BUA for the coastal agglomerations was 10,479.91 km2, compared to the average for inland agglomerations of 2948.66 km2 in 2018 (Table 2). Among all agglomerations, the Beijing-Tianjin-Hebei and Yangtze River Delta agglomerations were the two largest throughout the study period, with BUAs more than twice the size of other agglomerations in 2018. Pearl River Delta was ranked the third from 1995 to 2010, but was surpassed by the Shandong Peninsula (Fig. 2; Table 2) since 2015. In terms of extremes, the smallest agglomeration (Jiuquan-Jiayuguan-Yumen) was over 40 times smaller than the largest agglomeration (Yangtze River Delta) in 2018.
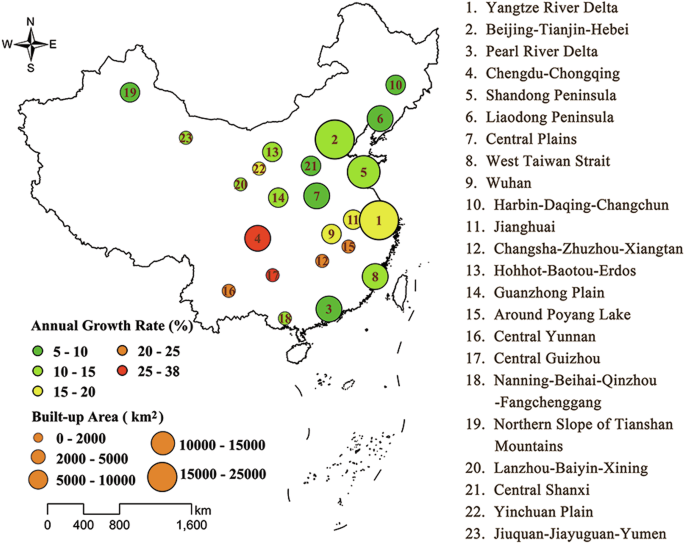
Built-up area and its annual growth rate in 23 China’s urban agglomerations during 1995-2018.
The gap in BUA between the coastal and inland urban agglomerations continued to enlarge throughout the study period, as the expansion of the BUAs in the coastal agglomerations outgrew those from inland areas (Table 2). The BUA of the Yangtze River Delta, Beijing-Tianjin-Hebei, Shandong Peninsula, Chengdu-Chongqing, and the Pearl River Delta grew more than 5000 km2 from 1995 to 2018, a figure larger than the BUA of all the urban agglomerations in 1995, excepting Beijing-Tianjin-Hebei. The BUAs of the inland agglomerations—Jiuquan-Jiayuguan-Yumen, Central Guizhou, Changsha-Zhuzhou-Xiangtan, Nanning-Beihai-Qinzhou-Fangchenggang, and Lanzhou-Baiyin-Xining—each expanded less than 1400 km2 during this same period. The annual growth rate of the BUAs is commonly used for comparisons among cities and agglomerations59,60,61,62. That for the southern inland agglomeration was 22.36%, whereas those for the coastal and northern inland agglomerations were 11.59% and 9.44%, respectively (Table 2). Accounting for various factors affecting these rates, smaller BUAs with slower annual growth rates in the northern inland agglomerations are suggestive of a lag in development relative to other agglomerations.
Less polarization within urban agglomerations
In 1995, 10 urban agglomerations had a primate city (a city substantially larger than the other cities within a defined hierarchy of cities) based on BUAs (primacy index ≥2, Fig. 3), but that number decreased to seven in 2018 (see Study Area, Methods, and Data). Among these 10 agglomerations, Nanning-Beihai-Qinzhou-Fangchenggang was the only one that maintained a high primacy index (primacy index ≥4, Fig. 3) over the study period, with a particularly high level of BUA in Nanning. The Wuhan and Central Yunnan agglomerations shifted from high to moderate primacy (primacy index 2-4, Fig. 3), and the Northern Slope of Tianshan Mountains agglomeration, from high primacy to none. The Lanzhou-Baiyin-Xining, Jianghuai, Jiuquan-Jiayuguan-Yumen, Guanzhong Plain, West Taiwan Strait, and Central Guizhou urban agglomerations all contained a primate city in 1995 but by 2018 no primate cities existed (except Lanzhou-Baiyin-Xining) (Fig. 3). Meanwhile, 10 urban agglomerations (Central Shanxi, Around Poyang Lake, Yangtze River Delta, Harbin-Daqing-Changchun, Beijing-Tianjin-Hebei, Chengdu-Chongqing, Pearl River Delta, Shandong Peninsula, Liaodong Peninsula, and Hohhot-Baotou-Erdos) never registered a primate city over the period in question, and with the exception of Hohhot-Baotou-Erdos and Pearl River Delta, the primacy index of the other eight agglomerations decreased, displaying a more uniform city size distribution. Only three urban agglomerations (Yinchuan Plain, Changsha-Zhuzhou-Xiangtan and Central Plains) that did not have a primate city in 1995, did so in 2018. In addition, the primacy index of urban agglomerations within the larger agglomeration BUAs was lower than that of smaller ones (Fig. 3). Overall, the changes observed are indicative of a decrease in primacy and suggestive of a trajectory toward more even city size distribution.
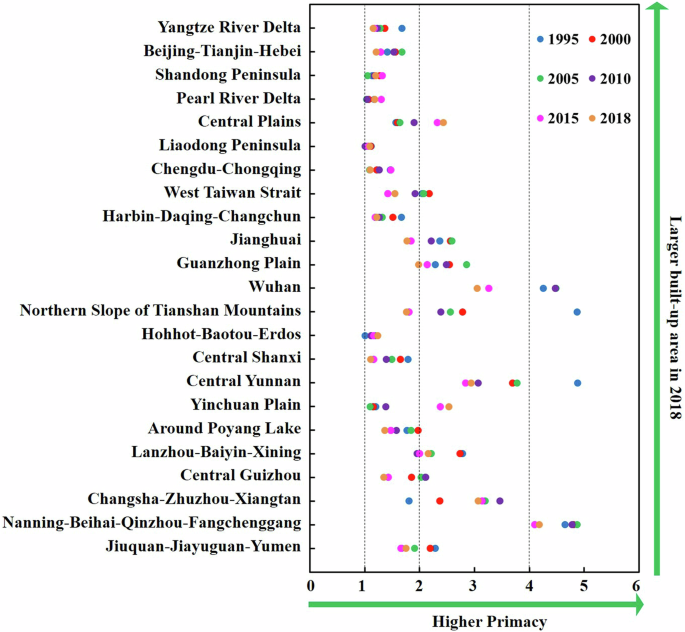
The primacy index of 23 urban agglomerations in China during 1995-2018.
City-size evolution in three largest urban agglomerations
We used the Pareto exponent (an index reflecting the relationship between city size and rank order) to describe city size distributions from 1995 to 2018 for a subset of agglomerations: the Yangtze River Delta, Pearl River Delta, and Beijing-Tianjin-Hebei urban agglomerations. These agglomerations have nine or more cities and are thus suitable for distributional analysis. Although the Pareto exponent in all the three agglomerations was greater than 1, each one exhibited different levels and trajectories (Fig. 4a). The Pareto exponent for the Yangtze River Delta was 1.0411 in 1995 and had increased to 1.3953 by 2018. From 1995 to 2018, the Pareto exponent for the Beijing-Tianjin-Hebei increased from 2.0036 to 2.3717. This change of Pareto exponent indicated a relatively more uniform city size distribution in both urban agglomerations. Nonetheless, the Pearl River Delta registered a convergence to Zipf’s law, at least since 2000, with its Pareto exponent decreasing from 1.7151 to 1.2613. Consistent with our primacy analysis, the Pareto exponent for the Pearl River Delta decreased by 0.3181 from 1995 to 2018, indicating a more polarized pattern.
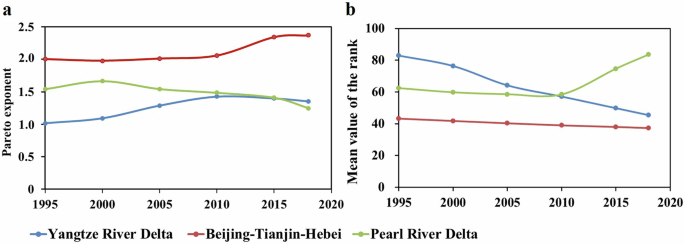
a Pareto exponent, b mean value of the rank.
The mean value of the rank for the cities in each of these agglomerations decreased in the Yangtze River Delta and Beijing-Tianjin-Hebei (i.e., enhancing ranks in all China’s cities), but increased in the Pearl River Delta (i.e., dropping ranks) (Fig. 4b). Shanghai, in the Yangtze River Delta agglomeration, has long been the third largest among all the Chinese cities, but the other 15 cities in the agglomeration all rose in city rank, with the mean value of city rank decreasing from 83rd to 45th (Fig. 5). Similarly, Beijing and Tianjin have long ranked as the top two in size among all the Chinese cities, but the mean value of the rank decreased from 43rd to 37th owing to the rise of eight of the other 11 cities in the urban agglomeration. In contrast, the Pearl River Delta cities declined in mean rank, with scores increasing from 62nd to 84th. This decline in rank has been generated by a widespread reduction in the ranks of cities within this agglomeration up to 2018 (Fig. 5). It is also noteworthy that there was no spatial autocorrelation in the rank of cities in these three urban agglomerations, indicating city rank was not significantly influenced by spatial planning (see Supplementary Discussion).
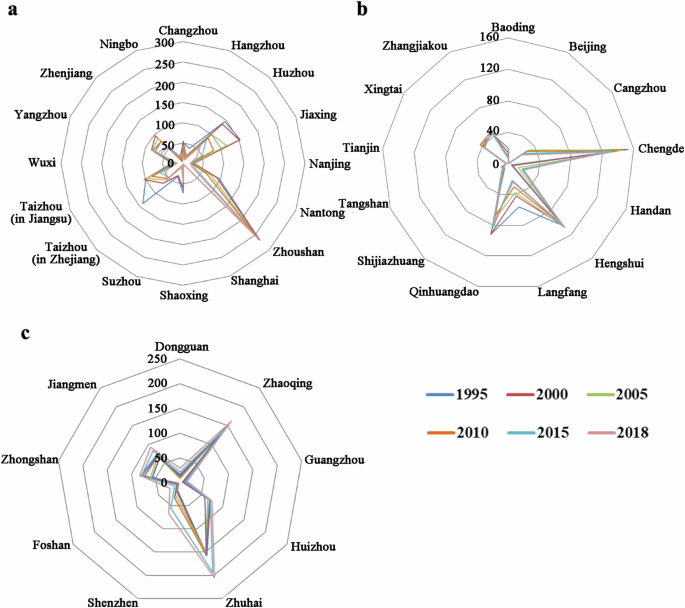
a Yangtze River Delta, b Beijing-Tianjin-Hebei, c Pearl River Delta.
Discussion
China has experienced considerable urban development over the past 40 years63. A striking point of this study is the 287.60% increase of urban extent across China from 1995 to 2018. Previous studies highlight that between 1990 and 2018, the urban population of China increased by 36.12%64. As such, the urban population growth rate has been smaller than the rate of urban expansion. Low synchronicity in China between population growth and infrastructure expansion has been demonstrated previously, largely due to infill65,66,67. These patterns have been ascribed to the interactions of various factors related to national economic development, development policies, and stage of urbanization68. It is noteworthy, however, that urban per capita floor space in China increased from 7.2 m2 to 32.9 m2 between 1980 and 2012, a period in which urban people per household fell below 3 and as a growing middle-class homeowners sought larger residences. As a result, residential floor space increased five-fold, an indicator of infrastructure expansion69. Indeed, the growth of urban expansion exceeding that of urban population is a worldwide phenomenon4. For these and other reasons, population growth and urban expansion are both widely used in studies in city size distribution, although the two measures reflect different but indirectly related aspects of urbanization9,30,70.
Based on satellite remote sensing data, this study revealed that 23 Chinese urban agglomerations increased their average BUAs 3.8-fold between 1995 and 2018. This general trend, however, masks several significant distinctions among the BUAs of urban agglomerations. Firstly, eight coastal urban agglomerations increased 1.82 times more BUA than 15 inland urban agglomerations, indicating that the coastal urban agglomerations were significantly larger than the inland ones, and the disparity between coastal and inland urban agglomerations had increased over time. Secondly, based on the analysis of top-two cities, the primacy index decreased with time in 74% of the urban agglomerations (Fig. 3), indicating that city size distribution became more uniform within urban agglomerations. From a BUA perspective, urban agglomerations appear to be polarizing, that is, larger ones increasingly separated from smaller ones, whereas this process is not taking place within individual urban agglomerations.
The widening gap between the development of large, medium, and small cities is one of notable development characteristics in China’s recent history of rapid urbanization. Large cities tend to have less regulated urban expansion, abnormally high housing prices, traffic congestion, and environmental deterioration9. Small and medium-sized cities score better on these characteristics but maintain fewer urban functions than their larger counterparts71. The National New Urbanization Plan (2014-2020) put forward the strategic task of optimizing the urban scale and structure, with urban agglomerations as the foundation26. For example, the Xiong’an New Area is a strategic response to promote the coordinated development of large, medium and small cities in Beijing-Tianjin-Hebei urban agglomeration72. Insomuch as urban area and infrastructure in our study reflects such development, cities of different BUA sizes appear to be tending toward more uniform internal agglomerations. Policies are also implemented to ensure more balanced development between urban agglomerations, such as those aiming to revitalize the old industrial base in the northeast, the rise of the central region, and the development of the western region in China73,74. Meanwhile, green belts have already been established in large cities to halt their sprawling clustering, including that in Beijing, Shanghai, and Wuhan75. Despite these policies, or perhaps owing to their recency, the polarization among different urban agglomerations appears to be increasing based on our finding, as well as in analyses conducted elsewhere71.
The long-standing Huhuanyong line demarcates the geo-demographic differences between the densely populated eastern portion and the sparsely populated western portion of the country76,77. These distinctions appear to be reflected among the urban agglomerations today based on expansion and infill measures in the coastal versus the inland urban agglomerations78. Agglomeration economies, improvements in transportation and trade, differential investment in infrastructure, and migration rules advanced by policies, have reduced polarization among cities within the agglomerations. Whether or not they will reduce polarization in the future between the coastal and inland urban agglomerations (roughly coinciding with the Huhuanyong line), remains an open question.
The Yangtze River Delta and Beijing-Tianjin-Hebei agglomerations displayed increasingly uniform (i.e., less polarization) characteristics, as demonstrated by the city size distribution based on changes in the Pareto exponent as well as decreases in the mean value of rank (Figs. 4 and 5). This finding is consistent with that found by Gao and colleagues30. As China’s economic center, proximity to Shanghai appears to be associated with the growth of neighboring cities of the Yangtze River Delta, partly due to trade and transportation connectivity79. In addition, because of preferential policies on financing and taxation from local government, township enterprises have developed rapidly80, promoting growth of small- and medium-sized cities. As such, most cities in this agglomeration enhanced their city rank, reducing polarization. Beijing and Tianjin have political advantages as the capital and its nearby municipality, respectively, and their dynamism has transferred industries to neighboring cities, driving their development81. As such, polarization has decreased in the Beijing-Tianjin-Hebei urban agglomeration.
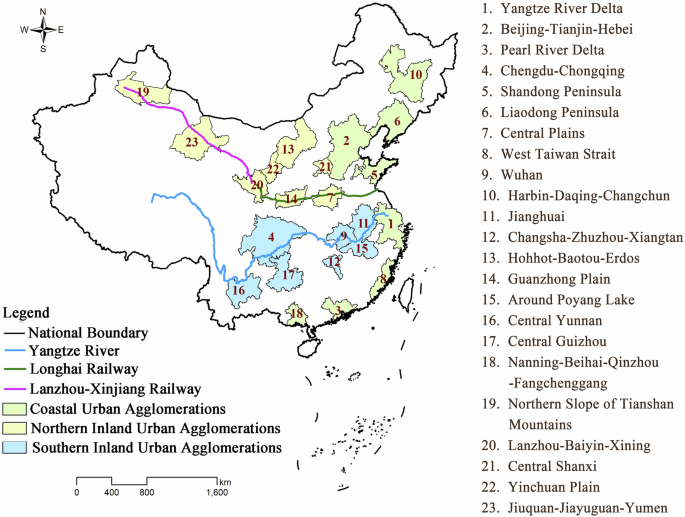
Note the three axes (color differentiated): coastal, northern inland, and southern inland.
In contrast, the Pearl River Delta urban agglomeration exhibited increasing unevenness by the two measures examined. Here, the rapid development of two large cities—Shenzhen and Guangzhou—swamped that of the small cities, which remained somewhat stable in rank over the study period. The conditions in this agglomeration have been influenced by the adjacency of Hong Kong and Macao, primarily through spillover effect82,83, but its impact is not treated in this study. Notably, the limitation of land resource and policies to maintain significant green spaces in Hong Kong have fostered vertical infrastructure rather than areal expansion, which would impact our measurement of city size in the Pearl River Delta. It would appear, however, that Hong Kong has gradually lagged behind the inland cities in terms of the pace of its economic growth84. Meanwhile, Shenzhen and Guangzhou, each more than double the population and area of Hong Kong, have maintained relative rapid development trajectories85. These two largest cities were mainly spurred by Chinese policy advantages, such as lower taxes, greater investment on high-tech industry and talent attraction by building talented worker housing86. This development has created a gap in city size relative to the remainder of the cities in the delta. Thus, the mean value of city rank showed an increase and urban polarization appeared in Pearl River Delta.
It is noteworthy that the polarization results for the Pearl River Delta urban agglomeration in our analysis differ from those reported by Gao and colleagues30. It is possible that the discrepancy between the two studies may stem from our use of different data sources. The former study used 1-km nighttime light data only to determine built-up area data, as opposed to our fusion method (see below). Nighttime light data have saturation and spillover effects that may lead to overestimation of urban area30. Additionally, the 1 km spatial resolution of these data may have failed to extract urban areas as precisely as our preferred method, particularly in areas with reduced nighttime light87.
Overall, our analysis yields an insight about urban hierarchy and agglomerations in contemporary China. China’s 23 urban agglomerations designated by its government appear to have given rise to non-city polarization within each urban agglomeration but polarization among urban agglomerations, foremost between the coastal and inland urban agglomerations.
Study area, methods, and data
Study area
The 23 urban agglomerations in our study are comprised of 168 cities identified in the 11th Five Year Plan of the People’s Republic of China for 2006-2010 (Fig. 6). The agglomerations are ranked by GDP and numbered accordingly in Fig. 6. For the most part, this individual ranking of the urban agglomerations is strongly linked to the size of population and areal expanse. The urban agglomerations are arranged along three elongated spatial clusters or axes: coastal, northern inland (following the Longhai and Lanxin railways), and southern inland (Yangtze River drainage) (Fig. 6). The smallest agglomeration is comprised of only three cities and the larger is comprised of ten or more (Supplementary Table 1). The three largest urban agglomerations in terms of GDP are the Yangtze River Delta, Beijing-Tianjin-Hebei, and Pearl River Delta (Fig. 6). These three urban agglomerations occupy about 3% of the total land area but account for 18% of the total population and 36% of the total GDP of China88. It is noteworthy that Hong Kong and Macao are considered independently by the Chinese government and is not part of the Pearl River Delta agglomeration of nine cities. Our study remains consistent with the government’s designated agglomerations, but notes the consequences of the omission of Hong Kong and Macao on the agglomeration immediately adjacent to it.
Urban classification data
In our previous study56, the built-up area was developed for China from 1995 to 2015 on the Google Earth Engine Platform. Our study expanded the study period to 2018, and improved the accuracy of the classification results through inter-annual correction. It is noteworthy that within the administrative boundary of cities both non-urban and urban land covers (i.e., impervious infrastructure) existed during the study period, such that the transformation of non-urban to urban covers largely constituted “infill” within the administrative boundaries.
To avoid repetition, we only briefly introduce our algorithm in this section. For the full classification methodology, readers are directed to the Supplementary Methods. Landsat imagery and nighttime light imagery for 1995, 2000, 2005, 2010, 2015, and 2018 constituted the base data for the BUA analysis, utilizing the machine learning classification algorithm55. Landsat imagery was preprocessed by selecting only the pixels with the lowest range of cloud scores to compute per-band median values. Six per-pixel spectral indices (i.e., Normalized Difference Water Index [NDWI], Normalized Difference Built-up Index [NDBI], Urban Index [UI], Normalized Difference Spectral Vector [NDSV], Normalized Difference Vegetation Index [NDVI] and Enhanced Vegetation Index [EVI]) were calculated and used in the classifier, together with all the bands. The nighttime light imagery was used to generate and label training data by employing a series of nighttime light thresholds, and the details of the threshold are listed in Supplementary Methods. A Random Forest classifier with 20 trees was applied to classify pixels as built-up (defined as over 50% built land cover) and non-built-up (defined as 50% or more natural land cover). In addition, 60,000 validation points (10,000 points for each year) were hand-labeled using Google Earth imagery to calculate the accuracy of classification56. Five accuracy metrics are used—overall accuracy, true positive rate (TPR: accuracy of built-up pixels prediction), true negative rate (TNR: accuracy of non-bulit-up pixels prediction), balanced accuracy, and User’s accuracy (see Supplementary Methods for equations).
Growth of built-up area in urban agglomerations
The annual growth rate (AGR) of the BUAs of each urban agglomeration between 1995 and 2018 was calculated using the following equation:
where ({U}_{i}) and ({U}_{j}) denotes the BUA in year i and j. Polarization may be interpreted as occurring if the annual growth rate of BUA in large urban agglomerations is higher than that in urban agglomerations with smaller BUA.
City size distribution within urban agglomerations
City size distribution within the urban agglomerations is addressed via the primacy index32,35 and Pareto assessments. The primacy index constitutes the ratio of the population of the largest city to the second largest city36. In our case, however, the BUA is employed in the ratio of expansiveness rather than population, a method used in other studies27,89. In our study, the index examines only the two largest cities in each urban agglomeration. When the primacy index is equal to 1, a dual-core case exists, which in our assessment indicates that the two largest cities have similar BUAs. Any index approaching or exceeding 2 indicates a primate city arrangement in which an index between 2 and 4 constitute a moderate primacy and greater than 4 represents a high primacy90. Polarization in our study is interpreted when the primacy index increases with time, recognizing that the two cities compared may not capture the dynamics among the complete city-set per urban agglomeration.
The Pareto distribution captures the city size distribution of a complete set of cities within an urban agglomeration. The small number of cities (≤ 8) in our study constrains the use of the Pareto assessment across all urban agglomerations. As such, our Pareto analysis addresses the three largest urban agglomerations with more than eight cities: Yangtze River Delta, Beijing-Tianjin-Hebei, and Pearl River Delta. The rank-size distribution of all the cities in each urban agglomeration provides an improved understanding of city size distribution and polarization over that provided by the primacy index35,91. To avoid a standard error induced bias in the estimate, the Pareto exponent was calculated as follows38:
where ({R}_{i}) is the ranking order of the city i; A is the size of the largest city; ({S}_{i}) is the size of the city i (or the total BUA); (a) is the Pareto exponent, reflecting the relationship between city size and rank order; and u is the error term. A larger or smaller α indicates, respectively, a more or less even city size distribution35. To analyze the size-rank distribution dynamic and its differences in urban agglomerations, the mean value of the rank (MVR) of cities in the urban agglomeration was calculated. MVR is not related to the number of cities in urban agglomerations, but the rank of each city.
where ({R}_{i}) is the rank of city i; and n is the total number of cities in the urban agglomeration.


Responses