Understanding wrist skin temperature changes to hormone variations across the menstrual cycle

Introduction
The menstrual cycle is a complex physiological process involving hormonal changes and interactions across multiple body systems1. One notable pattern that has been reported in clinical literature is the biphasic fluctuation of resting-state body temperature, with temperatures higher post-ovulation than pre-ovulation2. This fluctuation is influenced by the interplay of hormones such as estrogen, which lowers temperature, and progesterone, which has a thermogenic effect throughout the menstrual cycle. These hormonal dynamics regulate the release of luteinizing hormone (LH). Estrogen provides positive feedback in the late follicular phase to trigger the mid-cycle LH peaks, and progesterone inhibits LH release during the luteal phase while counteracting the positive feedback effect of elevated estrogen on LH.
This biphasic fluctuation pattern has led to the development of algorithms that rely on periodic changes in body temperature for purposes such as menstrual cycle tracking, pregnancy preparation, and contraception2. Previous research has typically relied on resting-state temperature measured at internal body sites like the esophagus or rectum because these sites closely reflect the thermal characteristics of central arterial or mixed venous blood2. However, measuring temperature at these sites can be inconvenient due to their invasiveness. Recent work has been done using peripheral body temperature (PBT) obtained from self-monitoring consumer devices like smartwatches and rings3,4,5,6,7,8, yet little has been done to explore either the relationship between PBT and hormone variations or the effectiveness of PBT in capturing anticipated patterns across the menstrual cycle2.
Research efforts examining the relationship between hormones and temperature have often centered around studies in which hormones are administrated to rats and individuals with anovulatory cycles9,10,11 or collected during select parts of the menstrual cycle2,12. During a study in which hormones were administered to four patients with anovulatory cycles, Davis et al.9 observed a rise in temperature after the patients received progesterone and a subsequent decline following the discontinuation of estradiol and progesterone. Another study by Morris et al.13 involved 27 participants collecting hormones over 10–14 consecutive days mid-cycle to measure the relationship between basal body temperature (BBT) and the LH surge. Their findings revealed that the LH surge occurred within 1 day of the BBT nadir for 81% of subjects who had such a distinct fiducial point in their hormone data. Other studies have utilized urinary LH tests to compare body temperature across the follicular and luteal phases, but these studies often do not capture fluctuations across the entire menstrual cycle6,7,14,15. Little to no work has examined how hormone fluctuations align with PBT throughout the entire menstrual cycle, perhaps due to the practical challenges of recording daily hormone and PBT data.
We investigate the relationship between resting PBT during sleep and daily hormone variation. In light of recent innovations in at-home hormone testing and continuous passive sensing, we compare WST recorded by smartwatches with levels of LH and estrone-3-glucuronide (E3G), one of the urinary metabolites of estradiol, using urinary hormone tests. We also examine the influence of potential confounding factors like activity level and stress on this relationship across the entire menstrual cycle.
Results
Participant and cycle characteristics
A summary of participants’ data is provided in Table 1, both collectively across the entire menstrual cycle and split across menstrual cycle phases. All physiological signals, as well as self-reported sleep issues, exhibited statistically significant variations across menstrual cycle phases according to χ2 and repeated measures ANOVA tests.
Figure 1 shows the trends of nightly WST, daily E3G, and daily LH levels across the entire menstrual cycle. Participants’ WST measurements peaked during the luteal phase (34.0 ± 1. 0 °C) and were lowest during the late follicular phase (33.7 ± 0. 8 °C). Furthermore, levels of E3G and LH were found to be highest during the ovulation phase (179.0 ± 141.7 ng/mL, 10.3 ± 16.4 mIU/mL), with the lowest E3G values being recorded during the menstrual phase (97.7 ± 73.3 ng/mL) and the lowest LH values being recorded during the luteal phase (4.8 ± 14.1 mIU/mL).

A plot of nightly wrist skin temperature (WST), luteinizing hormone (LH), and estrogen (E3G) levels throughout all participants’ menstrual cycles starting from menstruation with LOESS smoothing. The shaded regions indicate 95% confidence intervals.
The effect of hormone levels on nightly WST
As shown in Table 2, four out of the ten different models yielded statistically significant relationships between hormone levels and nightly WST. In the linear model, higher LH levels were associated with statistically significant decreases in nightly WST throughout the menstrual cycle (β = −0.002, p < 0.001, 95% confidence intervals (CI) [−0.004, −0.0009]). In the quadratic model, statistically significant linear (β = −0.006, p < 0.001, 95% CI [−0.009, −0.003]) and quadratic terms (β = 0.00004, p < 0.001, 95% CI [0.00001, 0.00006]) indicated that higher levels of LH predicted lower nightly WST. However, this effect was only present for below-average levels of LH as seen in Supplementary Fig. 1. The interaction between E3G and LH was also statistically significant (β = −0.00001, p < 0.001, 95% CI [−0.00002, −0.000005]), suggesting that LH has significant relationships with WST despite being strongly correlated to E3G. For both the ovulation and the luteal phases, the inclusion of quadratic terms for the hormone level predictors revealed significant relationships between hormone and nightly WST levels. During the luteal phase, both the linear and quadratic terms for LH levels were significant, where higher LH levels were associated with lower WST for below-average levels of LH as seen in Supplementary Fig. 2 (linear term: β = −0.008, p < 0.01, 95% CI [−0.01, −0.002]; quadratic term: β = 0.00006, p < 0.01, 95% CI [0.00002, 0.0001]). There was also a statistically significant relationship between E3G and WST in the ovulation phase for the quadratic term, with higher estrogen levels leading to lower WST (β = 0.000002, p < 0.05, 95% CI [0.0000002, 0.000003]). As shown in Supplementary Fig. 3, this relationship was only present for below-average E3G values.
Univariate associations between WST, hormones, and confounds
As reported in Table 3, we examined confounding variables that could affect nightly WST levels by including them in the four univariate models with statistically significant results. No significant associations were found between WST and demographic characteristics, step count, and stress levels. However, a relationship was found between glucose and WST for the two entire-cycle models (β = 0.04, p < 0.001, 95% CI [0.02, 0.06]). High physical activity was correlated with lower WST (β = − 0.05, p < 0.05, 95% CI [− 0.11, − 0.002]) in the quadratic model for the entire cycle. Moreover, high levels of sleep issues were associated with statistically significant increases in WST throughout the entire cycle (linear model: β = 0.07, p < 0.05, 95% CI [0.002, 0.13]; quadratic model: β = 0.06, p < 0.05, 95% CI [0.001, 0.12]), and such effects increased in magnitude during the ovulation phase in particular (“high”: β = 0.14, p < 0.05, 95% CI [0.03, 0.26]; “very high”: β = 0.15, p < 0.05, 95% CI [0.02, 0.28]).
Multivariate associations between WST, hormones, and confounds
To better assess whether the significance of the identified relationships between nightly WST and hormone levels occurred merely due to confounding variables, we created a multivariate linear mixed-effects model with all the statistically significant confounds and the hormone variables. Further details of these models’ results can be found in Table 4. Besides self-reported physical activity levels, all statistically significant relationships reported above persisted in both direction and significance. Thus, the relationships between WST, E3G, and LH levels were still notable in the presence of confounding variables.
The temporal difference between WST and hormone variations
Figure 2 shows the temporal alignment between mid-cycle hormone peaks13, WST peaks, and WST nadirs. E3G and LH peaks were observed around the day of ovulation with small differences of approximately 0.2 ± 2.5 days and −0.2 ± 2.5 days, respectively. Furthermore, hormonal peaks were typically followed shortly after by days of WST nadirs, but with a slightly wider range. WST nadirs occurred 2.3 ± 4.5 days before the day of peak E3G and 1.8 ± 4.0 days before the day of peak LH. Meanwhile, WST peaks occurred 8.2 ± 4.2 days after the day of peak E3G and 7.6 ± 4.8 days after the day of peak LH.
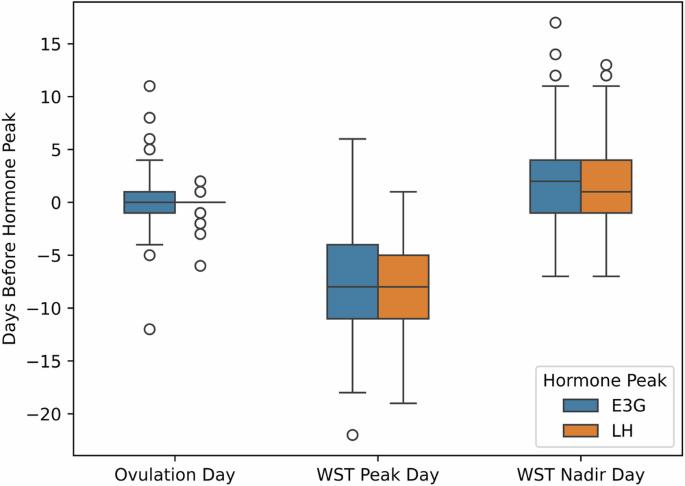
A boxplot displaying the time difference (in days) between peaks in luteinizing hormone (LH), and estrogen (E3G) levels and the following events: day of ovulation, peaks in nightly wrist skin temperature (WST) across the cycle, and nadir in WST across the cycle. The center line represents the median, bounds of box represents the lower (Q1) and upper (Q3) quartiles, and the whiskers extend to show the remaining distribution, with outliers represented with circles.
Discussion
Previous research suggests a strong connection between body temperature variations and menstrual cycle phases, potentially resulting from the secretion of hormones during this time2,16. To analyze these relationships across the menstrual cycle, we investigated the correlation between E3G and LH levels obtained from daily hormone tests in conjunction with nightly WST readings collected through a smartwatch. We did this by building a hierarchy of models to understand the effects of hormones, behaviors, and other physiological parameters on WST. We then identified a negative linear relationship between LH and WST, while the relationship between E3G and WST was only evident when considering non-linear associations and stratifying by menstrual cycle phase. Specifically, higher E3G levels during the ovulation phase were linked to lower WST, whereas higher E3G levels during the luteal phase corresponded to elevated WST. These relationships remained robust even after accounting for confounding factors such as glucose levels, physical activity levels, stress, and sleep quality.
Previous studies have found that E3G contributes to a cooling effect days within ovulation, while progesterone plays a key role in the elevation of body temperature in the luteal phase2. Consistent with previous research findings7,8,17, we observed a biphasic pattern of WST with the lowest values coinciding with peak levels of E3G and LH and the highest values occurring during the luteal phase after a dramatic decrease in LH. Since progesterone acts as a primary inhibitor of LH, the negative correlation observed between LH and body temperature is likely a result of its interaction with estrogen and progesterone throughout the menstrual cycle18. Additionally, the positive quadratic relationship between E3G and nightly WST is likely associated with the interaction between LH and progesterone during the luteal phase, wherein peak progesterone levels result in elevated body temperature.
WST troughed around two days near the mid-cycle hormone peaks, and WST peaked approximately 7 days after. However, our study revealed a higher degree of variation compared to previous works that reported 0–2 days as the time between hormone peaks and resting-state body temperature nadirs13,19 and 1–4 days as the time between hormone peaks and resting-state body temperature peaks20,21. This discrepancy may be attributed to differences in detecting ovulation based on temperature measured at peripheral versus internal body sites17,19. Zhu et al.17 achieved higher true-positive and false-positive rates in ovulation detection when using WST instead of BBT, but we did not account for such discrepancies in our data analysis plan. Another explanation for the discrepancy between our work and prior literature is variation in hormonal concentrations between and within individuals at different time points across their menstrual cycles2. Prior studies have not collected longitudinal hormonal data because of the burden it imposes on study participants12,15,22,23,24, resulting in a limited scope of how hormone variation at different time points influence cycle phase timing and thermoregulation.
Our findings underscore the limitation of algorithms that assume a fixed offset between hormonal effects and temperature, as they fail to account for physiological diversity within and across individuals. However, the notable alignment between WST and hormones suggests that wearable devices could serve as accessible tools for understanding hormonal patterns. This is particularly significant given the current inaccessibility and high cost of hormone testing. Wearables present a potentially ubiquitous and less expensive alternative, prompting the need for further research into the feasibility and usability of such devices for hormonal insights. Clinicians may also contemplate the development of algorithms to predict hormonal health using signals collected by wearables, while carefully considering the privacy, security, and legal implications25.
We acknowledge several limitations in our work. Our study cohort consisted mostly of young adults, which may not fully represent all individuals who menstruate. Future work is needed on how our results generalize to other relevant demographics, including those who are peri-menopausal or undergoing hormonal intervention. To enable daily hormone testing and support long-term study adherence26, we opted for commodity devices suitable for at-home usage. The hormone analyzer27,28,29,30, glucose monitor31, and smartwatch32 we chose have all shown strong correlations with tests conducted in clinical settings, but they may still have marginally inferior reliability and precision during continuous data collection. Devices like clinically validated actigraphs or sensors designed for other peripheral sites may also yield different results compared to those used in our study33,34. Therefore, future studies should consider conducting similar analyses in clinical settings or using other data collection methods to support our observations.
Another limitation is that we might not have collected all potentially relevant hormones. Mira fertility testers only collected granular E3G and LH data at the time of this study, omitting progesterone and other relevant menstrual hormones such as follicle-stimulating hormone (FSH). Therefore, we encourage future studies to incorporate a more comprehensive range of hormonal data. We also recognize that there may be other confounding factors that influence temperature and were not considered in our study, such as alcohol consumption35, travel36, and illness8. Although we asked participants to self-report their sleep quality, sleep issues can be induced by various factors including light exposure, the lunar cycle, and restlessness due to high motor activity; each of these factors may themselves influence blood glucose metabolism and nightly WST34,37,38,39,40. We did not record all of these variables to avoid overburdening participants with their electronic diary entries, but future studies could examine these relationships more deliberately to investigate their interplay with hormonal variations and individual differences in body temperature.
Methods
Subjects
Fifty Canadian volunteers were recruited via social media groups and workspaces operated by women’s health advocacy organizations in the Greater Toronto Area. Recruitment was limited to menstruating individuals who were between 18 and 30 years old and had not used hormonal therapy or hormonal contraception for at least three months prior to joining the study. Participants were informed that they could request to withdraw from the study at any point and that those who become pregnant and/or fail to adhere to the study protocol would be de-enrolled.
Study design and data collection
The study protocol received approval from the Research Ethics Board at the University of Toronto (Protocol #41568), which evaluates research according to institutional, provincial, and federal practices along with the Declaration of Helsinki to ensure best practices in the protection of human subjects. Each participant electronically provided informed consent through e-signatures. For three consecutive months, each participant collected a variety of physiological signals associated with menstrual health via commercial wearable devices. Additionally, they self-reported aspects of their daily living in electronic diaries completed each morning. These diaries asked participants about their physical activity levels, assessed using a 5-point scale ranging from “very low” to “very high,” alongside their sleep issues and stress levels, evaluated on a 6-point scale from “did not experience” to “very high”.
Participants were given a Fitbit Sense smartwatch41 to measure their nightly WST and a Dexcom G6 continuous glucose monitor (CGM)42 to measure blood glucose. Participants were instructed to wear both devices at all times except during necessary maintenance activities like charging or sensor replacement. To collect WST data, users must be in an extended period of sleep of at least three hours while wearing their watch. Whenever this requirement is satisfied, Fitbit reports an average nightly temperature value based on the data collected during that period of sleep. Beyond these continuous data streams, participants were also asked to measure their LH and E3G hormone levels using the Mira Plus Starter Kit43 daily. Measuring hormones with this device requires completing a disposable urine test wand and then waiting roughly 16 min for the Mira analyzer to finish its processing. Since the analyzer requires users to refrain from liquid consumption for at least two hours prior to collecting a urine sample, participants were advised to complete this hormone test every morning shortly after waking up.
Other researchers have assessed the accuracy and reliability of these devices. For example, Fitbit’s PBT estimates yield an estimation error of 0.23 ± 0.08 °C when compared against temperatures taken using the ThermoScan PRO 4000 ear thermometer44,45, while other studies have shown minimal differences between Fitbit’s activity measurements (e.g., step count, heart rate) and corollaries collected by manual methods32. Meanwhile, David et al.31 measured 98.7% matching between the Dexcom G6 CGM and point-of-care testing according to a Clarke Error Grid analysis. Finally, Nakhuda et al.27 confirmed a strong correlation between serum E2 concentrations measured by immunoassay analyzers and urine E3G concentrations quantified by Mira devices. Their findings corroborate Mira’s performance according to other studies that have observed 99% accuracy in ovulation prediction and 20% in coefficient of variation28,29,30.
Data processing
Mira estimates the start and end dates of each menstrual cycle phase, along with the day of ovulation, via rises and falls in the collected E3G and LH levels. With this information, we generated four phase labels: follicular (the day after the last day of menstrual flow to the first day of the fertile window), ovulation (the fertile window), luteal (the last day of the fertile window to the first day of menstrual flow), and menstruation (days with menstrual flow). Cycles that had more than 4 consecutive days of E3G and LH data missing, more than 40% of E3G and LH data missing, and/or more than 20% of nightly WST data missing were dropped from the dataset. Based on these criteria, 49 out of the 172 total cycles (28.4%) were eliminated, yielding a dataset with 123 cycles from 45 participants. To consolidate continuous physiological data into daily values, we calculated the total step count and median glucose levels for each day (12:00 AM-11:59 PM). We ensured the representativeness of summary statistics by removing days with less than 18 hours of continuous physiological data. For the cycles that remained, Fitbit, Dexcom CGM, and diary data were available for averages of 98.3 ± 0.9%, 84.5 ± 7.8%, and 89.7 ± 2.4% respectively within a given cycle.
For each menstrual cycle, we performed a series of preprocessing steps to account for noise in our sensor data. We used a process similar to the one used by Maijala et al.46 to prepare the WST data; after applying linear interpolation to standardize the temporal spacing between data points and account for missing data, we applied a 5th-order Butterworth low-pass filter47 with a cutoff at 10% of the target sampling frequency (1 sample per day) to attenuate noise in the temperature signal. We then identified the peaks and nadirs of nightly WST within each cycle (from the end of one menstrual phase to the start of the next) by pinpointing the lowest temperature before menstrual bleeding, followed by a minimum of three consecutive days of rising temperature during which the highest local maximum was recorded. This process aligns closely with the “three-over-six rule”48, which states that a notable peak in WST occurs when it is elevated by at least 0.2 °C for at least five of the preceding six days and it remains elevated for a minimum of three consecutive days8. We also identified peaks in E3G and LH levels by pinpointing the highest local maximum in every cycle. On average, the E3G peak was typically 1.3 ± 0.5 times higher than the next highest E3G local maximum within a given cycle, while the LH peak was typically 2.2 ± 5.0 times higher than the next highest LH local maximum within a given cycle.
Statistics
To assess variations across the menstrual cycle and its phases, we present descriptive statistics for participant demographics and physiological signals in Table 1. We present these statistics both in aggregate and separated by menstrual cycle phase with χ2 and repeated measures ANOVA test results to report notable differences. After visualizing nightly WST, E3G, and LH levels across temporally normalized cycles with LOESS smoothing, we then assess the impact of our collected data on nightly WST levels using linear mixed-effects models. We consider both linear and curvilinear relationships49 across the entire menstrual cycle and stratified by menstrual cycle phase. We developed univariate models with potential confounders for every significant relationship identified, after which we constructed a multivariate model including all confounders with a statistically significant association with nightly WST in the univariate models. In all models, hormone levels were centered according to each person’s average levels, and we incorporated an interaction between E3G and LH to assess their dependency. Random slopes and intercepts were utilized in all models to account for WST variance between and within participants. The results of our models were reported according to β-coefficients, 95% CI, and the significance of each relationship within models, considering a statistical significance threshold of p < 0.05. We applied Holm–Bonferroni adjustments to correct for multiple comparisons. We conclude our analysis by presenting box plots showing the timing differences between WST peaks and nadirs and mid-cycle hormone peaks.


Responses