MiRNAs as biomarkers of nutritional therapy to achieve T2DM remission in patients with coronary heart disease: from the CORDIOPREV study

Introduction
Type 2 diabetes mellitus (T2DM) is currently one of the major problems for health services worldwide [1]. More than 48 million individuals in the European Union were estimated to have T2DM in 2019, which represents 9.9% of the population. In addition, diabetes was the direct cause of 1.5 million deaths, and 48% of all deaths due to diabetes occurred before the age of 70 years [2]. Moreover, T2DM is also directly related to the increasing incidence of obesity, considered now as a pandemic [3]. Patients with T2DM undergo deterioration in their quality of life, increasing the probability of death from cardiovascular disease, compared to healthy subjects [4]. In fact, subjects with a cardiovascular event and T2DM have a higher probability of a new event than subjects without T2DM [5].
Although the disease involves several metabolic alterations, including dysregulation of glucose homeostasis and lipid metabolism, remission of the disease is possible. Remission of T2DM is defined as reaching glucose levels below the range that is characteristic of diabetic patients, according to the ADA criteria, for 2 consecutive years: glycosylated hemoglobin < 6.5%, fasting plasma glucose <126 mg/dL and 2 h plasma glucose after an oral glucose tolerance (OGTT) test <200 mg/dL, and the absence of drug therapy or surgery [6]. However, the greatest likelihood of success in diabetes remission is due to bariatric surgery [7], and to a lesser extent to physical activity [8] or to diets involving caloric restriction [9, 10]. In this context, adherence to heart-healthy diets has become a key non-invasive tool to achieve disease remission. However, given the genetic differences between individuals, there is no universal dietary model applicable to the general population that facilitates T2DM remission. For this reason, genetic or epigenetic markers are needed to help us choose the dietary model that most favors the remission of the disease.
MicroRNAs (miRNAs) are short RNA sequences of 19–22 nucleotides that participate in the regulation of gene expression, and they are, therefore, directly involved in the development and progression of different diseases [11]. In fact, previous studies by this research group have demonstrated the potential of miRNAs to predict the development of T2DM [12] and even to select between two healthy diets, a low-fat diet and a Mediterranean model (Med diet), to benefit patients with coronary heart disease (CHD) and help them remain free of T2DM [13]. In our previous study, we included all the non-T2DM at baseline of the CORDIPOREV study with the aim of identifying a miRNA profile associated with T2DM according to the diet, in order to select the more suitable diet for preventing T2DM development.
In contrast, we now hypothesize that a miRNAs plasma profile may be associated to T2DM remission in a CORDIOPREV subset of patients with T2DM at baseline of the CORDIPOREV study.
Based on these previous observations, our aim was to study the potential of baseline miRNAs plasma levels as a tool to administer the Mediterranean diet or the low-fat diet to achieve T2DM remission after 5 years of follow-up in newly-diagnosed T2DM patients with coronary heart disease, who were diagnosed with T2DM when recruited to the CORDIOPREV study.
Materials and methods
Study subjects
This work was conducted within the framework of the CORDIOPREV study. The rationale, methods, and baseline characteristics have been reported by Delgado-Lista et al. [14, 15] and provided in Clinicaltrials.gov (NTC00924937). The CORDIOPREV study is an ongoing prospective, randomized, single-blind, controlled dietary intervention trial in 1002 patients with coronary heart disease, at high cardiovascular risk. The inclusion/exclusion criteria have been described in detail elsewhere [15]. Briefly, the inclusion criteria were: patients with acute coronary syndrome (unstable angina, acute myocardial infarction) and high-risk chronic CHD according to the following criteria: (A) acute myocardial infarction; (B) unstable angina; and (C) chronic high-risk ischemic heart disease. The exclusion criteria were: (a) patients <20 years of age or >75 years old, or with a life expectancy <5 years; (b) severe heart failure, NYHA functional class III or IV, with the exception of self-limited episodes of acute heart failure at the time of the acute ischemic event; (c) severe left ventricular systolic dysfunction (with ejection fraction ≤35%); (d) patients with restricted capacity to follow the protocol: those unable to follow the prescribed diet for whatever reason, due to personal or family circumstances; (e) risk factors which are severe or difficult to control (such as hypertension and diabetes, where there is organ involvement that limits their survival, chronic renal failure and disabling clinical manifestations of cerebral atherosclerosis); (f) chronic diseases unrelated to coronary risk; and (g) participants in other studies.
The subjects were randomized into two different dietary models (Mediterranean and low-fat diets) during a median follow-up of 7 years. Written consent was obtained from all the subjects before recruitment and the study protocol and all amendments were approved by the Ethics Committee of Hospital Reina Sofia, following the Helsinki Declaration and good clinical practices.
The present study (CORDIOPREV-DIRECT) included all the newly diagnosed T2DM patients who had not been receiving glucose-lowering treatment at the beginning of the study (190 out of 1002 patients). Of these, 7 patients were excluded due to their inability to perform the diagnostic test used in this work. T2DM remission was evaluated in the remaining 183 patients during the 5-year follow-up period. Moreover, 3 participants died during the follow-up period without achieving diabetes remission. The 183 newly diagnosed T2DM patients were classified as Responders, patients who reverted from T2DM during a median of 60 months of the dietary intervention without the use of diabetes medication (n = 73); or Non-Responders, who did not achieve diabetes remission at the end of the follow-up period (n = 110). T2DM remission was defined as glycosylated hemoglobin <6.5%, fasting plasma glucose <126 mg/dL and 2 h plasma glucose after an oral glucose tolerance (OGTT) test <200 mg/dL, for at least 2 consecutive years, and without the use of diabetes medication to lower blood glucose levels [16].
Diet, dietary assessment, and follow-up visits
The enrolled patients were randomized in two different dietary patterns with well-known metabolic health effects: a Med diet rich in fat from olive oil, with 35% of the calories from fat (22% monounsaturated, 6% polyunsaturated, <10% saturated), and a maximum of 50% carbohydrates and 15% protein; and the low-fat, high-complex carbohydrate diet (LFHCC) recommended by the National Cholesterol Education Program and the American Heart Association, comprising <30% total fat (<10% saturated fat, 12–14% MUFA fat, and 6–8% PUFA fat), 15% protein, and a minimum of 55% carbohydrates. The follow-up visits and dietary adherence in the CORDIOPREV study have been reported previously by Quintana-Navarro et al. [17]. During the study, dieticians administered personalized individual face-to-face interviews at inclusion and every 6 months (Food Frequency Questionnaire (FFQ), Mediterranean Diet Adherence Screener (MEDAS) [18] to assess Med diet adherence, or used a 9-item dietary screener for the low-fat diet to assess low-fat diet adherence [19], among other variables). Additionally, 2-h group sessions were held every 3–4 months to reinforce the dietary recommendations and to deliver the resource materials. Finally, a bimonthly telephone follow-up was conducted in order to monitor compliance with the assigned diet, negotiate nutrition goals, and reinforce the dietary recommendations. Full study diets, dietary assessments, and follow-up visits have been reported previously [15].
Biochemical measurements of metabolic parameters
Venous blood from the participants was collected in tubes containing Ethylenediaminetetraacetic acid (EDTA) as an anticoagulant after a 12-h overnight fast. Lipid variables (HDL-c, LDL-c, and triglycerides), glucose homeostasis variables (glucose, insulin, and glycosylated hemoglobin (HbA1c)), and inflammatory variables (hs-CRP) were determined, as previously reported [12].
Oral glucose tolerance test
The oral glucose tolerance test (OGTT) has been reported previously [12, 20]. In summary, patients underwent a standard Matsuda test at baseline and year-to-year during the follow-up period. After an overnight fast, blood was sampled from a vein before the oral glucose intake (0 min) and again after a 75 g flavored glucose load (75 g dextrose monohydrate in 250 mL water, NUTER. TEC GLUCOSA 50). Blood samples were taken at 30, 60, 90, and 120 min to determine glucose and insulin concentrations [21].
Isolation of circulating miRNAs from plasma samples
Venous blood from the 183 newly-diagnosed T2DM patients who had not been receiving glucose-lowering treatment at the beginning of the study was collected at baseline (day 0 before dietary intervention) in tubes containing EDTA, and centrifuged at 2000×g for 10 min to separate the plasma from the blood cells. RNA isolation was carried out from plasma samples, as previously described by Jimenez-Lucena et al. [12].
cDNA synthesis and circulating miRNAs levels using real-time PCR
The cDNA synthesis was carried out using the TaqMan MicroRNA Reverse Transcription Kit (Life Technologies—Thermofisher Scientific, Carlsbad, CA, USA), following the manufacturer’s instructions, as previously described in our group by Jimenez-Lucena et al. [12].
The circulating miRNAs study was carried out on 56 miRNAs, of which our group had previously studied 28 in a population of non-diabetic patients [12, 22]. The remaining 28 miRNAs were selected based on a bibliographic search according to their association with insulin sensitivity, insulin secretion, inflammation, and the growth and proliferation of beta-cells (Supplementary Table 1). We measured the levels of miRNAs at the baseline of the CORDIOPREV study using the OpenArray® platform (Life Technologies—Thermofisher Scientific, Carlsbad, CA, USA), following the manufacturer’s instructions. The relative expression data were analyzed using OpenArray® Real-Time qPCR Analysis Software (Life Technologies—Thermofisher Scientific, Carlsbad, CA, USA) and the normalization method has been described previously [16].
Statistics
The differences between Responders and Non-Responders in the study population baseline characteristics were assessed using One-way ANOVA analysis. To analyze the interaction between diet and groups, an analysis of the baseline characteristics of the participants was carried out using a univariate general linear model.
In addition, the 183 patients included in our study were classified according to the tertiles (T1 = low levels, T2 = intermediate levels and T3 = high levels) of circulating levels of 45 miRNAs and then COX regression analyses were performed for each miRNA separately for each diet, where T1 was considered as the reference. We also assessed the hazard ratio (HR) between T3 and T1, with 95% CI.
To evaluate the differences in circulating levels of miRNAs between Responders and Non-Responders according to the diet consumed by the patients, a One-Way ANOVA analysis was performed separately by diet. p Values < 0.05 were considered statistically significant. These analyses were performed using SPSS software (now PASW Statistic for Windows, version 21) (IBM, Chicago, IL, USA).
In addition, clinical variables (BMI, Age, HDL-c, triglycerides) and miRNA data were transformed (centering and scaling) using the preProcess function from the caret package through the free statistical software “R” version 3.6.1. This function uses two methods for the normalization and transformation of the variables included in the models. Thus, the method = “center” subtracts the mean of each variable from each absolute value of the variable, while the method = “scale” divides each value of the variable by its standard deviation. Next, ROC curve analyses were carried out in two steps, first through the glm (General lineal model) function, which is used to fit generalized linear models and gives a symbolic description of the linear predictor and a description of the error distribution [23]. Next, we performed the ROC curve using the pROC library. pROC is a tool for visualizing, smoothing, and comparing ROC curves. The AUC can be compared with a statistical test based on U statistics or bootstrap analysis. After the analysis, we evaluated the AUC, sensitivity, specificity, accuracy and threshold values for each model built. The most significant variables were identified by Pr(>|z|) values < 0.05, registered in the summary of each glm analysis.
T2DM scores based on miRNAs added to clinical variables
In the present study, based on miRNAs and clinical variables, T2DM remission scores were calculated with the aim of selecting a dietary model (Med or low-fat diets) that promotes disease remission. To this end, we calculated the score in three steps. First, we performed a glm analysis using the R software, including four miRNAs and six clinical variables, and we assessed the z value of each variable in the summary analysis separately for both the Med and low-fat diets (Supplementary Tables 2 and 3). Next, we multiplied the z value of each variable by the absolute values of the variables in all the patients included in the study. Third, the miRNAs and clinical variables were added together to obtain a single score per subject. To evaluate the probability of T2DM remission based on scores, the 183 patients included in our study were classified according to the tertiles of the T2DM remission score for both the Med and low-fat diets (T1, low score; T2, intermediate score; T3, high score). Using the SPSS software (now PASW Statistic for Windows, version 21) (IBM, Chicago, IL, USA), we performed a Cox regression analysis for each diet assessing the hazard ratio (HR), with T1 as the reference.
Optimal cut-off points for T2DM remission score by diet
To identify the cut-off points that allow us to select a dietary model that promotes remission using the scores, a ROC analysis was initially carried out. Next, we obtained the coordinates of the curve for each score (T2DM remission score for the low-fat diet and T2DM remission score for the Mediterranean diet). After that, the Youden index was calculated according to the equation (sensitivity + specificity) − 1 [24]. The Youden index was then plotted against the score values for both the Med and low-fat diets. We identified the maximum value of the Youden index with its respective score value, which was considered as the cut-off point.
Results
Baseline characteristics of patients according to the diet
The baseline characteristics of the study population have been previously published [16, 25]. In summary, patients who did not achieve diabetes remission at the end of the follow-up period (Non-Responders) showed higher weight, BMI, waist circumference, HbA1c, fasting glucose, insulin and HOMA-IR than patients who reverted from T2DM during a median of 60 months of dietary intervention (Responders) (Supplementary Table 4). According to diet, we observed significant differences between the two diets in relation to systolic blood pressure (p diet vs group = 0.007). No significant differences were observed in the diet vs group interaction in the other baseline characteristics (Table 1).
Cox regression analysis
Of the 56 miRNAs selected for the study, 9 did not amplify in at least 80% of the samples and 2 (hsa-miR-143 and hsa-miR-144) were used for data normalization, as previously described by our group [12, 22]. In order to test the potential relationship between miRNA levels and T2DM remission associated with the consumption of a specific diet, we performed a Cox regression analysis for each miRNA of the remaining 45 included in the panel. We found that low baseline plasma levels of miR-let7b-3p were associated with a higher probability of T2DM remission when the low-fat diet was consumed, but no association between miR-let7b-3p plasma levels and T2DM remission was found when patients consumed the Med diet.
In addition, high baseline plasma levels of miR-141-5p, miR-182, and miR-192 were linked to a higher probability of T2DM remission when the Med diet was consumed, while no association was observed when patients consumed the low-fat diet (Fig. 1) (Supplementary Table 5).

Data represent circulating levels for each miRNA by tertiles (low, intermediate and high plasma levels). The analysis was carried out using SPSS (now PASW Statistic for Windows (version 21.0)) (IBM. Chicago, Illinois) and adjusted by age, gender, BMI, TG, HDL-c and statin treatment.
Receiver operating characteristic curve analysis
To evaluate the potential of miRNAs plasma levels as a tool to select the most suitable dietary pattern for inducing T2DM remission, ROC curve analyses were performed separately by diet. A model was built including patients who followed a low-fat diet with the clinical parameters (age, gender, HDL-c, triglycerides, BMI and intensity of statins treatment), showing an AUC = 0.695 (95% CI = 0.592–0.798) (Fig. 2A), which increased to AUC = 0.767 (95% CI = 0.673-0.861) by adding the plasma levels of miR-let7b-3p (Fig. 2B) (Supplementary Table 6).
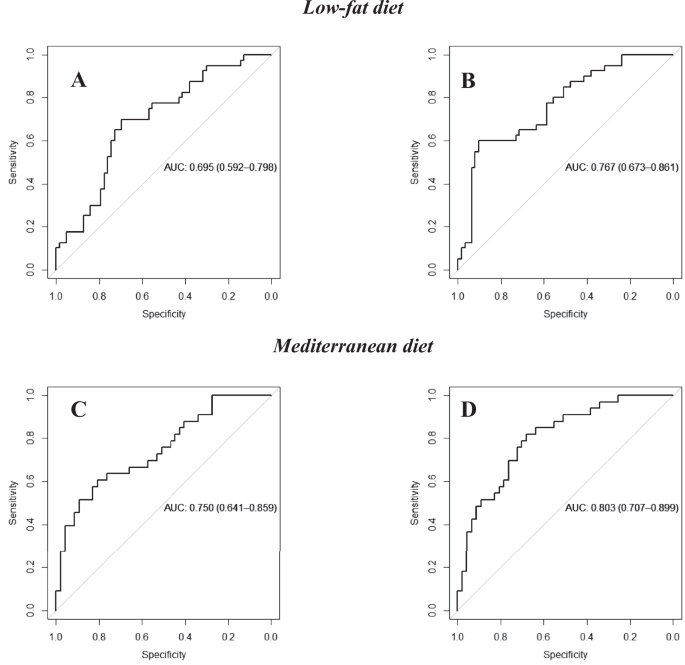
The upper panel shows the curves for patients following the low-fat diet and including A clinical parameters (age, gender, HDL-c, triglycerides, BMI and intensity of statin treatment and B clinical parameters added to miR-let7-3p. The lower panel shows the curves of the subjects who consumed the Mediterranean diet including C clinical parameters and D clinical parameters added to miR-141-5p, miR-182, miR-192. The ROC analysis was carried out using R software through the glm function (fitting generalized linear models) and pROC libraries.
In addition, a model built with the clinical parameters including patients who followed the Med diet showed an AUC = 0.750 (95% CI = 0.641–0.859) (Fig. 2C), which increased to an AUC = 0.803 (95% CI = 0.707–0.899) by adding the miRNAs miR-141-5p, miR-182, miR-192 to the clinical parameters (Fig. 2D) (Supplementary Table 6).
T2DM remission scores
A score built with the clinical parameters (age, gender, BMI, HDL-c, triglycerides, intensity of statin treatment) and miR-let7b-3p was associated with T2DM remission after the consumption of the low-fat diet. Thus, patients who consumed the low-fat diet were categorized by tertiles of the T2DM remission score and a COX regression analysis was performed using tertile 1 (T1) as the reference. We observed that patients with high scores showed a higher probability of T2DM remission when consuming the low-fat diet (HR low vs high = 3.90 (95% CI: 1.562–9.725)) (Fig. 3A). In contrast, no statistically significant associations were observed when this score was applied to patients who consumed the Med diet (Supplementary Fig. 1).
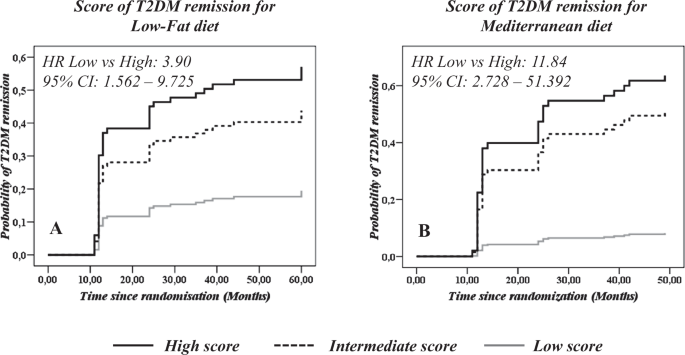
T2DM remission scores based on A Clinical variables (Age, gender, BMI, HDL-c, triglycerides, intensity of statin treatment and miR-let7b-3p in patients consuming a low-fat diet; and B Clinical variables added to miR-141-5p, miR-182 and miR-192 in patients consuming the Mediterranean diet. The analysis was performed using a Cox regression curve by tertile of T2DM remission score by each diet. A continuous black line indicates a high score (T3), a black dotted line indicates an intermediate score (T2), and a continuous gray line indicates a low score (T1). The analysis was carried out using SPSS (now PASW Statistics for Windows, version 21) (IBM, Chicago, IL, USA).
Furthermore, a score including the clinical parameters and miR-141-5p, miR-182 and miR-192 was associated by COX regression analysis to T2DM remission in the patients who consumed the Med diet. We observed that patients with high scores showed a higher probability of T2DM remission when consuming the Med diet (HR low vs high: 11.84 (95% CI: 2.728–51.392)) (Fig. 3B). In contrast, no statistically significant associations were observed when this score was applied to patients who consumed the low-fat diet (Supplementary Fig. 1).
Optimal cut-off points for T2DM remission scores
To identify the cut-off points for T2DM remission scores, we first calculated the Youden index for the ROC curves obtained with both the Med and low-fat scores. We then plotted the values of each score against the values of the Youden index, selecting the highest value of the index with the corresponding score value. Thus, the optimal cut-off point for the T2DM remission score was 4.22 for the low-fat diet, and −5.04 for the Med diet (Fig. 4).
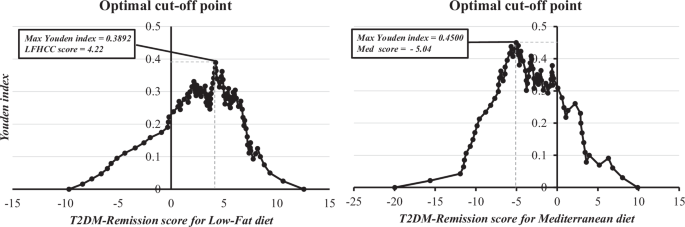
The analysis shows the maximum point for the Youden index ((sensitivity + specificity) − 1) extrapolated to the T2DM remission score. The analysis was performed after obtaining a ROC curve for each score and obtaining the coordinates of the curve using SPSS software (now PASW Statistic for Windows (version 21.0)) (IBM. Chicago, Illinois). LFHCC Low-fat high-complex carbohydrate.
Discussion
Our study suggests the potential of circulating levels of specific miRNAs for selecting a specific dietary pattern to achieve type 2 diabetes mellitus (T2DM) remission in patients with coronary heart disease. In the study, we showed that a low baseline plasma level of miR-let7b-3p was associated with T2DM remission when a low-fat diet was consumed. Conversely, high baseline plasma levels of miR-141-5p, miR-182, and miR-192 were associated with T2DM remission when consuming the Med diet.
The increasing incidence of obesity has led to an increase in the incidence of metabolic diseases such as T2DM, making it one of the leading causes of death in the world [26]. Moreover, subjects with a cardiovascular event and T2DM have a higher probability of a new event than those subjects without T2DM [5]. For this reason, efforts have been focused on achieving T2DM disease remission, which is defined as achieving normal glucose levels without pharmacological treatment [6]. However, to date, this goal has been achieved mainly with invasive methods such as bariatric surgery [27], physical activity [8], or dietary interventions focused on caloric restriction [9, 10].
In line with this, diabetes remission can also be achieved by the consumption of healthy dietary models such as the Mediterranean diet or the low-fat diet [28, 29]. However, given the genetic and epigenetic differences of the population, these dietary models should not be generalized to the whole population and it is important to identify markers to select the dietary model which the patient will benefit most from in order to achieve T2DM remission [30, 31].
Currently, miRNAs are recognized as important regulators of gene expression and central players in the control of several biological and pathological processes associated with diseases such as T2DM [32]. Additionally, previous studies have demonstrated the association between the dietary components, such as polyphenols, micronutrients, macronutrients, phytochemicals and the expression of miRNAs [33]. Other studies have demonstrated differences in miRNA levels at different timepoints after bariatric surgery. Indeed, a meta-analysis identified previous studies in humans with post-surgery times ranging from 3 to 24 months, in which deregulation of miRNA diversity was demonstrated [34], suggesting a dynamic change between diabetes remission and miRNA plasma levels.
In our study, we explored the capacity of miRNAs to predict diabetes remission according to the diet consumed by analyzing baseline plasma levels. We found that ROC curve analyses showed an AUC = 0.767 when miR-let7b-3p are added to the clinical parameters for the low-fat diet, whereas an AUC = 0.803 was observed after the addition of miR-141-5p, miR-182, miR-192 to the clinical parameters for the Med diet.
Previous studies have demonstrated the differential expression of miR-let7b-5p among healthy people, subjects with T2DM, and T2DM and diabetic retinopathy [35]. It has also been demonstrated in animal models that miR-let-7b-5p not only upregulated the mt-Cytb gene in mitochondria, but also downregulated insulin receptor substrate 1 in cytosol in db/db mice [36]. However, few studies have addressed the mechanistic role of miR-let7b-3p in the development or remission of T2DM. In relation to miR-141-5p, a previous study showed that elevated levels of this miRNA were associated with increased beta-cell apoptosis [37]. In turn, previous studies in animal models showed that miR-182 participates in glucose homeostasis by regulating the FOXO1 and PDK4 genes, decreasing blood glucose levels [38]. Finally, miR-192 has been reported as being upregulated in diabetic patients and patients with diabetic nephropathy [39]. However, the overall information about gene expression and/or modulation by diet of these miRNAs is scarce, and even more so in the context of T2DM. In addition, future studies are needed to investigate the interaction of dietary components and gene expression, which may determine the effect of a specific diet on T2DM remission, or on global health.
Furthermore, several scores have been developed to predict T2DM development, including the PREDIMED-Clinical score (in patients with high cardiovascular disease) [40], the discrimination of Finnish Diabetes Risk Score (FINDRISC) [41], and the German Diabetes Risk Score (GDRS) [42], in addition to the DiaREM score for T2DM remission [43]. However, such scores do not evaluate remission or help to select the most suitable diet to prevent diabetes development. A previous study performed by our group demonstrated that miRNAs could be used to select the most suitable dietary pattern to prevent T2DM development [13]. This previous study focused exclusively on the non-T2DM patients at the beginning of the CORDIOPREV study, of whom some developed T2DM during the follow-up period. In other words, we studied T2DM incidence, but we did not build an epigenetic score based on miRNAs and clinical variables as we have done in the current work for T2DM remission.
Along these lines, in another study, we demonstrated the use of a clinical-epigenetic score to predict disease remission [16]. In the current work, we have demonstrated that miRNA plasma levels could be used to predict the most suitable diet to induce T2DM remission by building specific clinical-epigenetic scores for the low-fat and a Med diet.
Our study proposes, for the first time, the use of diet-specific clinic-epigenetic scores (Low-Fat score and Med score) to select the dietary pattern that patients with CHD and T2DM should follow to achieve T2DM remission more efficiently. Nevertheless, our study has some limitations; firstly, we conducted a targeted study on 28 miRNAs with previously published knowledge, which means that other miRNAs that might be of interest but are not published were not included. Secondly, our study was conducted in patients with cardiovascular disease, which limits the extrapolation of the results to a healthy population.
In conclusion, our results indicate that miRNAs could be applied as a clinical tool to select the most efficient nutritional therapy (Mediterranean or low-fat diet) to achieve T2DM remission in patients with coronary heart disease.


Responses