Abnormal changes of brain function and structure in patients with T2DM-related cognitive impairment: a neuroimaging meta-analysis and an independent validation

Introduction
Type 2 diabetes mellitus (T2DM) is a chronic metabolic disease, and its incidence rate is increasing year by year. Cognitive impairment (mainly manifested as decreased memory, attention, executive function, or information processing speed) is considered a common complication of T2DM1, which seriously affects the quality of life of patients. Compared to healthy people, patients with T2DM had a 150% increased risk of cognitive impairment2. Therefore, it was necessary to evaluate T2DM-related cognitive impairment (T2DM-CI) and provided theoretical basis for effective intervention to delay disease progression. Neuroimaging is one of the most important techniques for exploring the brain changes of T2DM-CI. Functional and structural indicators in neuroimaging research, reflect abnormal changes in brain activity and the gray matter level of the brain caused by T2DM. Therefore, we needed to determine brain regions of patients with T2DM-CI where functional and structural indicators changed together or could not synchronize.
Functional magnetic resonance imaging is a non-invasive imaging technique for measuring blood oxygen level dependent neuronal activity, widely used in the fields of neuroscience and cognitive science3. Various functional indicators such as amplitude of low-frequency fluctuation (ALFF), regional homogeneity (ReHo), and degree centrality (DC) were used to explore the spontaneous changes in brain activity in T2DM-CI patients. ALFF is obtained by calculating the maximum fluctuation of the low-frequency hemodynamic response function (HRF) for each voxel, which is related to the intensity of local neural activity and can directly characterize the spontaneous brain activity of each voxel4. The greater the fluctuation, the more likely it is to be the result of the stronger neural activity. ReHo uses Kendall’s harmony coefficient to measure the time series consistency between the target voxel and its neighboring voxels5. It can reflect the local characteristics of spontaneous brain functional activity, and any abnormal decrease or increase in its value reflects the synchronization or coordination of local brain functional activity, which may be the main underlying cause of cognitive dysfunction in patients6. DC is usually obtained by extracting the time series of one voxel and associating it with the time series of all other voxels in the brain, and then calculating the sum of the correlation coefficients obtained. The higher DC typically indicates more correlation between the voxel and all other voxels, suggesting that neurons within the voxel are more active4.
And previous studies showed that patients with T2DM-CI had significantly decreased ALFF and ReHo values in the occipital lobe and postcentral gyrus7. Besides, it was reported that patients with T2DM-CI had significantly decreased ALFF values in the bilateral middle temporal gyrus, left fusiform gyrus, left middle occipital gyrus, right inferior occipital gyrus; and increased ALFF values in both the bilateral cerebellum posterior lobe and right cerebellum culmen8. In addition, another study found that patients with T2DM-CI had increased DC values in the left superior temporal gyrus, left Heschl gyrus, and left hippocampus9. These studies suggested that T2DM-CI had aberrant spontaneous brain activity.
White matter and gray matter are both indicators of brain structure10,11, and in this meta-analysis, we explored gray matter (GM) which is more associated with neuronal activities. It was reported that patients with T2DM-CI exhibited GM reductions in the left orbital superior, middle, and inferior frontal gyri as well as the right superior frontal gyrus9. In addition, another study found that patients with T2DM-CI had cortical/subcortical GM atrophy in thalamus, putamen, and hippocampus compared to healthy controls (HCs)12. Furthermore, compared to HCs, the patients with T2DM-CI showed reduced GM in the limbic system (i.e., the hippocampus, parahippocampal gyrus, amygdala and uncus)13. In short, studies above demonstrated that the GM abnormalities played a crucial role in the process of T2DM-CI.
Whether the indicators of functional or structural imaging, the results of individual studies were partially consistent and partially inconsistent. Therefore, we conducted a meta-analysis by combining functional and structural indicators to see if the brain regions were overlap with each other. Although previous meta-analyses have explored functional and structural changes in T2DM14, there was still a lack of significant and consistent results in T2DM-CI. Therefore, it was necessary to conduct a meta-analysis of brain functional and structural changes in T2DM-CI patients. In this study, we aimed to collect studies on changes of ALFF, ReHo, DC or GM between T2DM-CI and HCs, and explored brain regions of characteristic change that could provide targets for early detection and intervention of disease. Finally, we conducted validation using our own dataset to validate the results of the meta-analysis.
Materials and methods
Meta-analysis
Protocol and guidance
This neuroimaging meta-analysis followed the standards of PRISMA15(See Supplementary Table 1). The protocol was registered on PROSPERO(CRD42023448917) (https://www.crd.york.ac.uk/prospero/). All works were completed independently by two reviewers (PD and YY), any controversial questions were discussed and resolved with the third reviewer (LFY).
Systemic search and study strategy
The systemic study was searched in databases including PubMed, Web of Science, MEDLINE (void), Cochrane Library from 1 January 2007 to 26 May 2023, which used the keywords as follows: (“Diabetes Mellitus, Type 2” OR “Type 2 Diabetes” OR “NIDDM” OR “T2DM” “Diabetes Mellitus, Type II”) AND (“Cognitive Dysfunction” OR “Cognitive Impairment” OR “Cognitive Decline” OR “Cognitive Disorder” OR “cognitive dissonance” OR “Mild Cognitive Impairment” OR “MCI”) AND (“functional neuroimaging” OR “functional magnetic resonance imaging” OR “fMRI” OR “Functional Brain Imaging” OR “resting state” OR “amplitude of low frequency fluctuation” OR “ALFF” OR “fractional amplitude of low frequency fluctuation” OR “fALFF” OR “regional homogeneity” OR “ReHo” OR “DC” OR “degree centrality”); (“Diabetes Mellitus, Type 2” OR “Type 2 Diabetes” OR “NIDDM” OR “T2DM” “Diabetes Mellitus, Type II”) AND (“Cognitive Dysfunction” OR “Cognitive Impairment” OR “Cognitive Decline” OR “Cognitive Disorder” OR “cognitive dissonance” OR “Mild Cognitive Impairment” OR “MCI”) AND (“cerebral cortex” OR “gray matter” OR “VBM” OR “voxel-based morphometry” OR “thickness” OR “cortical thickness” OR “thinning” OR “cortical thinning”)14,16,17. The detailed search strategies were shown in Supplementary Table 2.
Inclusion criteria (1) original research; (2) study between T2DM-CI and HCs; (3) observational studies using a voxel-based analysis to calculate ALFF, ReHo, DC, or GM changes in the whole brain; (4) research included both male and female adults; (5) the peak coordinates were clearly reported in stereotactic three-dimensional coordinates (Talairach, TAL or Montreal Neurological Institute, MNI); (6) t-values, z-values, or p-values could be extracted; (7) studies using the t-test of two independent samples; (8) cognitive assessments were performed in all subjects, and T2DM had lower cognitive scores than HCs.
Exclusion criteria: (1) not original studies; (2) lack of HCs; (3) research on other functional indicators or white matter, as well as task states fMRI; (4) single gender; (5) not adult; (6) T2DM with severe complications; (7) regions-of-interest (ROI) studies; (8) animal studies; (9) no coordinates and the study quality score (QS) < 17; (10) intervention study; (11) data duplication; (12) lack of cognitive assessment.
Quality assessment, data extraction, and conversion
The quality of total 19 studies (12 functional indicator studies and 7 GM indicator studies) included was assessed by 20-point checklists, and those with a total score below 17 points was excluded18. A detailed list of quality assessments could be found in Supplementary Table 3.
General information (researchers, sex (male/female), cognitive scales, age, education years, duration of T2DM, HbA1c, BMI, Field strength, and coordinate space) for all studies were showed in Table 1. The detailed cognitive scores were showed in Supplementary Table 4. The peak coordinates and t-values of ALFF, ReHo, DC or GM abnormality between T2DM-CI and HCs were extracted for meta-analysis. If there was no t-value in the article, we would use the SDM website (https://www.sdmproject.com/) to convert the p-value or z-value into t-value.
Voxel-based meta-analysis by AES-SDM
First, we extracted coordinate information and effect values (t-value) from each dataset and prepared the text files according to the correct naming method. Next, we created the SDM table. Finally, we strictly followed the standard steps of the anisotropic effect size-signed differential mapping (AES-SDM) 5.15 software (http://www.sdmproject.com/) for meta-analysis, which could be briefly described as follows:(1) global analysis; (2) preprocessing; (3) mean analysis; (4) threshold analysis; (5) create mask and extract mask. The meta-analyses of ALFF, ReHo, DC and GM were respectively performed in the “Functional MRI or PET” and “VBM-gray matter” templates of AES-SDM software17. The parameters used in this study were anisotropy = 1, isotropic full width at half maximum (FWHM) = 20 mm, probability = 0.0005, peak height threshold = 1, extent threshold = 10 voxels and 100-randomization test17,19. All significant results were visualized by MRIcroGL software between T2DM-CI and HCs20.
Heterogeneity and publication bias assessment
After analyzing the main results using AES-SDM, we extracted the coordinates of the main results using Seed-based d-Mapping-Permutation of Subject Images (PSI-SDM version 6.21), and then calculated the mean and standard deviation respectively17. Next, we would use Stata/SE 16.0 software to analyze heterogeneity17. Finally, the publication bias was evaluated using the default Egger test of SDM and visualized using a funnel plot16,17,21.
Jackknife sensitivity analysis
To evaluate the reliability and stability of the main results, we conducted a jackknife sensitivity analysis by AES-SDM22. After preprocessing, we conducted sensitivity analysis in the main analysis by excluding one study at a time18. If the main outcome existed in all or most studies, it could be considered stable and significant18.
Meta-regression analysis
To explore the impact of potential risk factors including age, percentage of female patients, BMI, education, T2DM duration, HbA1c, and MMSE/MoCA score on function/GM abnormalities in T2DM-CI, a meta-regression in linear model of AES-SDM was performed14. Statistical significance was determined to use a stringent threshold of FWHM = 20 mm, p < 0.0005, cluster-corrected, peak height Z > 1, and cluster >10 voxels in meta-regression analysis14. Meta-regression analysis could exclude findings beyond the brain regions detected in the main analysis.
Validation study
To verify the results of meta-analysis, the brain regions with significant differences obtained from meta-analysis were saved as masks and then validated in our independent data23.
Participants
Prospective collection of 43 T2DM patients with MCI diagnosed at Tangdu Hospital of Air Force Military Medical University from September 2016 to December 2023, including 27 males and 16 females, aged 35–67 years, with an average age of (54.23 ± 9.31) years. During the same period, 42 healthy volunteers matched in gender, age, BMI, and education level were included as a healthy control (HC) group, including 24 males and 18 females, aged 45–69 years, with an average age of (52.21 ± 5.35) years (Supplementary Table 5). Inclusion criteria of T2DM-CI group: ① According to the 2013 version of Guidelines for the Prevention and Treatment of Type 2 diabetes in China as diagnostic criteria for diagnosing T2DM; ② Age 18–70 years old; ③ Right-handed; ④ 2324. Inclusion criteria for HC group: ①Does not comply with the 2013 version of Guidelines for the Prevention and Treatment of Type 2 diabetes in China for diagnosing T2DM; ② Age 18–70 years old; ③ Right-handed; ④ MMSE score≥27 and MoCA score≥26 points. This study was approved by the Hospital Medical Ethics Committee (NCT02420470), and all study subjects signed a written informed consent form.
Statistical analysis
We saved the brain regions with differences in meta-analysis as masks, and then used the two-sample t-test to analyze whether there were differences in functional indicators (ALFF, ReHo, and DC) and structural indicator (VBM) of T2DM-CI and HCs on the mask. P < 0.05 was considered statistically significant.
Results
Meta-analysis
Systemic search information and general characteristics of included studies
Firstly, we searched from four databases by using theme words and keywords, and ultimately identified 685 articles in GM and 462 articles in function. Secondly, the 235 results of GM datasets and 224 results of function datasets were further removed because of duplication. Finally, 408 articles of GM datasets and 207 articles of function datasets were excluded by reading the title and abstract. In the end, total 19 studies (20 datasets) meeting the inclusion criteria were included in this study, which consisted of 7 GM datasets including 6 gray matter volume (GMV)9,13,25,26,27,28 and 1 cerebral cortical thickness12 and 13 function datasets including 5 ALFF7,8,29,30,31, 4 ReHo7,32,33,34 and 4 DC9,35,36,37. The detailed search flow diagram was showed in Fig. 1.

The systemic searches were separately performed on function (a) and GM studies (b).
Detailed general information of function and GM datasets are shown in Table 1. By merging clinical data, on one hand, we found statistical differences in gender (x2 = 5.655, P = 0.017), age (standardized mean difference [SDM] = 0.21, 95% confidence interval [CI] = [0.07, 0.36], Z = 2.83, P = 0.005) and BMI (SDM = 0.21, CI = [0.04, 0.38], Z = 2.37, P = 0.02) between the T2DM-CI and HCs groups in the functional group, there was no difference in the education level (SDM = −0.07, CI = [−0.22, 0.09], Z = 0.88, P = 0.38). On the other hand, we found significant difference in BMI (SDM = 1.16, CI = [0.53, 1.79], Z = 3.61, P = 0.0003) between the T2DM-CI and HCs groups in the GM group, there were no difference in the gender (x2 = 3.072, P = 0.08), age (SDM = 0.12, CI = [−0.52, 0.76], Z = 0.37, P = 0.71) and education level (SDM = −0.44, CI = [−0.93, 0.05], Z = 1.75, P = 0.08).
Brain activity abnormality between T2DM-CI and HCs
According to the main analysis, patients with T2DM-CI showed the brain activity of the left anterior cingulate / paracingulate gyri (ACC. L) (BA24, MNI: −2, 30, 26; SDM-Z = 2.673, P < 0.0000) increased significantly, while the brain activity of the left lingual gyrus (LING. L) (BA18, MNI: −10, −68, −4; SDM-Z = −2.066, P < 0.0005) decreased significantly compared to HCs (Table 2, Fig. 2). AES-SDM software used Q test to assess heterogeneity in main results, but the results are inconsistent. Thus, we used Stata software to evaluate its heterogeneity. The results showed significant heterogeneity (SDM = 0.22, 95% CI = [0.11, 0.34], I2 = 99.7%) in ACC.L and LING.L (SDM = −0.25, 95% CI = [−0.32, −0.18], I2 = 99.2%). The forest plot was given in Supplementary Fig. 1. Jackknife analysis showed 13 of 13 times in ACC. L and 9 of 13 times in LING. L (Supplementary Table 6). Egger’s test showed no publication bias in ACC.L and LING.L (P > 0.05) (Supplementary Fig. 3).
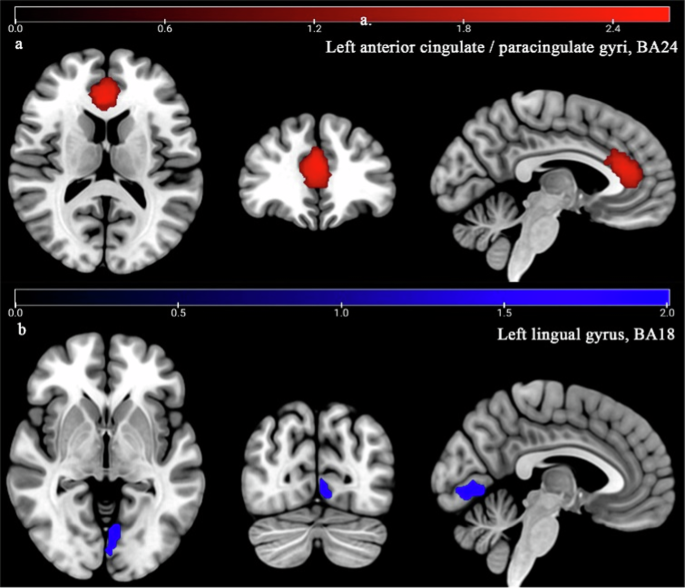
Patients with T2DM-CI showed significant increased brain activity (Red) in left anterior cingulate/paracingulate gyri (ACC.L, BA 24) (a) compared to HCs (P < 0.0005), while significant decreased brain activity (Blue) in left lingual gyrus (LING.L, BA18) (b).
GM abnormality between T2DM-CI and HCs
According to the main analysis, patients with T2DM-CI showed the significant GM reduction in the right superior temporal gyrus (STG. R) (BA42, MNI: 58, −22, 12; SDM-Z = −2.153, P < 0.0001) and left inferior occipital gyrus (IOG. L) (BA19, MNI: −38, −82, −4; SDM-Z = -2.027, P < 0.0005) compared to HCs (Table 2, Fig. 3). AES-SDM software used Q test to assess heterogeneity in main results, but the results are inconsistent. Thus, we used Stata software to evaluate its heterogeneity. The results showed that there was significant heterogeneity (SDM = −0.48, 95% CI = [−0.86, −0.09], I2 = 99.9%) in IOG.L and STG.R (SDM = −0.30, 95% CI = [−0.43, −0.17], I2 = 99.6%). The forest plot was given in Supplementary Fig. 2. Jackknife analysis showed 4 of 7 times in STG. R and 4 of 7 times in IOG. L (Supplementary Table 6). Egger’s test showed no publication bias in STG.R and IOG.L (P > 0.05) (Supplementary Fig. 4).
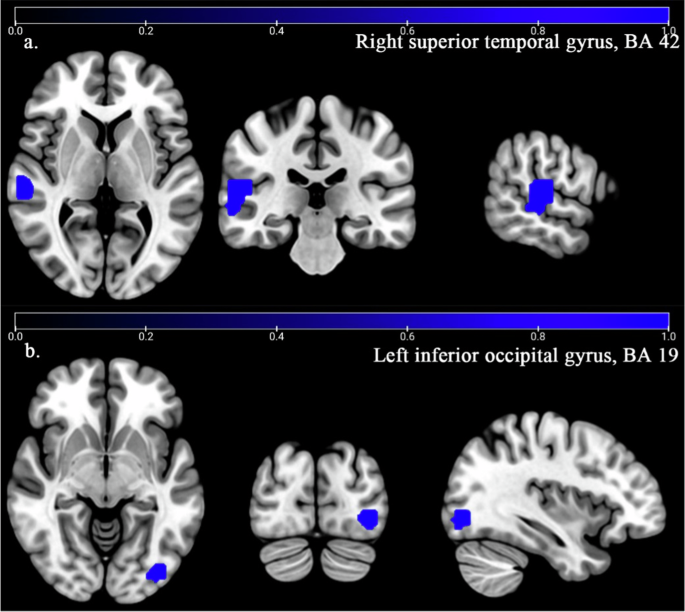
Patients with T2DM-CI showed significant decreased GM (Blue) in right superior temporal gyrus (STG.R, BA42) (a) and left inferior occipital gyrus (IOG.L, BA 19) (b) compared to HCs (P < 0.0005). No increased GM was found in T2DM-CI compared to HCs (P = 0.0005).
Meta-regression analysis
The meta-regression analysis showed that age, BMI, education level, HbA1c, MMSE and MoCA had no significant effect on the main results of function group and GM group, while the brain activity reduction in LING. L was negatively related with the percentage of female patients (Table 3, Fig. 4), the GM reduction in IOG.L was negatively related with T2DM duration (Table 3, Fig. 5).
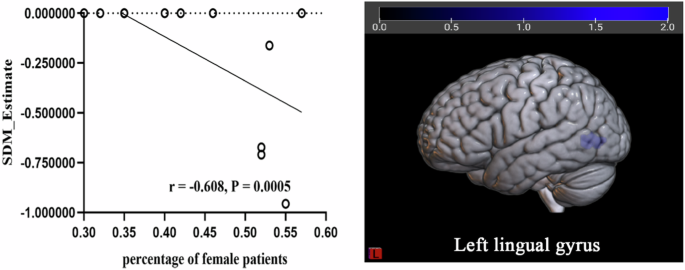
According to the meta-regression, the percentage of female patients was negatively related with the decreased brain activity in LING.L (r = −0.608, P < 0.0005).
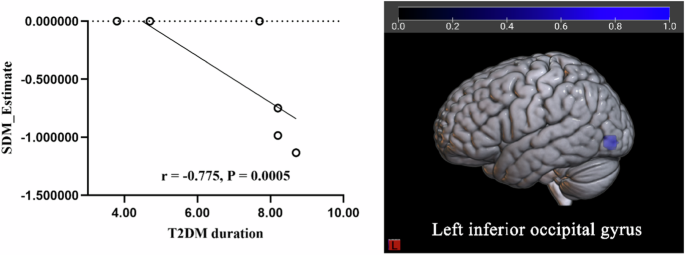
According to the meta-regression, the T2DM duration was negatively related with the decreased GM in IOG.L (r = −0.775, P < 0.0005).
Validation
In the functional indicator group, we found that there was only intergroup difference in LING.L between T2DM-CI and HCs on ReHo, while there were no intergroup differences in ALFF and DC. There were no intergroup differences in ACC.L between T2DM-CI and HCs on ALFF, ReHo, and DC (Supplementary Table 7).
In the structural indicator group, we found that there were no intergroup differences in STG. R and IOG. L between T2DM-CI and HCs on VBM (Supplementary Table 8).
Discussion
The brain activity and GM abnormalities in patients with T2DM-CI were first to be explored in the meta-analysis. The ALFF, ReHo and DC changes between T2DM-CI and HCs were combined to explore the specific brain regions involved in functional alterations of brain activity. The GMV and cortical thickness changes between T2DM-CI and HCs were combined to explore the specific brain regions of GM alterations. Main analysis showed that the brain activity in the left anterior cingulate/paracingulate gyri (BA24) of T2DM-CI patients increased significantly, the brain activity of the left lingual gyrus (BA18) of T2DM-CI patients decreased significantly, and the GM changes in the right superior in temporal gyrus (BA42) and left inferior occipital gyrus (BA19) of T2DM-CI patients decreased significantly. Jackknife sensitivity analysis showed that these peak coordinates are relatively stable and highly repetitive.
According to our main results, the abnormal brain function within specific brain regions of T2DM-CI patients was consistent with previous systematic reviews and meta-analysis studies on brain function changes caused by T2DM. For example, previous meta-analysis reported that the brain activity of T2DM patients significantly decreased in the bilateral lingual gyrus (LING), left postcentral gyrus, right inferior temporal gyrus, right cerebellar culmen, right insula and right posterior cingulate cortex38. In addition, another meta-analysis reported that patients with T2DM showed hypoactivity in the right medial superior frontal gyrus, right superior temporal gyrus, and left lingual gyrus (LING)39. Furthermore, a recent meta-analysis showed that T2DM patients had decreased brain activity in the right insula, bilateral lingual gyrus (LING), left supramarginal gyrus and left calcarine fissure and surrounding cortex14. Similarly, our meta-analysis and validation analysis found that the patients with T2DM-CI had the significant reduced brain activity in LING.L compared to HCs. All in all, the decrease in brain activity of LING.L was robust in both T2DM and T2DM-CI. It was reported that LING is the important component of the visual cortex, responsible for visual memory and vision processing40. Previous animal experiments showed that visual impairment in T2DM rats occurred before cognition41,42. In addition, other studies also found that the patients with T2DM-CI were more likely to suffer from visual impairment such as decreased vision and retinopathy43,44. Therefore, visual impairment may be an early manifestation of T2DM-CI. Furthermore, we also found that patients with T2DM-CI had the significant decreased GM in STG.R compared to HCs, which was consistent with the results of previous meta-analysis studies. For example, previous meta-analysis reported that T2DM patients had significant decreased GM in the STG.R14. Meanwhile, the other meta-analyses showed that T2DM patients had reduced GM in the bilateral STG or STG.L compared to HCs45,46. Recently, our research team conducted a meta-analysis and found that T2DM-CI patients showed a significant and sustained decrease in GM in the STG.L compared to HCs16. Similarly, in this meta-analysis, we also found the patients of T2DM-CI showed a significant reduction of GM in the STG.R. In a word, these meta-analysis studies indicated that the decrease in GM of STG was robust in both T2DM and T2DM-CI. However, our validation analysis showed there was no intergroup difference in GMV between T2DM-CI and HCs in STG. R. This may be because our sample size was small and we only analyzed the GMV, which was different from the GM indicator literature included in previous meta-analysis. It was reported that STG was critical for extracting meaningful linguistic features from speech input47,48. Previous studies also showed that decreased GM in STG was associated with CI in patients with T2DM and multiple sclerosis13,49. Therefore, the decreased GM in STG may be a specific biomarker for T2DM switch into T2DM-CI.
In addition to the robust results in both T2DM and T2DM-CI, we also found that the brain activity of T2DM-CI was significantly enhanced in ACC.L, while decreased GM in IOG.L. The anterior cingulate cortex is an important brain region involved in various functions such as attention, emotion, and cognition50,51. It was reported that the inferior occipital gyrus (IOG) is located in the occipital lobe, which related to the transmission of visual information, responsible for transmitting analysis and processing information to other brain regions52. Therefore, the functions of LING and IOG were consistent. That is to say, the brain function and structure parts of T2DM-CI patients were coupled. However, T2DM-CI patients showed a significant decrease in GM in the STG.R, while no decrease in brain activity was observed in the STG.R. Therefore, we could conclude that functional and structural abnormities within different brain regions synergistically regulate the visual impairment of T2DM-CI.
In addition, these brain regions are unique to patients with T2DM cognitive impairment and are inconsistent with the cognitive impairment caused by caused by other forms, such as obesity and hypertension. Obesity and hypertension are closely related to T2DM. They are important risk factors for T2DM, and T2DM will in turn increase the risk of hypertension. Therefore, we will separately elaborate on the brain regions associated with cognitive impairment caused by obesity and hypertension, further confirming that the brain regions obtained in this meta-analysis are unique to T2DM-related cognitive impairment. For example, study found that specific areas of the brain damaged by hypertension, including the putamen, anterior thalamic radiation, anterior coronal radiation, and anterior limb of the internal capsule, can lead to cognitive decline53. Among them, the putamen is responsible for regulating movement and influencing various types of learning54; anterior thalamic radiation involves executive functions, such as planning simple and complex daily tasks55; anterior coronal radiation and anterior limb of the internal capsule involve decision-making and emotional management53. There was also study indicating that obesity damaged memory related brain regions, leading to a decline in memory56. In addition, increasing evidence emphasizes cognitive impairments related to obesity, including decision-making57, inhibitory control58, learning/memory59, and attention impairment60. Therefore, it further confirmed that visual related brain regions were specific brain regions associated with T2DM related cognitive impairment.
However, this study had high heterogeneity. Studies showed that when analyzing T2DM-CI, we should consider the comprehensive background of the underlying processes and their impact on the results61,62, such as population characteristics, disease characteristics, cognitive assessment tools, and MRI protocols. We should have conducted subgroup analysis to determine whether data processing methods affect changes in brain function and structure, but due to limited literature, we were unable to do so. Therefore, we only conducted a meta-regression analysis on the population characteristics (age, gender, BMI, and education level), disease characteristics (T2DM duration and HbA1c) and common cognitive assessment tools (MoCA, MMSE). It is showed that age, BMI, education level, HbA1c, MMSE and MoCA had no significant effect on the main results of function and GM changes, while percentage of female patients and T2DM duration might play an effect on functional or structural alterations in T2DM-CI. But some rare cognitive assessment tools, disease features (disease control and patient treatment variability), and MRI protocols could not be corrected due to lack of adequate data. Therefore, we speculated that gender, T2DM duration, disease control and patient treatment variability, rare cognitive assessment tools and MRI protocols were the main cause of heterogeneity in our meta-analysis.
Our study also had some limitations as follows: Firstly, we only searched four databases, which may result in incomplete literature retrieval; secondly, the definition of T2DM-CI is relatively broad, but even so, the retrieved datasets are still quite limited; thirdly, we only studied partial indicators in brain activity, which may make the results less universal; fourthly, we conducted a unified analysis of GMV and cortical thickness due to limited literature, which could lead to a certain degree of heterogeneity; fifthly, although we speculated that heterogeneity in the meta-analysis might be due to some rare cognitive assessment tools, disease control, patient treatment variability and MRI protocols, there were insufficient datas to calibrate the results with them as covariates; sixthly, we only validated some of the results in our validation study, which may be due to the small sample size of the strict definition of T2DM-CI. A small sample size in brain imaging research will lead to non reproducible associations. When the sample size reaches several thousand people, the repeatability begins to increase. In the future, we will expand the sample size to further validate the reliability of the results.
In conclusion, the decrease of brain activity in LING.L and the decrease of GM in IOG.L were closely related to visual impairment in T2DM-CI patients. Functional and structural abnormalities within different brain regions synergistically may regulate the visual impairment of T2DM-CI. In the future, we need to closely monitor the visual changes of T2DM patients. Early intervention for visual impairment in T2DM patients can delay its further development into cognitive impairment, improve their quality of life and clinical management ability. It also provides early biomarkers for elucidating the mechanism of cognitive impairment in T2DM.


Responses