Tumor cell-derived ISG15 promotes fibroblast recruitment in oral squamous cell carcinoma via CD11a-dependent glycolytic reprogramming

Introduction
Carcinogenesis is a multistep process influenced not only by intrinsic properties of cancer cells but also by the host stroma or tumor microenvironment (TME) [1]. Cell interactions within the TME, involving fibroblasts, immune cells, endothelial cells, various secreted growth factors/chemokines, as well as extracellular matrix proteins, are increasingly recognized as important in cancer progression and metastasis [2]. Fibroblasts, a significant proportion of the stromal compartment, can develop an activated cancer-associated fibroblast (CAF) phenotype in many solid tumors. CAFs have been shown to play a pro-tumor role in breast, prostate, and oral cancers [3, 4]. CAFs are a prominent feature of the tumor stroma of oral squamous cell carcinomas (OSCCs), a subtype of head and neck squamous cell carcinoma (HNSCC), and are associated with resistance to immunotherapy and poor disease-free survival [5,6,7]. CAFs have been shown, through in vitro cell culture studies and in vivo animal studies, to play a role in tumor progression in OSCC [8, 9]. The discovery of the mechanism by which fibroblasts are recruited into cancer stroma could lead to new insights into both mechanisms of cancer progression and cancer treatment strategies.
CAFs include pre-existing resident fibroblasts and stellate cells that become CAFs through activation, epithelial cells via epithelial-to-mesenchymal transition, endothelial cells via endothelial-to-mesenchymal transition, mesenchymal stem cells and circulating fibrocytes via recruitment, and pericytes, smooth muscle cells, and adipocytes via transdifferentiation [10]. Normal resident tissue fibroblasts can be recruited and activated to become CAFs. This activation is highly dependent on TME stimulation, including through oxidative stress, local hypoxia, and growth factors secreted from surrounding tumor cells and infiltrating immune cells [11, 12]. Tumor-derived cytokines, such as transforming growth factor-β (TGF-β) and interleukin-1 (IL-1), can educate and activate resident normal fibroblasts to become phenotypically and functionally indistinct from CAFs [13, 14].
Similar to cancer cells, CAFs can undergo metabolic reprogramming in response to hypoxia and adjacent cancer cells [15]. The role of CAFs in metabolism has recently been described as the reverse Warburg effect. According to this model, tumor cells within the microenvironment activate and control fibroblasts by taking advantage of their metabolism. This phenomenon appears to involve a decrease in mitochondrial function in CAFs, followed by an increase in glycolysis. This metabolic shift results in the release of highly energetic metabolic substrates into the microenvironment, which tumor cells use via increased oxidative phosphorylation (OXPHOS) [16, 17]. The mechanisms through which tumor cells modulate metabolic reprograming in CAFs are not well-characterized.
Interferon stimulated gene 15 (ISG15), a ubiquitin-like protein, has emerged as a promising and novel oncoprotein biomarker that is elevated in a variety of cancers [18,19,20]. Extensive in vitro and in vivo studies have provided evidence supporting the multifaceted roles of free ISG15 in various cellular processes, including cancer defense, viral infection response, and immune cell activation, particularly in M2 polarization, lymphocytes, monocytes, and natural killer (NK) cells [21,22,23]. ISG15 is also secreted into the extracellular environment and has been shown to induce an antitumor immune response in breast and pancreatic cancer patients [21, 24]. Extracellular ISG15 binds to the lymphocyte function-associated antigen-1 (LFA-1) integrin receptor on NK and T cells to increase interferon type II production, which is required for mycobacterial immunity [25]. We previously found ectopic expression of ISG15 did not alter the proliferation of OSCC cells in vitro [20]; however, it significantly enhanced tumor growth in vivo. This observation suggests a critical interplay between ISG15-expressing OSCC cells and the surrounding stromal microenvironment. While ISG15 is known to influence immune cell behavior, its potential role in fibroblast recruitment and activation remains largely unexplored. Using cell-based in vitro and in vivo analyses in this study, we established a functional link between tumor cell-derived ISG15 and fibroblasts. Furthermore, we determined that ISG15 enhances fibroblast migration and recruitment in OSCC tissues through a CD11a-dependent glycolysis reprogramming.
Results
Increased expression of collagen and α-SMA in ISG15-expressing tumors
We previously found increased ISG15 expression in OSCC tissues [20] and subsequently used OEC-M1 cells with low ISG15 expression to generate cells with stable ISG15 (PB-ISG15) or control vector (PB) expression to validate the effect of ISG15 on OSCC growth and metastasis; elevated expression of ISG15 mRNA, total and extracellular protein in these cells was confirmed via qRT-PCR, immunoblotting and ELISA (Fig. 1A–C). In our previous study, we demonstrated that ectopic ISG15 expression did not alter in vitro cell growth [20]. However, the orthotopic tumors with ectopic ISG15 expression in immune-deficient mice showed considerable increases in weight and volume (0.1993 ± 0.02883 g; 298.3 ± 44.06 mm3; n = 6) compared to control tumors (0.11 ± 0.01265 g; 146.8 ± 26.85 mm3; n = 6; P < 0.05, Fig. 1D). Through Ki-67 staining, we found that relative cell proliferation was higher in ISG15-expressing tumors (1.7 ± 0.1376; n = 30) compared to control tumors (P < 0.001; Fig. 1E, F). The discrepancy between in vitro and in vivo assays implied that surrounding stromal cells might be involved in ISG15-mediated in vivo tumor formation.

A Levels of ISG15 mRNA in OEC-M1 cells expressing the retroviral vector control (PB) or wild type ISG15 (PB-ISG15) assessed by qRT-PCR. Expression values were normalized to β-actin. Relative expression of ISG15 was determined by comparing the level in OEC-M1 PB-ISG15 to that in OEC-M1 PB cells. B Levels of ISG15 protein in OEC-M1 PB and PB-ISG15 cells were evaluated by immunoblot analysis. The ISG15 level was normalized against an internal control, α-tubulin. Ratios were calculated by dividing normalized ISG15 levels in PB-ISG15 cells by those in PB cells. C Extracellular ISG15 expression via ELISA analysis of conditioned media from OEC-M1 PB and OEC-M1 PB-ISG15 cells. Relative expression of extracellular ISG15 was determined by comparing the level in OEC-M1 PB-ISG15 to that in OEC-M1 PB cells. D Quantification of weight (left) and volume (right) of tumors from mice orthotopically injected with 5 × 10⁵ of OEC-M1 PB (n = 6) and PB-ISG15 cells (n = 6), sacrificed at 32–34 days post-inoculation. E Representative images of H&E, Ki-67, trichrome, and α-SMA staining of FFPE PB- and PB-ISG15-expressing OEC-M1 tumors, as visualized via bright-field microscopy. Scale bar: 200 μm. F Relative expression was determined by normalizing the mean density of Ki-67, collagen, or α-SMA expression per field in ISG15-expressing tissues to that in control tissues. G qRT-PCR analysis of Acta2, Tagln, and Tgfb1 levels in FFPE tissue sections of orthotopic PB or PB-ISG15 tumors. Expression values were normalized to β-actin. Relative gene expression in OEC-M1 PB-ISG15 tumors was normalized to that of OEC-M1 PB tumors. H Immunohistochemical (IHC) analysis of ISG15 and α-SMA in 54 human oral tissue specimens. The upper panels show IHC staining of representative human oral specimens with low (left) and high (right) ISG15 expression, while the lower panels demonstrate IHC staining of representative specimens with low and high α-SMA-positive stromal cell content. IHC images were visualized via bright-field microscopy; scale bar: 75 μm. The histogram shows quantification of ISG15 expression in human oral tissues with high (n = 33) and low (n = 21) percentages of α-SMA-positive stromal cells. The data for ISG15 expression was obtained from the Chen et al. study [20]. Error bars represent standard error (SE). *P < 0.05; **P < 0.01; ***P < 0.001.
Since CAFs are prominent in the tumor stroma of OSCC [5, 6], we examined the relationship between CAF and ISG15 expression. To do this, we analyzed ISG15 levels and CAF scores in The Cancer Genome Atlas (TCGA) HNSCC dataset, deposited in the publicly available UCSC Xena Functional Genomics Browser [26], using mRNA-based CAF signatures from Calon et al. [27], Wu et al. [28], Nurmik et al. [29], and Ko et al. [30]. Compared to normal head and neck tissues, HNSCC samples showed significantly higher ISG15 expression and CAF scores (Fig. S1A). A strong correlation between ISG15 and CAF scores was observed across multiple CAF signatures (Calon, Wu, Nurmik and Ko) in the TCGA HNSCC dataset (Fig. S1B).
We further validated these findings using the GSE37991 dataset, which includes data from 40 pairs of OSCC and surrounding tissues [31]. OSCC samples exhibited higher ISG15 expression and elevated CAF scores compared to non-tumor tissues (Fig. S1C). Similarly, significant correlations between ISG15 and CAF scores were found using signatures from Calon and Ko (Fig. S1D).
The GSE25099 dataset, containing samples from 57 oral cancer patients and 22 normal oral tissues [32], further confirmed these observations, showing higher ISG15 expression and CAF scores in OSCC compared to non-tumor tissues (Fig. S1E). Notably, CAF profiles from Nurmik and Ko also demonstrated a strong association with ISG15 expression (Fig. S1F). In addition, OSCC patients from the GSE37991 dataset with high ISG15 and CAF signatures (Calon and Ko) had significantly worse survival outcomes compared to those with low expression (P = 0.0091 and P = 0.0087, respectively) (Fig. S1G).
Next, to investigate whether the CAF levels in ISG15-expressing tumors, we examined the content of CAFs in orthotopic tumors by detection of collagen and α-smooth muscle actin (α-SMA) expression using immunohistochemistry (IHC). Relative collagen expression was significantly higher in tumors receiving ISG15-expressing OEC-M1 cells (2.343 ± 0.1748 per field, n = 80) compared to control tumors (Fig. 1E-F). Relative α-SMA expression was slightly greater in ISG15-expressing tumors compared to control xenografts (Fig. 1E, F). Additionally, LN1-1 cells with ISG15 knockdown lowered collagen expression in orthotopic tumors compared to controls (Fig. S2A, B) [20]. We observed increased collagen and α-SMA expression in tumors of mice injected with Isg15-expressing mouse OSCC cells compared to control tumors (Figs. S2A and S2C). In ISG15-expressing tumors, qRT-PCR with specific primers for myofibroblast markers, including α-smooth muscle actin (Acta2) [32], transgelin (Tagln) [11], and transforming growth factor beta 1 (Tgfb1) [33] revealed a significant increase in expression of Acta2 and Tagln, and a trend toward increased expression (not significant) in Tgfb1 expression compared to control tumors (Fig. 1G). We then assessed ISG15 expression, α-SMA-positive stromal cells in human oral tissue samples. The immunoreactivity score (IRS) of ISG15 labeling was higher in 33 samples with a high percentage of α-SMA-positive stromal cells (>5%) compared to 21 human oral specimens with a low percentage of α-SMA-positive stromal cells (≤5%; Fig. 1H). Similarly, the IRS of ISG15 staining was higher in human oral samples with a high percentage of fibroblast activation protein (FAP)-positive stromal cells compared to those with a low FAP percentage (Fig. S3). Human oral specimens with more α-SMA- or FAP-positive stromal cells showed increased ISG15 expression, indicating that abundant CAFs were detected in ISG15-expressing tissues.
Increased motility of immortalized fibroblasts by co-culture with ISG15-expressing OSCC cells
Aforementioned data suggested that the abundance of CAFs was associated with high ISG15 expression in tumor tissues. In this context, we tried to examine whether ISG15-expressing OEC-M1 cells could affect the in vitro characteristics of telomerase reverse transcriptase-immortalized fibroblasts S1F and R2F cells. These cells showed fibroblastic morphology (Fig. 2A) and expressed α-SMA and vimentin, but not the epithelial marker E-cadherin (Fig. 2B). Co-culture with OEC-M1 cells expressing either ISG15 (PB-ISG15) or the control vector (PB) did not influence the growth of S1F or R2F cells by MTS and cell counting assays (Fig. 2C). However, compared to OEC-M1 PB cells, immortalized fibroblasts co-cultured with OEC-M1 PB-ISG15 cells exhibited enhanced cell motility (Fig. 2D). In addition, immortalized fibroblasts co-cultured with ISG15 knockdown LN1-1 cells showed decreased cell migration compared to those co-cultured with vector control cells (Fig. 2E). To rule out the possibility of a cell-line-specific effect, co-culture experiments were conducted using another OSCC cell line, HSC3, expressing either ISG15 or the control vector. Similar to previous observations, co-culture with ISG15-expressing HSC3 cells did not influence the proliferation of S1F or R2F cells, as determined by MTS and cell counting assays. However, immortalized fibroblasts co-cultured with ISG15-expressing HSC3 cells exhibited significantly enhanced motility compared to those co-cultured with control vector-expressing HSC3 cells (Fig. S4). These co-culture data suggest that factors secreted from ISG15-expressing or ISG15-knockdown OSCC cells can affect fibroblast migration. Additionally, S1F and R2F immortalized fibroblasts expressing the mCherry protein were used for in vivo tracking (Fig. 2A). Overall, we found that mCherry tagging did not affect fibroblastic characteristics or ISG15-mediated fibroblast migration (Fig. 2B and D).
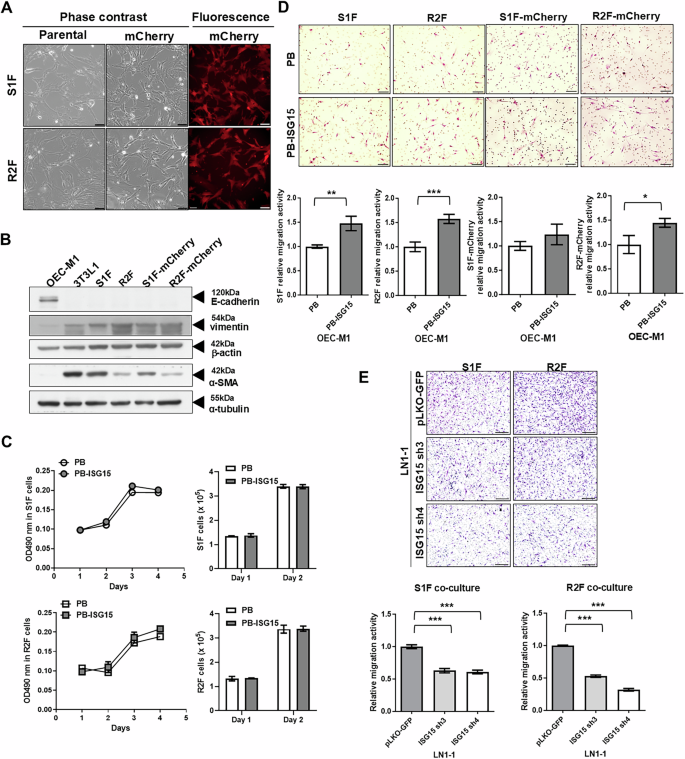
A Cell morphology of immortalized S1F and R2F cells, with or without mCherry fluorescent protein expression. Representative fields visualized under phase contrast and fluorescent microscopy are shown; scale bar: 100 μm. B Western blot analysis of E-cadherin, vimentin, and α-SMA protein in S1F and R2F cells, with or without mCherry expression. OCE-M1 and 3T3L1 cells were used as controls for epithelial cells and fibroblasts, respectively. α-tubulin and β-actin were used as internal controls. C Growth curves and cell numbers of S1F and R2F cells co-cultured with OEC-M1 cells expressing wild-type ISG15 (OEC-M1 PB-ISG15) or vector control (OEC-M1 PB) were measured by MTS assay and cell counting using a hemocytometer. D Relative migration activity of parental and mCherry-expressing S1F and R2F cells co-cultured with OEC-M1 PB and OEC-M1 PB-ISG15 cells. Upper panel: Images of migrated cells under bright-field microscopy; scale bar: 100 μm. Lower panel: Relative migration activity calculated by normalizing the mean number of migrated cells per field of fibroblasts co-cultured with ISG15-expressing cells to that of fibroblasts co-cultured with control cells. E Representative data indicating the relative migration activity of S1F and R2F cells co-cultured with LN1-1 cells expressing the control vector (pLKO-GFP) or ISG15 shRNA (ISG15 sh3 or ISG15 sh4). Upper: Migrated cells observed via bright-field microscopy; scale bar: 200 μm. Lower: Relative migration activity demonstrated by normalizing the mean number of migrated cells per field of fibroblasts co-cultured with ISG15 knockdown cells to that of fibroblasts co-cultured with control cells. Error bars represent SE; *P < 0.05; **P < 0.01; ***P < 0.001.
Fibroblast recruitment by ISG15-expressing cells enhances tumor growth
To examine whether ISG15-expressing tumor cells attracted more fibroblasts, OEC-M1 cells expressing ISG15 or vector were orthotopically injected into immune-deficient mice, and mCherry-expressing R2F cells were co-injected into sites flanking the tumor cell injection sites once per week (Fig. 3A). After sacrifice, mice receiving ISG15-expressing OEC-M1 cells and mCherry-fibroblasts had significantly steeper growth curves, as well as higher orthotopic tumor weights and volumes than those receiving control cells and fibroblasts (Fig. 3B, C). The mean weight of ISG15-expressing tumors (n = 4) was 0.14 ± 0.0041 g, while that of control tumors (n = 3) was 0.1067 ± 0.0667 g (Fig. 3C). Immunohistochemical staining of tumor tissue with an mCherry antibody demonstrated that mCherry protein was expressed in tumor stroma (Fig. 3D), with a small (non-significant) increase in mCherry protein detected in ISG15-expressing tumors when compared with control tumors (Fig. 3E). However, qRT-PCR analysis revealed significantly greater expression of mCherry mRNA in OEC-M1 PB-ISG15 tumors (1.632 ± 0.129, n = 3) compared to control tumors (1 ± 0.1466, n = 3; Fig. 3F). Our findings indicate that ISG15-expressing tumors recruit more fibroblasts.
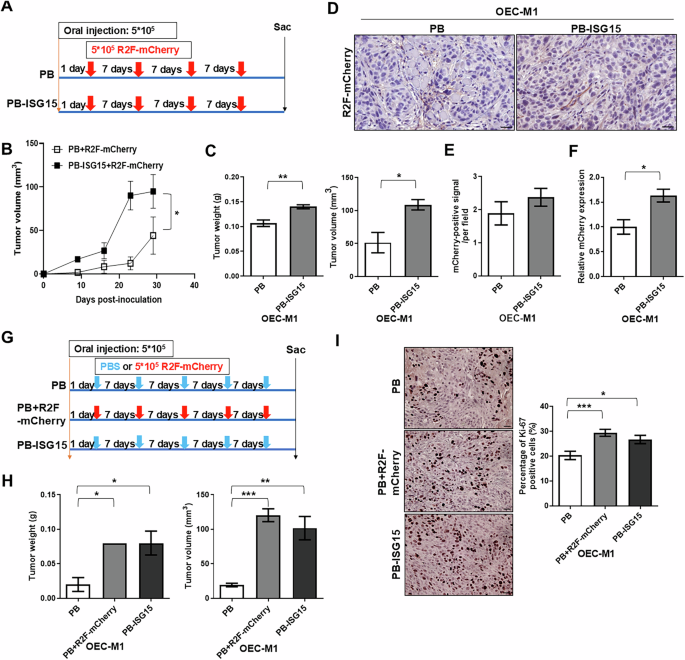
A Schematic of cell injection and treatment schedule showing that mice were orthotopically injected with OEC-M1 cells with ectopic ISG15 expression (OEC-M1 PB-ISG15) or vector control (OEC-M1 PB) cells with subsequent injection of mCherry-expressing fibroblasts (R2F-mCherry) once per week for a total of 4 weekly injections. B Growth curves of mCherry-expressing fibroblast-treated orthotopic tumors receiving OEC-M1 PB or PB-ISG15 cells. C Quantification of weights (left) and volumes (right) of tumors from mice with co-injection of mCherry-expressing R2F cells with either ISG15-expressing OEC-M1 cells (n = 4) or control cells (n = 3). D Representative images of IHC staining for mCherry in tumor sections from OEC-M1 PB and PB-ISG15 tumors co-treated with mCherry-expressing fibroblasts; scale bar: 45 μm. E Mean mCherry-positive signal per field in fibroblast-treated OEC-M1 PB and PB-ISG15 tumors. F Detection of mCherry expression level in fibroblast-treated orthotopic tumors receiving OEC-M1 PB and PB-ISG15 tumors by qRT-PCR. All amplifications were normalized to β-actin. Relative gene expression in OEC-M1 PB-ISG15 tumor pool (n = 4) was normalized to that in corresponding control tumor pool (n = 3). G Treatment schematic for mice orthotopically injected with OEC-M1 PB-ISG15 or OEC-M1 PB cells, with subsequent treatment with either mCherry-expressing fibroblasts or vehicle control (PBS) once per week for a total of 5 weekly injections. H Quantification of weights (left) and volumes (right) of tumors from mice with mCherry-expressing fibroblast (PB + R2F-mCherry, n = 2) or vehicle-treated orthotopic tumors receiving OEC-M1 PB cells (PB, n = 3) and OEC-M1 PB-ISG15 cells treated with vehicle (PB-ISG15, n = 3). I Left: Representative images of Ki-67-staining in vehicle-treated tumors (PB), mCherry-expressing fibroblasts (PB + R2F-mCherry), or vehicle-treated PB-ISG15 tumors; scale bar, 100 μm. Right: Percentage of Ki-67 labeled tumor cells per field in tumors with mCherry-expressing fibroblasts (n = 20), vehicle-treated tumors (n = 20), or vehicle-treated OEC-M1 PB-ISG15 tumors (n = 30) were shown. Error bars represent SE; *P < 0.05; **P < 0.01; ***P < 0.001.
To determine whether the recruited fibroblasts affect tumor growth, ISG15- or vector-expressing OEC-M1 cells were orthotopically inoculated into immune-deficient mice, and mCherry-expressing R2F cells or PBS were co-injected into sites flanking the tumor cell injection sites (Fig. 3G). As in the previous study [20], orthotopic tumors in mice receiving ISG15-expressing OEC-M1 cells and PBS treatment showed significantly increased weight and volume compared to control tumors (Fig. 3H). The weight and volume of orthotopic tumors in mice receiving control OEC-M1 cells and mCherry-expressing fibroblasts were dramatically elevated compared to those only receiving control OEC-M1 cells (Fig. 3H). The control tumors and the combination of control tumors and fibroblasts had weights of 0.02 ± 0.01 g (n = 3) and 0.08 ± 0 g (n = 2), respectively. The percentage of Ki-67-positive cells per field was significantly higher in orthotopic tumors treated with control OEC-M1 cells and mCherry-expressing fibroblasts (29.44 ± 1.408%, n = 20) compared to vehicle-treated OEC-M1 cells (20.34 ± 1.681%, n = 20; Fig. 3I). These results suggest that fibroblast recruitment increases OSCC cell proliferation and tumor development.
Exogenous ISG15 increases migration activity of immortalized fibroblasts
To identify the secreted factors from ISG15-expressing cells contributing to fibroblast motility, we then investigated the effects of extracellular vesicles (EVs), cytokines, and extracellular ISG15 on fibroblast functions. EVs were isolated and immunoblotted for marker protein expression (Fig. S5A). On average, OEC-M1 PB and PB-ISG15 cells produced the similar amount and size distribution of EV (Fig. S5B). R2F cells showed similar migratory activities with 0.3 or 0.6 μg/ml EVs from OEC-M1 PB or PB-ISG15 cells (FigS. S5C, D). We found that EVs from OEC-M1 PB or PB-ISG15 cells had no effect on fibroblast migration.
Cytokine expression of OEC-M1 PB and PB-ISG15 cells was not significantly different (P > 0.05; Fig. S5E). Interestingly, the level of ISG15 secreted from OEC-M1 PB-ISG15 cells was 3.6-fold greater than that of OEC-M1 PB cells (P < 0.001; Fig. 1C). To examine whether exogenous ISG15 contributed to fibroblast migration, we decided to in vitro treat the fibroblasts with 100-300 ng/ml of recombinant ISG15 based on standard practices in similar studies [23, 24, 34]. We found the migratory activities of S1F and R2F cells were dose-dependently elevated by exogenous recombinant ISG15 (Fig. 4A). Exogenous ISG15 also increased the migration of human fibroblasts from oral non-tumor and tumor tissues (Fig. S6A). These findings imply that exogenous ISG15 increases fibroblast motility. Cell proliferation experiments showed that exogenous ISG15 protein did not alter S1F and R2F cell growth by MTS and cell counting assays (Fig. 4B). ISG15-treated S1F cells showed more prominent elongated lamellipodia and increased relative protrusion levels: 1 ± 0.3767 for controls, n = 9; 3.321 ± 0.6141 with 100 ng/ml ISG15 treatment, n = 9; and 4.782 ± 0.4355 with 300 ng/ml ISG15 treatment, n = 9 (Fig. 4C). Similarly, R2F cells treated with ISG15 had longer lamellipodia than controls (Fig. 4C). Immunoblotting revealed that ISG15 also elevated the vimentin expression (Fig. 4D). These results indicate that ISG15 treatment affects S1F and R2F cell motility, membrane protrusions, and vimentin expression.
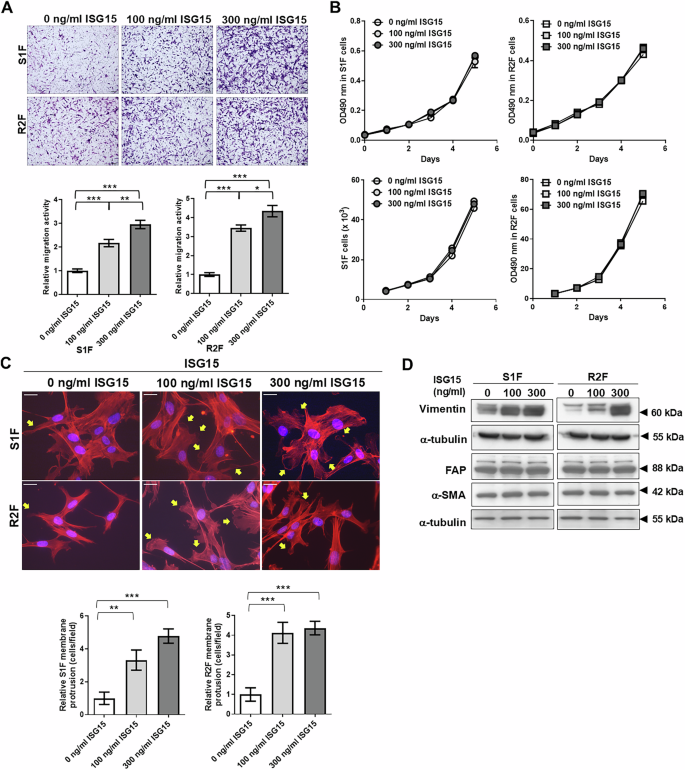
A Upper: Migrated cells observed via bright-field microscopy; scale bar: 500 μm. Lower: Relative migration activity determined as the mean number of migrated cells per field of 100 or 300 ng/ml recombinant ISG15-treated fibroblasts normalized to that of vehicle-treated control cells. B Proliferation of S1F and R2F cells treated with 100 or 300 ng/ml recombinant ISG15 protein, as measured by MTS assay and cell counting. C Upper: Representative images of phalloidin and DAPI-stained S1F and R2F cells treated with 100 or 300 ng/ml of ISG15, as visualized by fluorescence microscopy; scale bar: 50 μm. Yellow arrows indicate filopodia and lamellipodia. Lower: Relative membrane protrusion determined as the mean percentage of cells with protrusions per field of ISG15-treated fibroblasts normalized to that of vehicle-treated control cells. D Western blot analysis of vimentin, fibroblast activation protein (FAP), and α-smooth muscle actin (α-SMA) in S1F and R2F cells with or without exogenous ISG15 treatment. α-tubulin served as an internal control. Error bars represent SE; *P < 0.05; **P < 0.01; ***P < 0.001.
Preliminary, we found that the cell fractions for each sample of bulk RNA-seq in TCGA HNSCC dataset revealed a wide range of cell-type proportions from malignant cells (85 ± 0.69%), fibroblasts (4.78 ± 0.27%), macrophages (4.84 ± 0.26%) to T cells (0.8 ± 0.066%) (Fig.S7A), suggesting that the majority of cell types in HNSCC still is malignant cell [35]. Next, we examined the ISG15 expression in TME using the single cell RNA sequencing (scRNA-seq) dataset established by Puram et al. Data was shown that ISG15 expression was probably derived from tumor cells, fibroblast macrophage or T cells in TME (Fig. S7B-C). Obviously, we observed that 58.76% of total ISG15 counts in HNSCC tissues from tumor cells (Figure S7D) [36], suggesting that the major resource of ISG15 expression was derived from HNSCC cells.
Glycolysis is required for ISG15-mediated fibroblast migration
To investigate the mechanisms underlying ISG15-induced fibroblast migration, a microarray analysis was conducted to compare gene expression in 300 ng/ml ISG15-treated S1F and R2F fibroblasts with that of control cells. ISG15-treated S1F and R2F cells had at least 1.5-fold change in expression of 1549 and 1790 genes, respectively, compared to their control cells. In S1F cells treated with ISG15, expression of 807 genes were upregulated and 742 were downregulated compared to controls. In ISG15-treated R2F cells, 862 genes were found to be up-regulated and 928 down-regulated compared to controls (Fig. S8A). Only 64 up-regulated and 61 down-regulated genes were found to be in common between the two cell lines (Fig. S8A). Gene set enrichment analysis (GSEA) using the MSigDB Hallmark gene set collection revealed a significant enrichment of the “Glycolysis” pathway in ISG15-treated fibroblasts (Fig. 5A). Glycolysis-related genes, such as glyceraldehyde-3-phosphate dehydrogenase, spermatogenic (GAPDHS), 6-phosphofructo-2-kinase/fructose-2,6-biphosphatase 1 (PFKFB1), and L-lactate dehydrogenase C chain (LDHC) were confirmed, by qRT-PCR, to be upregulated in ISG15-treated S1F and R2F cells when compared to untreated fibroblasts (Fig. 5B) [37,38,39].
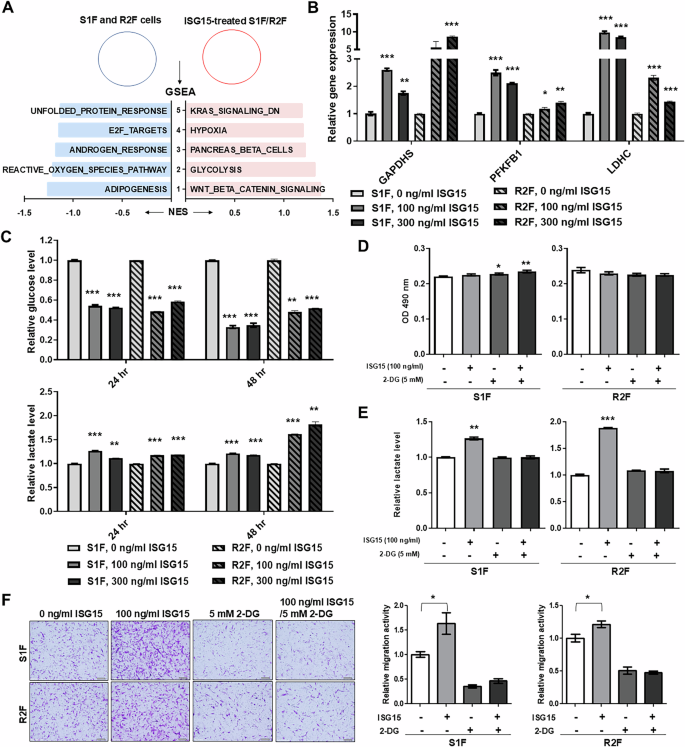
A Most enriched pathways associated with ISG15-treated immortalized fibroblasts determined by GSEA analysis. Light blue indicates a negative normalized enrichment score (NES), while pink indicates a positive NES. B Relative mRNA levels of GAPDHS, PFKFB1, and LDHC in S1F and R2F cells with exogenous ISG15 treatment. Amplification levels were normalized to β-actin. Relative mRNA expression in fibroblasts with ISG15 treatment was normalized to that in corresponding control cells. C Detection of extracellular glucose and lactate levels by ELISA in the culture medium of S1F and R2F cells treated with ISG15. Relative glucose and lactate levels were determined by normalizing the levels in the culture medium of ISG15-treated cells to those of the corresponding control cells. D Cell growth detected by MTS assay in S1F and R2F cells treated with 100 ng/ml ISG15, 5 mM 2-DG, or a combination of ISG15 and 2-DG. E Detection of extracellular lactate levels by ELISA in the culture medium of S1F and R2F cells treated with 100 ng/ml ISG15, 5 mM 2-DG, or a combination of ISG15 and 2-DG. Relative lactate levels were determined by normalizing the level in the culture medium of treated cells to that of untreated cells. F Representative data showing the relative migration activity of S1F and R2F cells treated with 100 ng/ml of ISG15 and/or 5 mM 2-DG and corresponding untreated cells. Left: Migrated cells observed via bright-field microscopy; scale bar: 500 μm. Right: Relative migration activity indicated as the mean number of migrated S1F or R2F cells per field after treatment with ISG15, 2-DG, or a combination of ISG15 and 2-DG and normalized to that of untreated cells. Error bars represent SE; *P < 0.05; **P < 0.01; ***P < 0.001.
ISG15 treatment increased glucose consumption, as assessed by ELISA, in S1F and R2F cells at 24 and 48 h, compared to untreated fibroblasts (Fig. 5C). Exogenous ISG15 treatment increased extracellular lactate at 24 and 48 h compared to untreated fibroblasts (Fig. 5C). Similarly, exogenous ISG15 increased glucose consumption and lactate generation in fibroblasts from non-tumor tissues and OSCC (Fig. S6B). The glycolysis inhibitor 2-deoxy-D-glucose (2-DG) did not affect S1F and R2F cell growth (Fig. 5D). Compared to vehicle-treated cells, 2-DG reduced ISG15-mediated lactate generation in S1F and R2F cells (Fig. 5E). Additionally, 2-DG reduced ISG15-mediated fibroblast migration (Figs. 5F and S8B). These results suggest that glycolysis is critical for ISG15-induced fibroblast migration.
Requirement of CD11a-dependent glycolysis in ISG15-induced fibroblast migration
The LFA-1 integrin, composed of CD11a (integrin αL) and CD18 (integrin β2), is a cell surface receptor for extracellular ISG15, and ISG15 has been shown to bind directly to the αI domain of CD11a in vitro [25]. To determine whether ISG15-induced fibroblast migration is mediated through its receptor, integrin αL (ITGAL) mRNA and protein levels were confirmed by qRT-PCR and immunoblot, respectively, in S1F and R2F cells, after stably expressing targeted ITGAL shRNA in S1F and R2F cells (Fig. 6A, B). The qRT-PCR data showed that ITGAL knockdown decreased ISG15-induced GAPDHS, PFKFB1, and LDHC gene expression in both SF1 and R2F cells (Fig. 6C). The reduction of CD11a expression by ITGAL knockdown in S1F and R2F cells reduced ISG15-induced glucose intake and lactate release compared to vector-expressing fibroblasts (Fig. 6D, E). ITGAL knockdown in S1F and R2F cells also prevented ISG15-induced cell migration compared to vector-expressing fibroblasts (Fig. 6F). Overall, these data suggest that CD11a-dependent glycolytic reprogramming is required for ISG15-induced fibroblast motility.
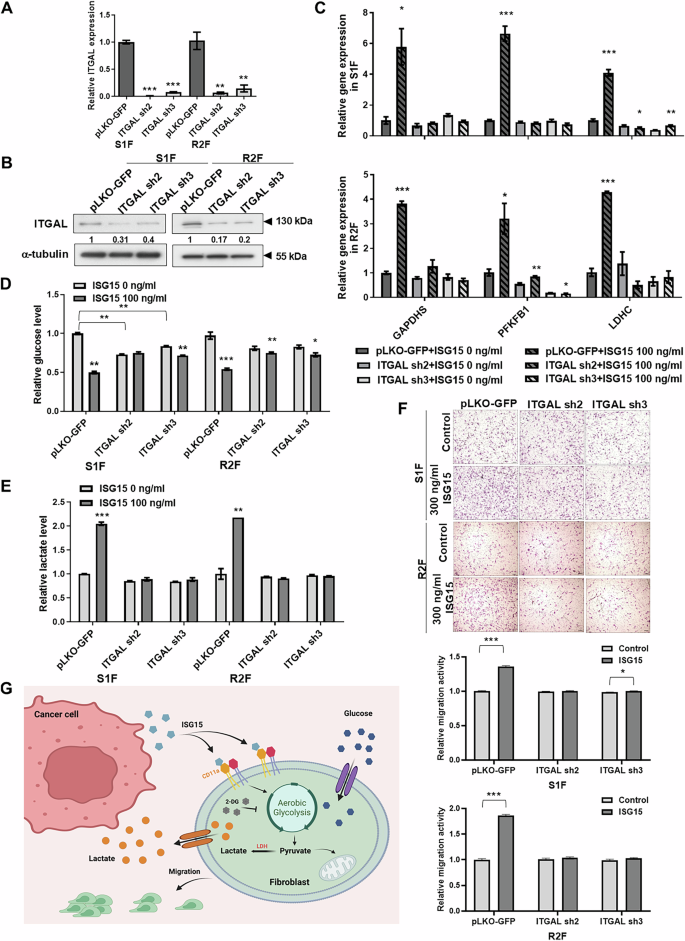
A Relative levels of ITGAL (CD11a) mRNA in S1F and R2F cells with ITGAL knockdown. Levels of mRNA amplification were normalized to β-actin. Relative mRNA expression in fibroblasts with ITGAL knockdown was normalized to that in corresponding control cells. B Detection of ITGAL (CD11a) protein levels by western blot in S1F and R2F cells with ITGAL knockdown. α-tubulin served as an internal control. Relative expression was calculated by setting the ITGAL (CD11a) level in the control cells to 1. C Relative levels of GAPDHS, PFKFB1, and LDHC mRNA in ITGAL-knockdown S1F and R2F cells with exogenous ISG15 treatment. Levels of mRNA amplification were normalized to β-actin. Relative mRNA expression in ITGAL-knockdown fibroblasts with ISG15 treatment was normalized to that in untreated control cells. D Detection of extracellular glucose levels and (E) lactate levels by ELISA in ITGAL-knockdown S1F and R2F cells treated with ISG15. Relative glucose and lactate levels were determined by normalizing the levels in the culture medium of ISG15-treated ITGAL-knockdown cells to that of untreated control cells. F Representative data showing relative migration activity of ITGAL-knockdown S1F and R2F cells with ISG15 treatment. Upper panel: Migrated cells observed via bright-field microscopy; scale bar: 500 μm. Lower panel: Relative migration activity calculated by normalizing the mean number of migrated cells per field in ITGAL-knockdown S1F or R2F cells treated with ISG15 to that in untreated control cells. G Illustration of the roles of ISG15 in fibroblast recruitment via CD11a-mediated glycolytic reprogramming. In OSCC, tumor cell-secreted ISG15 binds to its receptor, LFA-1, on fibroblasts, enhancing aerobic glycolysis and promoting fibroblast migration into the tumor-associated microenvironment. Error bars represent SE; *P < 0.05; **P < 0.01; ***P < 0.001.
Discussion
Fibroblasts within the TME, associated with disease recurrence and a poor prognosis in OSCC, exert significant tumor-modulating effects [6]. In this study, we found that ectopic expression of ISG15 enhanced OSCC tumor growth, but did not affect cell growth in vitro [20]. The association between collagen deposition, α-SMA expression, and ISG15 expression in tumors with either ISG15 overexpression or knockdown indicates the roles of CAFs in tumors with enhanced ISG15-driven growth of OSCC. Similarly, CAF signatures, which have been identified in non-small cell lung carcinoma, colorectal cancers, thyroid cancers, and OSCC, are significantly correlated with ISG15 expression in HNSCC and OSCC datasets [27, 28, 30, 40]. Our prior work and current data strongly suggest that fibroblast recruitment and activation promote tumor growth [3, 4], suggesting that genetic signatures of CAFs and co-expression of ISG15 may be indicative of poor prognosis for OSCC patients.
It has been reported that EVs play an important role in the crosstalk between cancer cells and CAFs [41]. Wu et al. demonstrated that nasopharyngeal carcinoma-derived EV packaged latent membrane protein 1 could activate the conversion of normal fibroblasts into CAFs [42]. However, we found that EVs were not responsible for ISG15-induced fibroblast recruitment. Several secreted proteins and cytokines, such as Wnt family member 7 A (Wnt7a) and C-C chemokine ligand 5 (CCL5), have been identified as molecules able to recruit and activate fibroblast conversion to CAFs [11, 43]. Our findings demonstrate that exogenous ISG15 promotes fibroblast motility and lamellipodia formation. Vimentin, FAP, and α-SMA are widely recognized as common markers of CAFs across various cancer types. Among these, vimentin expression was upregulated in ISG15-treated fibroblasts. Notably, Richardson et al. reported that vimentin is required for CAF motility [44], indicating that extracellular ISG15 plays a role in regulating vimentin expression in promotion of fibroblast motility. Unlike the effects of Wnt7a and CCL5, our data suggest that ISG15 enhances resident fibroblast motility, rather than proliferation, and does not obviously activate fibroblast conversion to CAFs in vitro [11, 43]. However, the CAF activation is a complex process that typically involves a diverse array of markers, including cytokines, matrix-remodeling enzymes, and factors that facilitate immune cell recruitment. While our findings provide preliminary insights into the relationship between ISG15 and fibroblast migration, the role of ISG15 in mediating CAF activation remains incompletely understood and requires further investigation.
While it is difficult to completely exclude the potential origin of ISG15 from fibroblasts, macrophages, or T cells in HNSCC tissues, the predominant source of ISG15 expression can be attributed to the abundance of tumor cells. In addition to fibroblast recruitment, tumor cell-secreted ISG15, which acts as a TME factor, may induce an M2-like phenotype, promoting tumor progression and suppression of the cytotoxic T lymphocyte response [23]. Characterization of additional effects on, and mediated by stromal cells in ISG15-mediated tumor growth requires further investigation.
More recent research has shown that cancer cell–CAF interactions greatly affect carcinoma development, metabolism, metastasis, and progression [45]. The “two-component” hypothesis, or “reverse Warburg effect,” has been proposed to reexamine tumor metabolism. Cancer cells and CAFs are metabolically linked in this scenario. CAFs undergo aerobic glycolysis to produce lactate, which cancer cells use to produce ATP for cellular activities [17, 46]. Zou et al. demonstrated that the M2 isoform of pyruvate kinase is particularly important in regulating glycolysis and migration in fibroblasts, as evidenced by odontogenic keratocyst fibroblasts where increased glycolysis correlates with enhanced migration and invasion capacities [47]. In the present study, we demonstrated that ISG15 induces fibroblast migration and upregulates glycolysis-related gene expression. Furthermore, inhibiting glycolysis significantly attenuated ISG15-mediated fibroblast migration, underscoring the link between metabolic reprogramming and cellular motility. While increased glycolysis is a significant driver of fibroblast migration, it is important to consider other factors such as the cellular microenvironment and signaling pathways that also contribute to this process.
Yan et al. discovered that intracellular ISG15 can bind covalently to glycolytic enzymes via ISGylation and reduce glycolytic activity in adipocytes [48]. It is possible that glycolysis was suppressed by ISGylation in ISG15-expressing cells. As a result, these ISG15-expressing cells may acquire lactate from ISG15-recruited fibroblasts, which undergo glycolytic reprogramming. Further identification of ISGylated proteins is needed to achieve more detailed characterization of the roles of ISGylation in glycolysis. In our study, the glycolysis pathway but not oxidative phosphorylation pathway was enriched in ISG15-treated fibroblasts by GSEA. Protasoni et al. reported that fibroblasts cultured in galactose or fructose show increased oxidative phosphorylation activity compared to those in glucose, indicating a shift towards oxidative metabolism [49]. While fibroblasts can be driven towards oxidative phosphorylation under certain conditions, the glycolytic phenotype remains dominant in many pathological states, such as cancer.
We found that immortalized fibroblasts require CD11a for ISG15-mediated functional alterations and recruitment of fibroblasts via LFA-1. Chen et al. reported that ISG15 enhances M2 polarization by interacting with its receptor, LFA-1, and stimulates the release of fibroblast-activating chemokines, including C-C motif chemokine ligand 18 (CCL18) [23, 50]. The data indicate that ISG15 has an extensive impact on fibroblasts, either by direct interaction with the LFA-1 receptor on target cells or indirect regulation through chemokines released by stromal cells. Preliminary data indicate that immortalized fibroblasts with ITGAL knockdown have decreased ability to stimulate tumor growth in ISG15-expressing xenografts (unpublished data), suggesting the possibility of targeting the ISG15–LFA-1 interaction in OSCC treatment. Zhang et al. found that CAF with high integrin β2 expression increased glycolysis and lactate release, promoting OSCC cell growth [51]. The data suggest that CAFs regulate metabolic reprogramming via CD11a or integrin β2, and OSCC cells absorb and use the released lactate for energy production. Furthermore, Swaim et al. demonstrated that ISG15 engagement of LFA-1 led to the activation of SRC family kinases (SFKs) [25]; however, the undefined connection between LFA-1 signaling and induction of glycolysis requires further investigation.
Through the data presented, our study is the first to suggest that the secreted free form of ISG15 enhances glycolytic reprogramming in fibroblasts, through CD11a, by increasing glucose consumption and lactate production, as well as recruiting fibroblasts to the TME (Fig. 6G). Our findings provide compelling evidence that the link between ISG15 and CD11a-dependent glycolytic reprogramming could serve as a promising therapeutic target in the treatment of OSCC.
Materials and methods
Ethics approval and consent to participate
All animal studies adhered to the guidelines for the Care and Use of Laboratory Animals established by the National Health Research Institutes, Taiwan. The National Health Research Institutes Institutional Animal Care and Use Committee accepted the protocols (NHRI-IACUC-107011-A). The IRB approved use of oral tissue sections and oral cancer cell lines (EC1070103-E, National Health Research Institutes). All processes followed established regulations.
Cell lines and reagents
Human OSCC cell lines, including OEC-M1 (RRID: CVCL_6782) and LN1-1 cells, which were developed via in vivo selection from an OEC-M1-derived tumor, and the mouse OSCC cell line M1-2S were cultured as described previously [52, 53]. The telomerase reverse transcriptase (TERT)-transformed human dermal fibroblast cell lines, including S1F and R2F, were originally established in the Rheinwald laboratory as previously described [54, 55]. Two human primary fibroblast cell strains, TF and NF were isolated from an OSCC tumor biopsy and its normal counterpart tissue, respectively, and established in the Liu Laboratory [56]. These cells were authenticated using the short tandem repeat assay at the Center for Genomic Medicine, National Cheng Kung University (Tainan, Taiwan) in the past three years. All experiments were performed with mycoplasma-free cells. The glycolytic inhibitor 2-deoxy-D-glucose (2-DG, D8375, Sigma-Aldrich, St. Louis, MO, USA) was added into the culture medium 1 h prior to the assay.
Quantitative reverse transcription polymerase chain reaction (qRT-PCR)
The qRT-PCR was performed as previously reported [57]. The primer sequences are listed in Supplementary data.
Immunoblot
Immunoblot assays were conducted as reported previously [57]. Primary antibodies were utilized as shown in Supplementary data.
Orthotopic transplantation
Orthotopic injection was performed as reported in previous studies [52, 53]. The detail was described in Supplementary data.
Immunohistochemistry (IHC)
IHC was conducted as described previously [20]. Primary antibodies were applied as follows: anti-α-SMA (1:250; ab5694, Abcam), anti-FAP (1:200; ab53066), anti-mCherry (1:250; GTX128508, GeneTex), and anti-Ki-67 (1:500; ab16667, Abcam). Sections were counterstained with hematoxylin (No. 3008-1, MUTO PURE Chemicals, Tokyo, Japan) and observed via bright-field microscopy. For the detection of α-SMA expression in orthotopic OSCC tissues, α-SMA levels were scored from 0 to 3 (0=negative, 1=weak, 2=intermediate, 3=strong) based on staining intensity. To assess α-SMA and FAP expression in a human oral tissue array procured from US Biomax (OR601; Derwood, MD, USA), levels of the indicated protein in each sample were categorized as low or high based on staining intensity. To assess mCherry expression, six fields per sample were examined, and the average staining intensity across imaging fields was calculated. For Ki-67 staining, ten fields per sample were assessed. The percentage of Ki-67 positive cells was determined using the ImageJ software plugin ImmunoRatio [58] and calculated as the total intensity of positively stained nuclei of tumor cells divided by the intensity of total nuclei in the field.
Coculture of cell proliferation and migration
For the cell proliferation assay, OSCC cells and fibroblasts were co-cultured using a Transwell system with a 1 μm pore size (BD Biosciences). Fibroblasts (5 × 10⁴ cells/well) were seeded in the bottom well of a 24-well plate, while OSCC cells (2 × 10⁵ cells/well) were seeded in the upper chamber of the Transwell inserts. OSCC cells were allowed to adhere for 24–48 h before performing the cell proliferation or cell counting assays. For the migration assay, OSCC cells and fibroblasts were co-cultured using a Transwell system with an 8 μm pore size (BD Biosciences). OSCC cells (2 × 10⁵ cells/well) were seeded in the bottom well of a 24-well plate, while fibroblasts (5 × 10⁴ cells/well) were seeded in the upper chamber of the Transwell inserts. OSCC cells were allowed to adhere for 24–48 h before performing the migration assay.
The proliferation curves were derived by calculating the mean ± standard error (SE) of absorbance measurements at 490 nm using a 96-well plate reader and cell counting using a hemocytometer [57]. Experiments were carried out in triplicate for MTS assay and duplicate for cell counting and repeated three times. The cell migration assay was conducted as described previously [53]. The number of migrated cells was determined by counting the cells via bright-field microscopy. The representative pictures of migrated cells in the field were shown in high or low magnification. Relative migration activity was calculated by comparing the number of migrated cells per field in the test condition to the mean number of migrated cells in the control condition. All experiments were conducted in duplicate and repeated at least three times.
Cell morphology
Cells (1 × 10⁵ cells) were seeded onto coverslips and cultured overnight. After rinsing with DPBS, cells were fixed with 4% paraformaldehyde for 10 min, at room temperature, followed by permeabilization using 0.1% Triton X-100. Cells cultured on coverslips were stained with Phalloidin-iFluor™ 594 Conjugate (1:5000; 23122, ATT Bioquest, Pleasanton, CA, USA), mounted on slides, and visualized using a fluorescent microscope.
Lactate production and glucose uptake
Quantification of glucose (J6021, Promega, Madison, WI, USA) and L-lactate (J5021, Promega) assay kits were used according to manufacturer’s instructions. The glucose and lactate levels were normalized to cell counts measured by MTS assay.
Statistical analysis
The Kaplan-Meier method was employed to construct survival curves, and the Log-rank test was utilized to determine univariate survival differences. The hazard ratio (HR) and 95% confidence intervals (CI) were calculated based on the survival assay. The forest plot, construed by HR and 95% CI, was generated using GraphPad Prism software. Associations between continuous variables were assessed using Pearson’s correlation for two groups. The Pearson correlation coefficient (r) was calculated to quantify the strength and direction of the correlation. The significance of differences between two groups was evaluated using Student’s t-test. All analyses were conducted using GraphPad Prism software. A two-tailed P-value of less than 0.05 was considered statistically significant for all comparisons.


Responses