Closed-loop enhancement of plant photosynthesis via biomass-derived carbon dots in biohybrids
Introduction
Photosynthesis, a process used by plants, algae, and cyanobacteria to convert CO2 and water into sugars with the aid of solar energy, provides food and energy for nearly all life on Earth1. Improving photosynthesis is crucial to feeding a growing population, especially with the negative effects of climate change and declining arable land2,3. Although photosynthetic organisms have evolved efficient light-harvesting systems with a high quantum efficiency, the overall photosynthetic efficiencies are still low (i.e., 0.2–1% for crop plants)4,5. During natural photosynthesis, light is absorbed by chlorophyll molecules in photosystems. As the chlorophylls are primarily sensitive to visible light, photosystems can only intercept about 40% of the incident solar energy5. Light reflection and transmission due to weak absorption of green light cause a further loss of energy. Attempts to improve photosynthesis included genetic manipulation of light-harvesting antenna6, engineering ribulose 1,5-bisphosphate carboxylase/oxygenase (Rubisco) for higher activity and specificity7, enhancing the regenerative capacity of the carbon reduction cycle4, and rewiring photorespiration to avoid CO2 release8. However, these efforts face challenges: firstly, only a few photosynthetic organisms are tractable for complex genetic engineering9. Additionally, the chlorophyll-based light harvesting and charge separation are kinetically restricted10, and those light-harvesting systems are prone to photodamage11, thereby impeding the efficiency of photosynthesis.
Photosynthetic biohybrids, integrating biocatalysts with carbon-based or metallic-based materials, emerge as a viable an alternative for enhancing solar energy utilization12,13,14. In such hybrid systems, biocatalysts can be photosensitized with semiconductors that harvest light energy stably and efficiently13,15,16,17,18. The photoexcited electrons are fed into proteins or cells to drive CO2 reduction or chemical production15,19,20. Previous studies have shown that semiconductor biohybrids can not only improve natural photosynthesis (Supplementary Table 1) but also allow the light-driven conversion of CO2 to chemicals by nonphotosynthetic bacteria21,22,23,24,25. Some organic polymers are capable of absorbing the light spectra that chlorophylls do not capture (e.g., ultraviolet and infrared light), thereby offering a promising solution to optimizing spectral quality for plants and other photosynthetic organisms26,27. Despite these advancements, materials that combine enhanced energy conversion efficiency, biocompatibility, and reduced cost are still crucial for augmenting photosynthesis. This is particularly vital given the potential for large-scale applications in agriculture and solar-powered biomanufacturing. Carbon dots (CDs), a type of carbon-based nanomaterials which could use biomass carbon for environmentally friendly and scaled synthesis, have great advantages in terms of biocompatibility and low cost over metallic-based materials28,29,30. CDs has been wildly used as a light converter that possess strong light absorption and outstanding capability of spectral modifications for enhancing plant photosynthesis31,32,33 (Supplementary Table 1). They often observed that CDs accelerate the electron transfer rate by chlorophyll fluorescence kinetic parameters, including the relative electron transport rate (rETR (II) and rETR (I)). In this situation of only spectral modification, the intrinsic turnover rate of photosystem II-water-oxidizing complex (PSII-WOC) limit the further improvement of photosynthetic efficiency10,34. Therefore, donating exogenous electrons coupled spectral modification via CDs likely further improve the energy efficiency. However, the capability of CDs as photosensitizers has only been reported to donate exogenous electrons to enzyme35,36 or isolated chloroplast37. The simultaneously photosensitization and spectral modification, remains underexplored (Supplementary Table 1).
In this study, we introduced CDs from agricultural biomass as biocompatible photosensitizers and spectral converters simultaneously for enhancing photosynthesis in plant and cyanobacteria hybrid system through a closed-loop cycle (Fig. 1a). Those CDs could convert a broad-spectrum light into favorable red light, improving light utilization efficiency, and generating an effective light-activated electrical current intracellularly, providing an additional supply of extra-exogenous electrons for the photosynthetic electron transfer chain (PETC) and avoiding inefficient electron transfer across the membrane, thus enhancing the photosynthesis. Those enhanced biomass from the boosted photosynthesis can be further synthesized into functional carbon dots, forming the closed-loop cycle. We demonstrated that the CDs–biohybrids showed enhancement in both the light-dependent reaction and the carbon fixation rate, leading to a 2.2-fold improvement for converting solar energy into chemical energy and 1.8-fold faster plant biomass growth in Arabidopsis thaliana, respectively. By tuning the activity of PETC, we discern that both light conversion and photoelectrons contribute to these improvements. Techno-economic analysis (TEA) showing that the waste-biomass derived CDs biohybrid approach have the lowest production cost ($0.14–0.20 g−1), while preserve a higher photosynthetic efficiency, resource accessibility, and food and environmental safety. Our results advocate for the use of our developed biohybrid systems as a most promising platform for sustainable agriculture and food security.
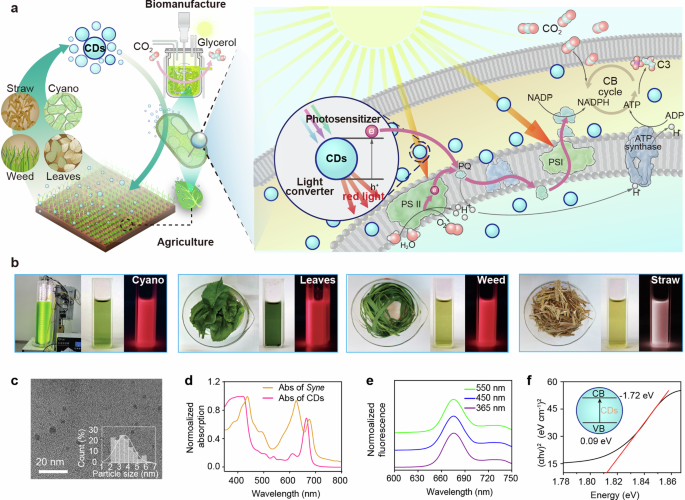
a Schematic of waste-biomass based-CDs for enhancing CO2-to-chemical production and plant biomass growth based on photosensitization and spectral modification. The enhanced biomass waste is further used for CDs production and forming a closed-loop cycle. b The representative images of four different sources of waste biomass and their CDs solution. For each CDs, Left: the raw biomass; Middle: the image under white light; Right: the image under UV light (365 nm). c The TEM images were used to analyze the diameter of particles (more than 110 particles). d Normalized UV-visible absorption spectra of Syne in culture medium and C-CDs in ethanol. e Normalized fluorescence spectra of C-CDs in ethanol with UV, blue, and green light excitation. f The Tauc plot for C-CDs. The intercept was used to calculate the direct bandgap. Inset: the band information of C-CDs. CB conduction band, VB valence band. α is the absorption coefficient, h is the Planck’s constant (6.626 × 10⁻³⁴ J·s), and v is the frequency.
Results
Closed-loop production of biomass-derived CDs
The global annual production of biomass waste is estimated at approximately 140 Gt38, utilization of waste biomass and recycling toward circular bioeconomy which is cost-effective and environmentally friendly. We developed a viable solvothermal method to synthesize CDs from four major sources of biomass waste39 (Fig. 1a). Rice straw, weed, leaves, and cyanobacterial cells were collected separately, and each type was extracted with ethanol (Supplementary Fig. 1). The extracted solutions were heated in autoclaves, filtered, dried, and further processed with dichloromethane to extract the CDs from the lower liquid layer. Despite the varied biomass sources, we consistently produced CDs with customizable physical and chemical properties and high uniformity simply by managing the synthesis conditions (Supplementary Figs. 1 to 4). Transmission electron microscopy (TEM) analysis revealed that the CDs were uniformly sized between 1.8 and 3.5 nm (Fig. 1c and Supplementary Fig. 2). All four types of CDs demonstrated broad absorption spectra ranging from 350 to 690 nm (Fig. 1d and Supplementary Fig. 3a–d). By contrast, cyanobacterial and plant cells had limited absorption of UV and green light40 (Fig. 1d). The red fluorescence emitted by CDs spanned from 640 to 710 nm (maximum at 676 nm) (Fig. 1d and Supplementary Fig. 3e–h), which were located within the optimal adsorption region of cyanobacteria and plants41. The emission λmax remained nearly constant with excitation wavelengths at 365 nm, 450 nm and 550 nm, respectively (Supplementary Fig. 4), which is likely due to the surface states or defects emission42. The absorption and fluorescence of CDs in water were similar to those in ethanol (Supplementary Fig. 5), although the photoluminescence quantum yield (PLQY) in water was lower. The PLQY of CDs in water and ethanol was 0.41% and 5.97%, respectively (Supplementary Fig. 6). These results demonstrate that these CDs are capable of optimizing spectral quality.
We subsequently evaluated the photoelectrochemical performance of the various CDs. Cyanobacterial-derived CDs (C-CDs) generated a photoinduced current of 230 nA cm−2, outperforming those derived from leaves, weed and straw, which generated currents of 138, 146, and 25 nA cm−2, respectively (Supplementary Fig. 3i-l, with 200 μL of 1.25 mg mL−1 CDs on the electrode). To test whether the photoinduced electron-hole charges separation by the C-CDs could catalyze the degradation of organic compounds, the intrinsic property of semiconductor, the C-CDs particles were incubated with 100 mg L−1 of phenol. We observed that phenol concentration decreased by about 50% under illumination within 24 h (Supplementary Fig. 8). In contrast, degradation of phenol was negligible in the absence of C-CD particles. Consequently, C-CDs was selected for the subsequent experiments. The C-CDs had both hydrophobic and hydrophilic moieties on the surface (Supplementary Fig. 7a), mainly consisted of carbon (C), hydrogen (H), nitrogen (N), and oxygen (O) elements, and exhibited an amorphous structure (Supplementary Fig. 7). The C-CDs possessed a direct bandgap energy of ~1.81 eV with conduction band (CB) of −1.72 eV and valence band (VB) of ~0.09 eV (Fig. 1f), which is similar to previous reports43,44. As PETC has a reducing potential higher than −1.3 eV45, C-CDs could potentially provide the exogenous electrons to the PETC and enhance photosynthesis.
Incorporation of CDs into Synechococcus elongatus cells
Due to the extremely small size of the C-CD particles ( ~ 3.5 nm), we hypothesized that they could cross the cell membrane to enter the cell. Within the cell, the C-CD particles could generate photoexcited electrons, thus the energy-consuming transmembrane electron transfer could be bypassed46. To test our hypothesis, we added C-CDs to the cell suspension of a unicellular cyanobacterium Synechococcus elongatus UTEX 2973 (Syne). After incubation for 1 h, the cells were collected, and cross-sectional samples were prepared for high-angle annular dark field scanning transmission electron microscopy (HAADF-STEM) analysis. To enhance contrast for better imaging in HAADF-STEM, the CDs were doped with Zn (all CDs in other experiments did not contain Zn), which had no effect on the CDs’ morphology (Supplementary Fig. 9c). STEM-energy dispersive spectroscopy (EDS) mapping showed that the Zn elemental signal was in alignment with nitrogen and oxygen elements (biomass signals) and evenly distributed throughout the cells (bottom of Fig. 2a, and Supplementary Fig. 9a). In contrast, no Zn was detected for control samples without CDs (top of Fig. 2a). The STEM data indicated that the CDs were efficiently translocated into the Syne cells within 1 h, resulting in the formation of CDs–Syne biohybrids. In addition, the zeta potentials of Syne shifted from −14 mV to −21 mV upon combination with CDs, which had a zeta potential close to −1 mV (Fig. 2d). Importantly, the CDs–Syne displayed a peak photocurrent of 62 nA cm−2, surpassing the sum of the photocurrents from C-CDs only (41 nA cm−2) and Syne cells only (9 nA cm−2) (Fig. 2b, c). The internalized CDs of bacterial cells likely enhance conductivity of bacteria47,48, thus the CDs-Syne hybrids had a higher photocurrent than CDs only and Syne cells only. While the CDs-Syne cell lysate generated the highest photocurrent due the release of PSII complex49 (Supplementary Fig. 10). These results indicate the successful incorporation of CDs into Syne cells.
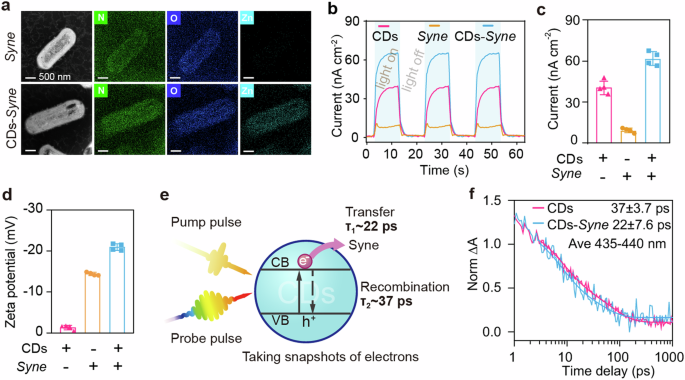
a Cross-sectional STEM image of biohybrid sample. b A representative photocurrent curve of CDs, Syne cells, and CDs–Syne hybrids (30 μL per sample, containing 500 mg L−1 C-CDs, Syne cells with OD730 of 9, used carbon paper (1 × 1 cm2) as working electrode). c The quantitative photocurrent of CDs, Syne cells, and CDs–Syne hybrids. d The zeta potentials of C-CDs in ethanol, Syne cells in water and CDs–Syne hybrids in water. e Schematic of transient absorption (TA) spectroscopy analysis. τ1 and τ2 represent the charge transfer process and charge recombination process, respectively. f Transient kinetics for pure CDs and CDs–Syne hybrids.
To study the charge transfer between CDs and Syne interfaces, we performed transient absorption (TA) spectroscopy analysis. The CDs were excited by the pump light and the electron dynamics signals were recorded by the probe light (Fig. 2e). We firstly explored whether the observed dynamics signals were electron dominates. TA spectra of CDs with electron capture agent (Fe3+) or hole trapping agent (Vitamin c) were shown in Supplementary Fig. 11a, b. The TA spectra of CDs (430 nm and 450 nm) were almost overlapped with the vitamin addition samples, but were different from the Fe3+ addition samples. Those results confirmed the dynamic signals in the 435–440 nm range, in which the electron signal dominated. The TA spectrum of CDs–Syne hybrids exhibited a faster decay than CDs only (Fig. 2f). This result suggests that the presence of Syne facilitates electron transfer from CDs. To quantitatively analyze the charge transfer rate, a biexponential function was employed50,51. The time constants and relative weights for the charge transfer process and charge recombination process are shown in Supplementary Table 2. With the addition of Syne, the first time constant becomes slightly shorter, decreasing from 7.3 ps to 6.6 ps, indicating that this process might be intrinsic to CDs as a trapping process. The second time constant changes significantly from 64 ps to 39 ps. This large change in time constants within the picosecond range suggests potential charge transfer52. The charge transfer process in the CDs–Syne took only 22 ps, which was approximately a 40% decrease compared to that of the CDs only (37 ps). Overall, these results demonstrate that photoexcited electrons were transferred from CDs to the Syne cells at a rate of a few ps.
Enhanced photosystem activity and carbon fixation in CDs–Syne hybrids
To assess whether the CDs could improve the efficiency of photosynthesis, we cultivated Syne cells in minimal medium with varying concentrations of CDs (10, 40, 80, and 160 mg L−1). Cell growth was monitored by measuring optical density at 730 nm (OD730). The introduction of 0.1% ethanol along with the CDs showed no observed inhibition on the growth of Syne cells (Supplementary Fig. 12). The CDs–Syne hybrids, compared with the Syne cells only, showed accelerated growth with CDs concentrations lower than 80 mg L−1 (Fig. 3a). The observed growth inhibition at a high CDs concentration (160 mg L−1) (Fig. 3a) was likely due to the generation of reactive oxygen species (ROS)53. Notably, at the optimal concentration of CDs (40 mg L−1), the growth rate of Syne cells reached 0.1 h−1 during the exponential growth phase, which was 1.5-fold higher than that of the control group without CDs. As photoautotrophs, Syne cells fix and convert CO2 into biomass, and they derive energy from photosynthesis for CO2 fixation and biomass formation54.
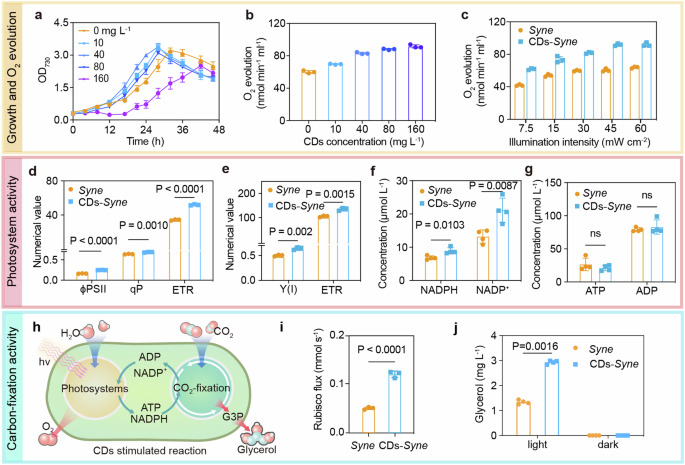
a The growth curve of Syne cells with different concentrations (10, 40, 80, and 160 mg L−1) of CDs. The data are presented as the mean values ± standard deviation of four replicates. b The oxygen evolution rate of Syne cells with different concentrations of CDs under light intensity of 30 mW cm−2. c The oxygen evolution rate of Syne cells with 40 mg L−1 CDs under various light intensity. d Quantum yield (ϕPSII), photochemical quenching coefficient (qP) and electron transport rate (ETR) of PSII in CDs–Syne hybrids and Syne cells only. e Quantum yield (Y(I)) and ETR of PSI in Syne cells and CDs–Syne hybrids. f The intracellular concentration of NADP+ and NADPH in Syne cells and CDs–Syne hybrids. g The intracellular concentration of ADP and ATP in Syne cells and CDs–Syne hybrids. h Schematic of CDs-enhanced activities of photosystems for ATP and NADPH generation and CO2 fixation in cyanobacterial cells. G3P, glyceraldehyde 3-phosphate. i. The metabolic flux through Rubisco in Syne cells and CDs–Syne hybrids. j The glycerol production of Syne and CDs-Syne under light and dark condition.
We further explored the possibility of CDs as carbon nutrients for above improvement. We precultured the Syne cells in the culture medium containing 13C labeled NaHCO3 to allow all carbons were labeled with 13C in Syne cells. The 13C labeled Syne cells were culture with the addition of 12C labeled CDs. As shown in Supplementary Fig. 13, there was no significant increasing of unlabeled fraction of central metabolic metabolites, such as glyceraldehyde 3-phosphate (G3P), glycine and alanine. This result indicated the 12C CDs unable to be used as carbon sources to incorporate carbon into the cells. This result indicated the CDs unable to be used as carbon sources to incorporate carbon into the cells. Thus, our results suggest that the CDs enhance the photosystem activity and CO2 fixation of Syne cells.
We then studied the effect of CDs supplementation on the activities of cyanobacterial water-splitting oxygen-producing photosystems that generate reducing power NADPH and a proton gradient for the regeneration of ATP55. The oxygen evolution rate was used to assess the peak capability of PSII at short time (within 10 min), which increased in the upon CDs addition, regardless of the light intensity conditions, low or high (Fig. 3b, c). The oxygen evolution rate was enhanced with increasing amounts of the CDs (Fig. 3b). In the presence of 160 mg L−1 CDs, the oxygen production rate reached 91.7 nmol min−1 mL−1, which was increased by 52.5% compared to the control without CDs (60.1 nmol min−1 mL−1). The highest oxygen evolution rate was achieved at a concentration different from that optimal for Syne growth. Furthermore, the chlorophyll fluorescence and P700 of Syne were measured using a Dual-PAM−100 fluorometer to assess the activities of PSII and PSI. Compared with the control without CDs, the effective quantum yield of PSII (ϕPSII) in the CDs–Syne hybrids increased by 51.7% (Fig. 3d), which indicated an increase in the proportion of PSII-absorbed light energy that was used for charge separation and water oxidation. The photochemical quenching coefficient (qP) of Syne, which represents the proportion of open PSII reaction centers, was increased by 5% when incubated with the CDs (Fig. 3d). The CDs enhanced the electron transport rate (ETR) of PSII in Syne by 51.5%. Therefore, the CDs improved the PSII activity of Syne. Based on P700 measurements, we found that the effective quantum yield of PSI, Y(I), in the CDs–Syne hybrids was 31.1% higher than that in the Syne cells (Fig. 3e). The ETR of PSI in the Syne was increased 1.31-fold when incubated with CDs. Therefore, the CDs enhanced the activities of both photosystems and accelerated the linear electron transport in Syne. In addition, the intracellular NADPH concentrations in Syne were raised from 6.87 to 8.94 µM (30% increase) by incubation with CDs (Fig. 3f). This suggests that CDs likely introduced metabolic perturbation affecting the regulation of NADP(H) synthesis and degradation56. The intracellular pool size of ATP was not changed significantly (Fig. 3g), which could be explained by a simultaneous increase in ATP production and consumption for biomass synthesis57.
We next examined the effect of CDs supplementation on cyanobacterial carbon fixation activities. The metabolic flux through Rubisco in the Calvin-Benson (CB) cycle was determined based on [13C]-bicarbonate dynamic labelling experiments and measurements of the incorporation of 13C into the reaction product, 3-phosphoglyceric acid (PGA; Fig. 3h)58. The CO2-fixation flux was 0.146 mM s−1 in the CDs–Syne hybrids, which was 2.4-fold higher than that in Syne cells (0.06 mM s−1, Fig. 3i). Moreover, the intracellular PGA concentration in the CDs–Syne hybrids increased 2-fold (Supplementary Fig. 14a), and the concentrations of other CB cycle intermediates including glucose-6-phosphate and fructose-6-phosphate also increased when compared with the control without CDs (Supplementary Fig. 14b). These results suggest that the CDs augmented the photosynthetic CO2 fixation in Syne (Fig. 3h).
To investigate whether the CDs–biohybrids allow efficient photosynthetic production of chemicals from CO2, we added the CDs to a cell suspension (OD730 ~ 1) of a glycerol-producing S. elongatus strain XG60850. After incubation for one hour under white light LED (1.35 mW cm-2), the CDs–Syne hybrids produced glycerol from CO2 with a titer of 2.94 mg L−1, which was 120% higher than that from XG608 without CDs (Fig. 3j). This improvement was notably higher than that reported for the Au–Syne hybrids50. Additionally, under a high light intensity (6.00 mW cm-2), the glycerol production from the CDs–Syne hybrids increased by only 18% compared to that from the Syne cells (Supplementary Fig. 15). We can therefore conclude that CDs improved the cyanobacterial chemical production from CO2, particularly under low light intensities.
CDs enhance photosynthesis via photosensitization and light conversion
To determine whether the photoexcited electron transfer from the CDs contributed to the enhancement of cyanobacterial photosynthesis, we examined the effects of photosynthesis inhibitors on the glycerol production from the CDs–Syne hybrids. The inhibitors tested were 3-(3,4-dichlorophenyl)−1,1-dimethylurea (DCMU), 2,5-dibromo-3-methyl-6-isopropylbenzoquinone (DBMIB), and phenylmercuric acetate (PMA)59 (Fig. 4a). We found that in the presence of DCMU, which inhibits the electron transport from the PSII reaction center to plastoquinone (PQ), CDs supplementation still resulted in a 3.46-fold increase in the cyanobacterial glycerol production (Fig. 4b, c). By contrast, the fold changes of glycerol production were not changed significantly by CDs in the presence DBMIB, which inhibits the electron flow from the PQ to cytochrome b6f, or PMA, which inhibits ferredoxin and NADP+ reduction (Fig. 4b, c). These results indicated that the CDs transferred photoexcited electrons to the PETC probably via PQ, and the good fit between the CB potential of CDs (−1.72 eV) and the oxidation-reduction potential of PQ ( ~ 0.1 eV) also confirmed this result. Which was consistent with previous studies that have shown the entry of exogenous electrons into the PETC through PQ59.
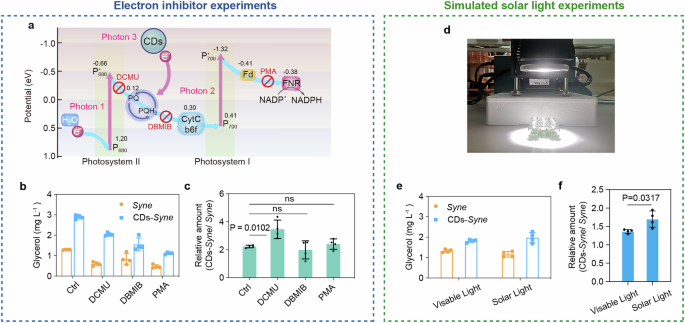
a Schematic of photoexcited electron transfer from CDs to PETC. The crosses indicate the blocking site of individual photosynthesis inhibitors. Fd ferredoxin, FNR ferredoxin-NADP+ reductase. b The glycerol production of CDs–Syne hybrids and Syne cells in the presence of photosynthesis inhibitors. c The Relative glycerol production by CDs–Syne hybrids compared to that by Syne cells in the presence of photosynthesis inhibitors. d Experimental set-up of simulated solar light irradiation by Xe lamp. e The glycerol production of CDs–Syne hybrids and Syne cells under simulated solar light irradiation and visible light irradiation. f Relative glycerol production by CDs–Syne hybrids compared to that by Syne cells under simulated solar light irradiation and visible light irradiation.
Given that CDs can behave as light converters, we studied the effect of their supplementation on cyanobacterial photosynthesis under simulated solar light irradiation using a Xe lamp (Fig. 4d). The CDs–Syne hybrids were incubated under the same intensity (1.5 mW cm−2) of either visible light or simulated solar light irradiation. A 1.7-fold increase in glycerol production was caused by the addition of CDs under stimulated solar light, which was 24% higher than that under visible light (Fig. 4e, f). This is probably due to the conversion of UV radiation to photosynthetically active radiation. Therefore, the spectral modification and photosensitization by the CDs enabled an enhancement of cyanobacterial photosynthetic efficiency.
CDs–A. thaliana improve photosynthetic efficiency
To determine whether the CDs could also enhance plant photosynthesis, we tested the effect of CDs addition on the growth of A. thaliana. Various concentrations of CDs were sprayed on the leaves of A. thaliana seedlings which were cultivated under LED light. The fresh weight and leaf area were measured after two weeks of cultivation. We observed that the CDs could successfully accumulate in the leaves of A. thaliana (Fig. 5a). No growth inhibition of A. thaliana was observed at all CDs concentrations tested, indicating a good biocompatibility of CDs. The supplementation of high concentrations of CDs (50 or 100 mg L−1) resulted in substantially improved plant growth, though the effect of a low concentration (10 mg L−1) of CDs was not significant (Fig. 5b). The plant growth was enhanced with increasing amounts of CDs, representing a high biocompatibility. At 100 mg L−1 CDs, the fresh weight of A. thaliana reached about 0.42 g, which was over 1.8-fold higher than the control without CDs (Fig. 5c). The leaf area was increased from 9.1 cm2 to 12.7 cm2 by 100 mg L−1 CDs (Fig. 5d). We explored the activity of photosynthetic system as well. The ϕPSII and ETR of A. thaliana increased by 14.5% and 18.1% with the addition of 100 mg L−1 CDs (Fig. 5e, f ), respectively, which is consistence with cyanobacteria. The maximum photochemical efficiency (Fv/Fm) was similar with various amounts of CDs (Fig. 5g), indicating a minimal influence of CD treatment on oxidative stress levels across the treated plants60. These results demonstrate CDs–A. thaliana efficiently enhanced photosynthesis and promoted growth of plant.
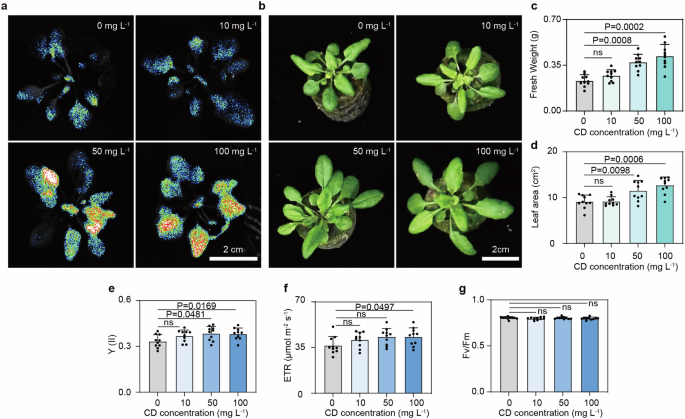
a The fluorescence photographs of A. thaliana growth with different concentrations of CDs at 7 days post the treatment. b–d The photographs (b) fresh weight (c) and leaf area (d) of A. thaliana at 14 days post the treatment with different concentrations of CDs (n = 10). e–g Quantum yield (ϕPSII), ETR and Fv/Fm of PSII in A. thaliana at 14 days post the treatment with different concentrations of CDs.
We conducted a TEA to evaluate the potential advantages of using CDs–biohybrids to enhance crop production. The analysis compared the costs and benefits of CDs-biohybrids to other developed methods, considering factors including photosynthetic efficiency, production cost, resource accessibility, human/animal toxicity, and environmental toxicity. In this analysis, our waste biomass-derived CDs were compared with several alternative materials known to enhance plant photosynthesis, including chemically derived carbon dots, and transition metal oxides (e.g., ZnO, Fe3O4, TiO2) which are less expensive and commercially available. To simplify the analysis and mitigate the inherent uncertainties at this nascent stage of development, we confined the synthesis boundary in our TEA to include only the primary consumables—chemicals, reagents, and electricity (Fig. 6a). As shown in Supplementary Fig. 16a, the use of low-cost feedstocks and straightforward solvothermal synthesis processes makes the production cost of CDs relatively economical among the compared routes, ranging from $0.14 to $0.20 per gram. This is comparable to the costs associated with non-biomass CDs, and transition metal oxides, which are respectively $0.19 to 0.30, $0.11 to 0.12 per gram. However, benefiting from the potential biocompatibility, which reduced the cost of CDs for biomass enhancement, the cost per kilogram of plant biomass increase attributed to CDs is the lowest at $0.26 to $0.44 (Fig. 6c), in stark contrast to $1.13 to $3.67, and $0.28 to $0.76 when using materials synthesized from non-biomass CDs, and transition metal oxides respectively. Based on a life-cycle perspective, biomass-derived CDs demonstrate higher photosynthetic efficiency and resource accessibility (due to the abundance of biomass waste) compared to non-biomass CDs and most of the metal-based materials (Fig. 6b, d and Supplementary Table 1). Furthermore, biomass-derived CDs have lower production cost, human/animal toxicity, and environmental toxicity as well. Those results suggest that our synthesized biomass-derived CDs are the most promising approach for enhancing plant photosynthesis.
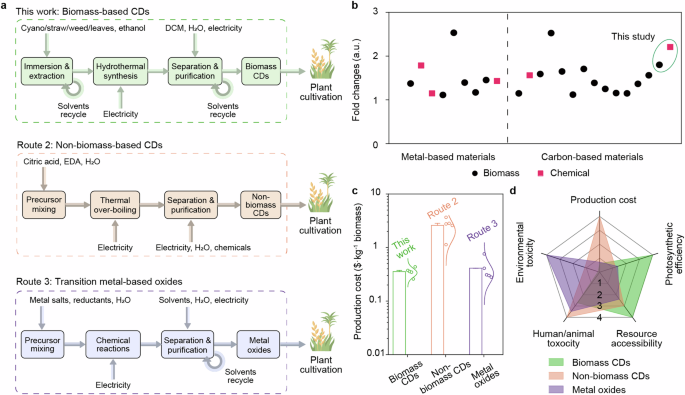
a Boundary of TEA for current nanomaterials synthesis from biomass carbon, non-biomass carbon, and transition metal oxides, and the hybrid for enhancing photosynthesis. These primarily encompass the materials, reagents, and electricity consumed per gram of nanomaterials’ synthesis. DCM, dichloromethane; EDA, ethylenediamine. b The summary of previous reports that the improvement (fold changes) of biomass or chemicals by addition of materials into natural photosynthetic organisms compared to its counterpart without materials. c Cost of producing a 1 kg increment in plant biomass by the addition of nanomaterials. Bar charts, error bars, and data distributions (n = 5, with base, maximum, minimum, median, and mean values presented as dots alongside lognormal distribution lines) were derived from 100,000 Monte Carlo simulation trials with a 5%-95% confidence interval. d Evaluation of nanomaterials in terms of production cost, photosynthetic efficiency, resource accessibility, human/animal toxicity, and environmental toxicity. The evaluation parameters are computed as their average values, and are normalized to scores ranging from 0 to 100, corresponding to classes 1 to 4 with increasing score.
Additionally, we assessed the economic benefits of employing CDs based on the market values of various economically significant plants (Supplementary Fig. 16b). While crops with lower market values, such as sugarcane, showed negligible revenue gains, higher-value plants like tobacco and tea leaves could see substantial economic benefits, generating potential revenues of $2.74 to $5.88 and $0.29 to $0.95 per kilogram respectively when CDs are used.
It is important to note that these TEA evaluations are based on small-scale laboratory experiments, which inherently carry uncertainties. To advance the practical applications of CDs in agriculture, large-scale field trials are crucial. These trials will not only confirm the feasibility of CDs for agricultural enhancement but also ensure that potential nano-scale toxicity does not pose a safety risk to crop cultivation. Looking ahead, we aim to optimize the synthesis process for biomass-derived CDs and explore more efficient delivery methods, such as advanced spraying or irrigation techniques that reduce CDs consumption, further decreasing the costs associated with their agricultural use.
Discussion
Enhancing agricultural productivity and sustainability is increasingly urgent, given the challenges posed by a growing global population, environmental degradation, and climate change. Nanomaterials have emerged as a promising solution to spearhead the agricultural technology revolution, enabling increased food production without additional environmental or energy burdens61. Although recent advances in semiconductor biohybrid systems have demonstrated improved efficiency in natural photosynthetic organisms (Fig. 6b and Supplementary Tables 1 to 9), the development of materials that combine high energy conversion efficiency, biocompatibility, and affordability remains essential for sustainable agriculture. Our results demonstrated that the simultaneous photosensitization and spectral management afforded by our CDs lead to superior photosynthetic performance, resulting in higher biomass growth and chemical production compared to other materials, with only two exceptions (Fig. 6b and Supplementary Table 1). Notably, our approach utilizes agricultural biomass waste as the sole feedstock in a novel closed-loop process, making the production of CDs both sustainable and economical.
Our study underscores the potential of nanomaterials to boost photosynthetic efficiency in crop systems by optimizing solar energy utilization. Preliminary results show that 1 gram of fresh biomass can yield approximately 10 mg of CDs (Supplementary Fig. 17). However, this conversion efficiency may need to be increased for industrial-scale production. Furthermore, the residual biomass post-CDs production could potentially be repurposed as a nutrient source for microbial fermentation, aligning with goals toward a zero-waste economy.
In future, it is critical to evaluate the efficiency and cost-effectiveness of CDs-biohybrids in practical agricultural settings, as well as their environmental impacts. These factors will determine the feasibility of scaling up CDs applications. Moreover, a deeper understanding of the mechanisms governing CDs uptake and electron transfer at the interface between CDs and the photosynthetic electron transfer chain will be crucial for future biohybrid optimizations aimed at increasing crop yields. This comprehensive approach promises not only to advance sustainable agricultural practices but also to contribute to broader environmental conservation efforts.
Methods
Culture condition of S. elongatus
The shake flask cultures of S. elongatus PCC 2973, 7942 and derivatives were performed at 30 °C under continuous LED white light (1.35 mW cm-2) in 100 mL flasks with 30 mL of BG11 medium containing 100 mM NaHCO3 and 20 mM 2-[4-(2-hydroxyethyl)piperazin−1-yl]ethanesulfonic acid (HEPES).
Preparation of CDs from four different biomass
CDs from Cyano (C-CDs). Cyano cells were cultured to an OD730 of 3 in BG11 medium. Cells pellets were collected and extracted in ethanol (1:10, w/v, 4 h in dark). Afterwards, the cell debris was removed by filtration (0.22 μm filter paper), and the filtrate was used for synthesis the C-CDs through solvothermal method39. Transferred the solution to a poly (tetrafluoroethylene) lined autoclave (50 mL) and heated in an oven at 150 °C for 4 h. After cooling down to ambient temperature, the solution was filtrated through a 0.22 μm membrane and dried by a rotary evaporator. The crude product was extracted in a mixed solution of dichloromethane and water with a volume ratio of 1:1. After standing and layering, collected the dark green lower liquid layer and dried with nitrogen gas to obtain the C-CDs. C-CDs solid was diluted with ethanol to 100 mg/mL as stock solution for further use.
CDs from leaves (L-CDs). Fresh leaves (such as mulberry leaves) were cut into small pieces and immersed in ethanol (1:3, w/v, 4 h in dark). The subsequent operation of the extraction solution is the same as C-CDs.
CDs from weed (W-CDs). Fresh weeds next to the sidewalk were collected and cut into small pieces, extracted with ethanol (1:5, w/v, over light in dark). The subsequent operation of the extraction solution is the same as C-CDs.
CDs from straw (S-CDs). Dry straw was directly soaked in ethanol (1:12.5, w/v, over light in dark). The subsequent operation of the extraction solution is the same as C-CDs.
Preparation of CDs doped with Zn (Zn-doped-CDs)
As for Zn-doped-CDs, 100 mM ZnCl2 was added to the filtrate of C-CDs before the solvothermal reaction, and the following processes were the same as above.
TEM of CDs
For the morphology characterization of different CDs (four different resources of CDs and Zn-doped-CDs, 1 mg mL−1 material in ethanol was dropped and dried onto a copper grid of 200 meshes, then TEM was detected on JEOL JEM F200 (Japan) at 200 kV. The size distribution of different CDs was calculated with Nano Measurer 1.2 software based on their own TEM images. Each sample was analyzed at least 110 particles.
FTIR of C-CDs
To determine the functional groups and molecular structure, CDs ethanol solution was dropped on KBr pellet and dry thoroughly under an infrared lamp, Fourier Transform infrared spectroscopy (FTIR) was detected on Fourier transform infrared-Raman spectrometer (Bruker, INVENIO®).
XRD of C-CDs
To determine the crystal structure of C-CDs, X-ray diffraction (XRD) was detected on Rigaku Ultima IV (Japan) at 10 ~ 80°.
XPS of C-CDs
To distinguish the elemental composition of C-CDs, X-ray photoelectron spectroscopy (XPS) was on Thermo Scientific K-Alpha (America) using Al Kα-ray at a work voltage of 12 kV using 1486.6 eV energy, and the data were calibrated using C1s at 284.80 eV.
UPS and UV-vis of C-CDs
Ultraviolet photoelectron spectroscopy (UPS, ThermoFisher Nexsa) was used to detect the work function and valence band of C-CDs, and UV-vis (HORIBA Fluorolog®-3 Spectrofluorometer, America) was used to measure the direct bandgap of C-CDs and the absorption and fluorescence spectra of samples. When detected the absorption and fluorescence spectra, CDs stock solution was diluted with ethanol or water to study the performance in different solvents.
Photocatalytic degradation of phenol using C-CDs
1000 mg L−1 C-CDs and 100 mg L−1 phenol were added into the 4 mL quartz reactors. The photocatalytic degradation reactions were performed at 25 °C under 12 mW cm-2 blue light LED. The samples were collected from quartz reactor, and the residue phenol concentrations were detected by 1H NMR (Bruker, 400 MHz). 100 mg L−1 phenol solution without CDs under the sample condition was used as the control.
CDs–Syne hybrid construction for photocurrent and electron microscope image
Syne cells were inoculated with an initial OD730 of 0.2 in BG11 medium. IPTG (1 mM) was added to the cultures at OD730 of 0.4 if need. After cells were grown for 36 h, the Syne cells were collected, washed, and resuspended in fresh BG11 medium to an OD730 about 1.5 ~ 2.0. Added 100 mg L−1 C-CDs into the Syne cultures and incubated 1 h for photocurrent and electron microscope image analysis.
CDs–Syne hybrid resin slice preparation and TEM characterization
Syne was cultured to the OD730 of 2, added 500 mg L−1 Zn-doped-CDs and incubated for 1 h. The cell pellets were collected and washed with water twice, and then fixed with 2.5% glutaraldehyde overnight at 4 °C. Syne without Zn-doped-CDs under the same conditions was used as the control.
Samples were washed with PBS (0.1 M, pH 7.0) 3 times for 15 min each, treated with 1% osmium tetroxide in PBS (0.1 M, pH 7.0) for 1–2 h and then rinsed in PBS (0.1 M, pH 7.0) three times for 15 min each. For dehydration, the samples were treated with a series of ethanol (30%, 50%, 70% and 80%) for 15 min, then exposed in acetone (90%, 95%) for 15 min and acetone (100%, 100%) for 20 min each. When preparing resin embedded samples, samples were exposed in acetone/Spurr agent (1,2,3-propanediol dehydrated glycerol ether) (1:1, v/v) for 1 h, acetone/Spurr agent (1:3) for 1 h and pure Spurr agent overnight. The samples were transferred into 1.5 mL EP tubes containing pure Spurr agent, the embedded resin blocks were obtained after 9 h at 70 °C. The resin blocks were cut to 70 ~ 90 nm ultrathin section by ultra-microtome (Leica UC7, German) with diamond knife (Daitome Ultra 45°), the sections were fished out onto copper grids of 200 meshes, then stained with both uranyl acetate for 8−15 min and lead citrate for 8−10 min. The HAADF–STEM, EDS mappings of samples on dried copper grids with the cross-sectional hybrids and dispersed Zn-doped-CDs were carried on transmission electron microscope (TEM, FEI Talos F200X, America) at 200 kV.
Redox potential and Zeta potential analysis
The Syne cells were collected and resuspended in fresh BG11 medium to an OD730 of 9. As for CDs–Syne hybrid, 100 mg L−1 C-CDs was added to the Syne cells solution and incubated for 1 h. The redox potentials of C-CDs (100 mg L−1), Syne cells and CDs–Syne hybrid were measured on a PHS-3C laboratory pH meter with a 501 OPR composite electrode (INESA Scientific InstrumentCo., Ltd, Shanghai, China). C-CDs (100 mg L−1), Syne cells and CDs–Syne hybrid were diluted 200 times before measuring the Zeta potential. Zeta potentials of those diluted samples were analyzed on Zetasizer (Malvern ZSU3200, Britain).
Photoelectrochemical analysis
Photoelectrochemical analysis was measured using electrochemical workstation (CHI1000C, Chenhua, Shanghai, China) through a standard three-electrode system in 10 mM phosphate buffered saline (PBS) electrolyte, under 0 V bias. A platinum wire and Ag/AgCl (3 M KCl) served as the counter electrode and reference electrode, respectively. The photocurrent measurements were performed using 50 mW cm-2 LED white light.
Photocurrent testing for four types of CDs
200 μL of 1.25 mg mL−1 CDs (C-CDs, L-CDs, W-CDs, S-CDs) in ethanol mixed with 0.125% nafion was dropped to a FTO electrode (1 × 1 cm2), after natural drying, detected the photocurrent and recorded with the light pulse (30 sec on and 30 sec off).
Photocurrent testing for CDs, Syne and CDs–Syne hybrid system
The working electrodes were prepared as following procedure: (1) Dropped 30 μL of 500 mg L−1 C-CDs onto a carbon paper electrode (1 × 1 cm2) and vacuum drying to form the CDs working electrode; (2) Syne cells were cultured in BG11 medium to an OD730 about 2. The Syne cells were collected and resuspended in fresh BG11 medium to an OD730 of 9. 30 μL of Syne cells solution was dropped onto a carbon paper electrode (1 × 1 cm2) and vacuum drying to form the Syne working electrode; (3) The Syne cells solution (OD730 about 9) was prepared the same above. 500 mg L−1 C-CDs was added in the cell solution and incubated for 1 h for constructing the CDs–Syne hybrid system. 30 μL of the hybrid system was dropped onto a carbon paper electrode (1×1 cm2) and vacuum drying to form the CDs–Syne hybrid electrode. The current density was recorded with the light pulse (10 sec on and 10 sec off).
Photocurrent testing for Syne cell and Syne cell lysate with and without CDs
Syne cells were cultured in BG11 medium to an OD730 ~ 2, collected and resuspended in fresh BG11 medium to an OD730 of 9. Syne cell lysate was prepared by heating the resuspended bacterial solution at 100 °C for 10 min. (1) 30 μL of Syne cells solution or Syne cell lysate was dropped onto a carbon paper electrode (1 × 1 cm2) and vacuum drying to form the working electrodes of Syne and Syne cell lysate; (2) 500 mg L−1 C-CDs was added into the cell solution (OD730 ~ 9) or Syne cell lysate, and incubated for 1 h for constructing the CDs–Syne or CDs–(Syne cell lysate) hybrid system. 30 μL of hybrid system was dropped onto a carbon paper electrode (1 × 1 cm2) and vacuum drying to form the CDs–Syne or CDs–(Syne cell lysate) electrode. The current density was recorded with the light pulse (10 sec on and 10 sec off).
Transient absorption experiment
The transient absorption set-up and experiment was performed according to our previous study50. The delay of probe was up to ~2 ns and can be tuned by a delay line. The size of pump beam and probe are ~590 µm and ~200 µm, respectively. The samples are measured in the cuvette with 2 mm optical pathlength. Pump light with an energy of 3.1 eV was used to excite C-CDs, and the electron dynamics signal in the C-CDs was observed in the 435-440 nm range of the probe light.
To quantitatively represent the transfer rate of charges, a biexponential function was used to fit the TA data:
where (N(t)) is the carrier population at the pump-probe delay of (t), ({tau }_{1}) and ({tau }_{2}) represents the charge transfer process and charge recombination process. The charge transfer process times for samples were obtained by weighting ({tau }_{1}) and ({tau }_{2}) with ({N}_{1}) and ({N}_{2}), respectively.
The growth of Syne with CDs addition
S. elongatus PCC 2973 cells were inoculated with an initial OD730 of 0.3 in BG11 medium. CDs were added to the cultured medium with specifical concentration (0, 10, 40, 80 and 160 mg L−1, respectively). The shake flask cultures were performed at 38 °C under white light (5.5 mW cm-2) in 100 mL sealed flasks with 20 mL of BG11 medium containing 100 mM NaHCO3. The growth of S. elongatus PCC 2973 was monitored by measuring the absorbance at 730 nm (OD730) at different time points. Specific growth rate was calculated using the equation:
where t1 and t0 were cultivation time and N1 and N0 were the OD730 at t1 and t0, respectively.
Oxygen evolution
The photosynthetic oxygen evolution rate of Syne and CDs–Syne were determined with a Clark-type oxygen electrode (Hansatech Chlorolab 2) according to previous reports26. Syne cells were collected from the exponential growth phase and resuspended in 2 mL BG11 medium containing 100 mM bicarbonate to an OD730 of 2. C-CDs were added to the culture medium solution with specifical concentration (0, 10, 40, 80 and 160 mg L−1, respectively). The oxygen evolution rate was firstly recorded under the light intensity of 30 mW cm−2 at 25 °C. To further explore the maximum oxygen evolution rate of Syne, the oxygen evolution rate was recorded with 40 mg L−1 C-CDs under different light intensity (7.5, 15, 30, 45, 60 mW cm−2).
The chlorophyll fluorescence of photosystems
The chlorophyll fluorescence parameters were measured using a pulsed amplitude modulation (PAM) fluorimeter (Dual-PAM 100, Walz) as previously reported26,27. Syne cells were collected from the exponential growth phase and resuspended in 2 mL BG11 medium containing 100 mM bicarbonate to a concentration of chlorophyll a at 20 mg mL−1. Cells were first incubated in dark conditions for 10 min. The light response curves were monitored to get the chlorophyll fluorescence kinetic parameters, including the relative electron transport rate (rETR (II) and rETR (I)) and the effective quantum yield (ϕPSII and Y(I)).
NADP+ and NADPH measurements
The intracellular concentration of NADP+ and NADPH were measured using NADP+/NADPH Assay Kit (Beyotime, Cat. No. S0179). 40 mL of Syne cells (OD730 = 0.3) with C-CDs (40 mg L−1) or without C-CDs were firstly inoculated for 1 h in dark, followed by light (5.5 mW cm−2) for 15 min. The cell pellets were collected, washed twice with cold PBS, and resuspended in cold PBS. The solution was divided into two vials (with the same volume). The precipitate was collected and resuspended with 0.5 mL of 0.2 M HCl (for NADP+ extraction) or 0.5 mL of 0.2 M NaOH (for NADPH extraction). The samples were first bathed in water at 55 °C for 10 min, then cooled on ice for 5 min, then neutralized with 0.5 mL of 0.1 M NaOH or HCl. Samples were then vortexed at high speed. After incubation on ice for 10 min, the samples were centrifuged at 10,000 rpm for 5 min and the supernatants were then used for assay. The concentration of NADP+ and NADPH in the solution was measured by the NADP+/NADPH Assay Kit. The intracellular concentrations of NADP+ and NADPH were calculated based on the used biomass.
Metabolite measurements
Syne cells with or without CDs were grown in shake flasks with 100 mL BG11 medium containing 100 mM NaHCO3 under white light (5.5 mW cm-2) to OD730 of ~1. Cells were collected by fast filtration on the filters. Metabolism was quenched, and metabolites were extracted by rapid transfer of the filters into −20 °C, 40%:40%:20% acetonitrile/methanol/ water with 0.1% formic acid. After incubation at −20 °C for 20 min, the samples were centrifuged, and the supernatant was collected. For ATP measurement, samples were collected by centrifugation at 8000 rpm for 2 min after 15 min of light exposure, followed by rapid quenching and extraction.
The metabolites extracted from the cells were analyzed by ultrahigh performance liquid chromatograph (UltiMate 3000, Thermo Fisher) coupled to a quadrupole-orbitrap mass spectrometer (Q-Exactive, Thermo Fisher). The injection volume was 10 μL. Solvent A was 20 mM ammonium acetate adjusted to pH 9.5 with ammonium hydroxide, and solvent B was acetonitrile. Metabolites were separated with a Luna NH2 column (100 mm × 2 mm, 3 μm particle size, Phenomenex). The column was maintained at 15 °C with a solvent flow rate of 0.3 mL min−1, and the gradient of B was as follows: 0 min, 85%; 10 min, 45%; 15 min, 2%; 18 min, 2%; 18.1 min, 85%; 24 min 85% B. The mass spectrometer with a heated electrospray ionization source was operated in positive and negative modes. The key parameters were as follows: ionization voltage, +3.8 kV/−3.0 kV; sheath gas pressure, 35 arbitrary units; auxiliary gas, 10 arbitrary units; auxiliary gas heater temperature, 350 °C capillary temperature, 320 °C. The mass spectrometer was run in full scan mode at an m/z 70–1000 scan range and 70,000 resolutions. Data processing and ion annotation based on accurate mass were performed in Xcalibur 4.0 (Thermo Fisher) and Compound Discoverer 2.0 (Thermo Fisher). A subset of identified compounds was verified by mass and retention-time match to authenticated standards.
Isotope labeling experiment
Isotope labeling experiments were performed with 13C-labeled NaHCO3 ([13C]-bicarbonate) as tracers. Labeled compounds were ≥99% pure and purchased from Cambridge Isotope Lab. Syne cells with or without C-CDs (40 mg L−1) were grown in shake flasks with 100 mL BG11 medium containing 100 mM NaHCO3 under continuous light (5.5 mW cm-2) to OD730 of ~1. Cells were collected by fast filtration and transferred to BG11 plates containing 24 mM [13C]-bicarbonate for isotope labeling experiment. At various time points after the isotope addition, Metabolism were fast quenched for LC-MS analysis of labeling of metabolites.
In addition, we designed experiments to verify whether CDs can be used as carbon nutrients. In brief, Syne cells were precultured in a medium containing 13C-labeled sodium bicarbonate (13C-NaHCO3) to ensure that all carbon atoms in the Syne cells were uniformly labeled with 13C. Subsequently, the precultured cells were inoculated into sealed shake flasks containing 13C-NaHCO3, with or without the addition of a 12C CDs, each condition has four replicates. The carbon dots (CDs) were synthesized from natural biomass, where all carbon atoms are 12C. The cultures were allowed to grow until the exponential phase, approximately reaching an optical density (OD) of 1, at which point the cells were harvested.
CO2-fixation-pathway fluxes
To quantify the CO2-fixation fluxes through Rubisco in the CB cycle, cells were switched to medium containing [13C]-bicarbonate, and the dynamic labeling patterns of PEP, RuBP, and PGA were measured as described above using LC-MS. Mass isotopomer distributions (MIDs) of metabolites were calculated from measured peak areas of the mass spectra and corrected for naturally occurring 13C. Model construction depended on the mapping of carbon atoms between substrates and products of the biochemical reactions composing the metabolic node, which is described in the following sections. The model was then used to identify the set of parameters including the fluxes or flux ratio of interest, which was compatible with the measured labeling patterns of metabolites. Parameters were fitted by minimizing the weighted sum of squared residuals (χ2) between measured and simulated labeling kinetics62. All calculations were performed in Matlab 7.8.0 (Mathworks). The flux through Rubisco was estimated with following equations:
where v1 is flux from RuBP to PGA, CPGA is PGA concentration and CO2 is 13C labeling degree of CO2.
Glycerol fermentation of engineering S. elongatus 7942 XG608
The glycerol producing strain XG60850 was cultured at 30 °C under continuous LED white light (1.35 mW cm−2) in BG11 medium containing 100 mM NaHCO3 and 20 mM HEPES. IPTG (1 mM) was added to the cultures at OD730 of 0.4. After cells were grown to the exponential phase (OD730 about 1.0−1.5), the Syne cells were collected, washed, and resuspended in fresh BG11 medium to an OD730 of required value. Added 100 mg L−1 C-CDs into the Syne cultures and incubated 30 mins under 1.35 mW cm−2 white light. Added same volume of solvent (ethanol) into the Syne cultures as the control group. The glycerol producing experiments were performed as following: (1) with the required OD730 under the same LED light intensity of 1.35 mW cm−2 in Fig. 3j, k; (2) under different LED light intensity with the same OD730 of 1 in Supplementary Fig. 15; (3) under simulated solar light with full-spectrum and visible light only (using the filter) at the intensity of 1.35 mW cm-2 by the same OD730 of 1 in Fig. 4c, d.
For the inhibitor’s experiments, the inhibitor (10 µM DCMU, 10 µM DBMIB, 200 µM PMA, 10 µM trifluoromethoxy carbonylcyanide phenylhydrazone (FCCP), and 5 mg L−1 Antimycin A) was added together with C-CDs materials, respectively. The incubation and glycerol production were performed as the same above.
Glycerol measurements
The samples were centrifuged for 10 min at 15,000 rpm and the supernatants were used for glycerol measurements by glycerol assay reagent (APPLYGEN, E1002-250, China). Briefly, the 25 µL of supernatant was added to 75 µL of working solution and incubate 30 min at 30 °C. The glycerol productions were analyzed by measured the absorption of the reaction solution at the wavelength of 550 nm.
The growth conditions of A. thaliana
A. thaliana seeds (Col-0 ecotype) were sterilized with 75% ethanol for 10 min. After rinsing with water and drying at room temperature, the seeds were placed on 1/2 MS medium (PhytoTech, M524). The seeds were kept in the dark at 4 °C for 3 days and then placed at 22 °C for germination. One week later, the seedlings were transplanted into the seedling block under the growth conditions (temperature: 22 °C; relative humidity 50-70%; light intensity: 120 μmol m−2 s−1, 12 h light /12 h darkness) for another two weeks. The seedlings with consistent growth were chosen for CDs treatment.
C-CDs was dispersed in a small amount of ethanol and then diluted to 10 mg L−1, 50 mg L−1, and 100 mg L−1, respectively. C-CDs was sprayed on the surface of the A. thaliana (10 samples for each group) leaves at the concentrations of 0 mg L−1 (as control), 10 mg L−1, 50 mg L−1, and 100 mg L−1. The C-CDs treatment was repeated every two days (seven times in total). All the plants were placed in the dark for 1 h after C-CDs spraying.
To measure the fresh weight and area of leaves in A. thaliana, the leaves were clipped and any soil on them was wiped off quickly. The fresh weight of leaves was weighed by an analytical balance (Mettler Toledo, ME802E). The area of the leaves was measured using ImageJ software. The significant differences between samples and the corresponding controls were analyzed using two-tailed Student’s t-test for pairwise comparisons, one-way ANOVA analysis with Tukey’s multiple comparison test as specified in the Figure legends. Samples sharing lowercase letters are not significantly different.
The chlorophyll fluorescence of leaves in A. thaliana measurements were conducted using the chlorophyll fluorometer Junior-PAM. Before the experiment, the Junior-PAM was prepared, and leaf samples were allowed to dark-adapt for 30 min. Subsequently, the samples were placed on a magnetic leaf clip for the experiment. To ensure accurate measurements of Fv/Fm, real-time fluorescence (Ft) was maintained below 600 by adjusting the intensity of the measurement light. The experiment followed specific operating procedures outlined in the Junior-PAM operating manual.
TEA
This work employed TEA to compare the synthesis cost and production cost of different agriculture materials for improvement of plant yield. These materials derive from biomass (this work), chemicals (route 2), and transition metal oxides (route 3), which can prompt plant photosynthesis (Supplementary Information for TEA). The synthesis cost of materials primarily stems from consumed materials, reagents, and electricity (Supplementary Tables 2, 3). The production costs of plant biomass, attributed to these materials, are primarily determined by their enhancement potency for plant growth (Supplementary Table 4). Among these consumables, electricity consumption is determined by maximizing equipment utilization efficiency under the perspective of life-cycle allocation, ensuring that the electricity consumed for materials synthesis at laboratory remains at a relatively rational level. All recyclable substances such as organic solvents/extractants, are assumed to be recycled to meet the requirements of actual industrial production, thereby minimizing the synthesis cost. The prices of bulk chemicals (e.g., ethanol, dichloromethane, trichloromethane) are sourced from the international trading market (Global Chemical Network, 2024), and the electricity prices refer to the data from the World Bank (2023). Some synthesis routes employ certain fine chemicals, the prices of which cannot be obtained from the trading market. Therefore, this work obtained the prices from several commercial chemical suppliers (Supplementary Table 5). The synthesis cost of materials (({C}_{{syn},i}), $ g−1) is calculated as shown in Eq. 1. Since most conditions of plant cultivation can essentially remain similar, the cost input for each kilogram of plant biomass increase (({C}_{{pro},i}), $ kg−1) is assumed to primarily stem from the added materials, as calculated in Eq. 2. When the CDs are used for production of other economic plants (Supplementary Table 6), the revenues (({R}_{k}), $ kg−1) are calculated as shown in Eq. 3. All cost-related data in above calculations are based on the international exchange rate and inflation level in 2023.
where the subscript i indicates different routes as shown in Fig. 6a, the subscript j indicates consumables in different synthesis routes, the subscript k indicates different economic plants as shown in Fig. 6d. ({M}_{i,j}) (g, mL, or kWh) is the quantity of consumables (e.g., materials, reagents, electricity) while ({P}_{j}) is their prices, ({Y}_{i}) (g) is the synthesized quantity of these materials. ({Delta A}_{i}) (g) indicates the quantity demand of materials for plant biomass increase (({Delta M}_{{biomass},i}), kg). ({C}_{{plant},k}) ($ kg−1) is the market prices of several economic plants.
Since these plants feature various growth rates in their whole life-cycle, it is necessary to note that Eq. 3 assumes scenarios when these plants have similar biomass growth potential over a period. All results are analyzed with parameter uncertainties (Supplementary Table 7).

Responses