Ubiquitin-specific protease 10 determines colorectal cancer outcome by modulating epidermal growth factor signaling via inositol polyphosphate-4-phosphatase type IIB

Introduction
Proteins are involved in practically every aspect of cellular functionality. As components of the cytoskeleton, they take part in maintaining structural support: As enzymes they function to catalyze a variety of biochemical reactions, as hormonal and messenger proteins they are involved in signal transduction, and as antibodies they take part in defense reactions.
In mammalian cells, the protein turnover rate is rather high: About 30% of newly synthesized proteins are degraded with a half-life of <10 min [1]. Therefore, there is no doubt that maintaining protein homeostasis needs to be tightly controlled in the cell, as both excessive protein synthesis and degradation can lead to a manifestation of various diseases, including one of the most common leading causes of death worldwide—cancer.
Colorectal cancer (CRC) is the third most common malignant disease and is one of the leading causes of cancer-related deaths in the world [2]. The prognosis of CRC has never been satisfying, especially for patients with metastatic lesions [3]. Although, surgery and chemotherapy are the first choices for cancer patients, drug resistance is one of the major reasons why chemotherapy-based treatments fail, including targeting epidermal growth factor receptor (EGFR) signaling [4,5,6].
EGFR has been shown to participate in CRC development and it has become an attractive target for therapy with two different classes of biologic agents: tyrosine kinase inhibitors (TKIs) and EGFR monoclonal antibodies (MoAbs) [6]. Gefitinib, erlotinib, and EKB-569 are the most investigated EGFR TKIs in metastatic CRC (mCRC). For example, gefitinib, a reversible selective EGFR TKI, exhibits synergistic activity when combined with chemotherapy in preclinical models [7]. Cetuximab and panitumumab, as highly effective antibodies targeting EGFR, have clinical activity in patients with mCRC. However, it has become apparent that a high number of CRC patients develop resistance to those EGFR targeting therapies [5], showing that the search for molecular targets that are involved in drug resistance development is of great importance.
It is undisputable that EGFR and its downstream protein targets are tightly regulated by post-translational modifications, including ubiquitylation. The attachment of ubiquitin to the protein substrates requires the sequential action of Ub-activating (E1), Ub-conjugating (E2), and Ub-ligating (E3) enzymes. The action of the latter can be counteracted by deubiquitinating enzymes, or simply, DUBs [8, 9]. Currently, about 100 human DUBs are known but the knowledge about their role in cancer development is limited [10, 11].
One DUB that has recently gained interest in carcinogenesis is USP10, which has been described as both an oncogene and a tumor suppressor [12, 13]. Specifically, USP10 has roles in DNA repair [14], affects AMPK [15], and is both regulated by hypoxia and regulates HIF abundance in several cells [16], thereby controlling cell viability, differentiation, and apoptosis [17, 18]. Furthermore, hypoxia can regulate EGFR expression and downstream signaling, leading to enhanced survivin expression and epithelial-to-mesenchymal transition (EMT). Although the role of USP10 in EGFR signaling is largely unknown, these data, together with findings showing that USP10 knockdown modulates EGFR turnover in EGF-treated cells [19], suggest that USP10 may directly or indirectly influence EGFR signaling. Therefore, the overall aim of the current study was to understand the role of USP10 in EGFR signaling in colorectal cancer progression.
Results
USP10 knockout alleviates aggressive phenotype in HCT116 colon cancer cells in vitro and in vivo
To gain a first insight into the role of USP10 in CRC, publicly available mRNA expression sets from CRC patients were analyzed for overall and relapse-free patient survival. The data show that high USP10 expression in patients was highly associated with reduced overall and relapse-free survival (Fig. 1A), suggesting that USP10 may be involved in tumor progression. An increased expression of USP10 is also observed in colon cancer samples vs. normal tissue when analyzing data from the TCGA database (Fig. 1B). Accordingly, the next step was to investigate whether the absence of USP10 affects cancer-related properties in human HCT116 colon cancer cells.

A Kaplan–Meier curves depicting overall survival (OS) and relapse-free survival (RFS) of colorectal cancer patients with high (red) and low (black) USP10 expression. Data were obtained from the Kaplan–Meier plotter at https://kmplot.com/analysis. B USP10 expression analysis in colorectal cancer (COAD) patient samples (red, n = 275) and normal colon samples (gray, n = 349). Log2FC cutoff 0.7. Data were obtained from GEPIA2 at https://gepia2.cancer-pku.cn. C Immunoblotting against USP10 in control and USP10 knockout (KO1 and KO2) HCT116 cells; α-tubulin served as loading control. n = 3. D Representative phase contrast images of control (Ctr)- and USP10 knockout spheroids grown in a 3D matrix for 10 days. USP10 KO is a mixture of equal amounts of USP10 KO1 and KO2 cells. Scale bar 100 μm. E Quantitative analysis of the volume (mm3) of control- and USP10 KO spheroids. Volume (V) was calculated using the formula: V = (width2 x length)/2. *p ≤ 0,05; n = 6. F Representative images of fixed and crystal violet stained control- and USP10 KO spheroids grown in 3D for 10 days. G Quantitative analysis of the number of control- and USP10 KO spheroids. *p ≤ 0,05; n = 3. H Representative images of xenografted tumors derived from control- and USP10 KO1 and KO2 HCT116 cells. I Quantitative analysis of the tumor weight. * p ≤ 0,05; n = 6.
To comprehensively evaluate the proliferative capacity of malignant cells, we employed a robust 3D tumor model using spheroids derived from both HCT116 control and USP10-deficient cells (Fig. 1C). Remarkably, our results reveal a striking difference in the growth dynamics of the two cell populations. Our data show that Ctr cells formed a higher number of spheroids that were also significantly larger in size. Importantly, this phenomenon persists across varying seeding densities, further substantiating the tumorigenic advantage of the control cells (Fig. 1D–G).
Since the above obtained data suggest that USP10 could act as a tumor promoter during carcinogenesis, we next investigated whether the USP10 knockout in cells would affect xenografted tumor growth in vivo. To do this, we injected HCT116 Ctr and USP10 KO1 and KO2 cells into the dorsal flanks of 6 nude mice. We found that all cells were giving rise to tumor formation, although the tumors derived from both USP10 KO1 and USP10 KO2 cells were significantly smaller than those derived from the Ctr cells (Fig. 1H). Similarly, when analyzing the weight of the tumors, we found that the weight of tumors derived from both HCT116 USP10 KO1 and KO2 cells, was ~ 2-fold lower compared to tumors derived from Ctr cells (Fig. 1I). At the same time, no significant difference was observed between the weights of USP10 KO1 and KO2 tumors (Fig. 1I). Together, these data suggest that USP10 is a tumor promoter in CRC.
USP10 knockout decreases HCT116 cell sensitivity to the EGFR tyrosine kinase inhibitors gefitinib and osimertinib and EGF-induced proliferation
As the above data indicated that USP10 would promote colon cancer growth, it was next tested whether USP10 would also affect the sensitivity of colon cancer cells to established anti-EGFR drugs. To investigate this, the potent tyrosine kinase inhibitors gefitinib and osimertinib were selected to assess their effects on viability and colony formation in HCT116 Ctr cells and USP10 KO cells, which were generated by pooling equal numbers of cells from the USP10 KO1 and KO2 clones.
The data obtained show that both gefitinib and osimertinib decreased cell viability in Ctr cells more than in USP10 KO cells. While gefitinib at a concentration of 10 μM inhibited cell viability in Ctr cells by about 60%, viability in USP10 KO cells was reduced by only about 20% (Fig. 2A). In addition, 2.5 mM osimertinib reduced Ctr cell viability by about 30%, whereas USP10 KO cell viability was reduced by only about 10% (Fig. 2A). Similarly, when assessing colony formation upon gefitinib treatment, we found that USP10 KO HCT116 cells formed more colonies than HCT116 Ctr cells (Fig. 2B, C).
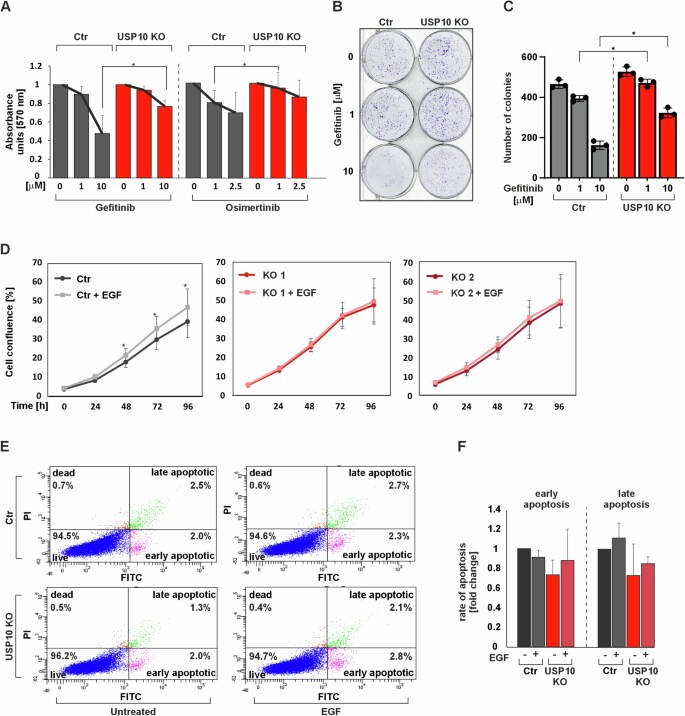
A Cell viability was assessed by measuring MTT absorbance in control (Ctr) and USP10 KO cells in the presence of different concentrations of gefitinib and osimertinib. *p ≤ 0,05; n = 3. B Representative images of the whole cell culture wells as well as single colonies formed by Ctr and USP10 KO cells treated with different concentrations of gefitinib for 10 days. C Quantitative analysis of the colony formation assay. *p ≤ 0,05; n = 3. D Live cell proliferation analysis of Ctr, USP10 KO1 and KO2 cells when serum starved and exposed to 100 ng/ml EGF. *p ≤ 0,05; n = 12. E FACS analysis of Ctr and USP10 KO cells when untreated or exposed to 100 ng/ml EGF. F Quantitative analysis of early and late apoptotic Ctr and USP10 KO cells when serum-starved or exposed to 100 ng/ml EGF. n = 3.
Since the above data indicate that the USP10 knockout cells are less sensitive to EGFR inhibitor treatment than the Ctr cells, this implies that they would also be less sensitive to the major EGFR ligand, EGF. To test this, we next measured whether USP10 knockout would affect cell proliferation in response to EGF. Indeed, we found that EGF treatment could only induce proliferation in Ctr cells; neither HCT116 USP10 KO1 nor KO2 cells responded to EGF treatment with any change in proliferation (Fig. 2D). These results suggest that USP10 knockout in HCT116 cells results in reduced sensitivity to EGF and diminishes the ability of EGFR inhibitors to reduce proliferation and colony formation.
To further support this and to exclude that the loss of sensitivity to EGF was not caused by an unexpected increase in apoptosis, flow cytometric analyses with and without EGF treatment were performed using Annexin-V-FLOUS and PI staining. The results show that EGF had no effect on apoptotic cell death in HCT116 Ctr and USP10 KO cells (Fig. 2E, F). Taken together, these data indicate that USP10 knockout in HCT116 colon cancer cells decreases their responsiveness to EGF.
USP10 regulates EGF-mediated activation of PI3K/AKT/mTOR pathway
Since the above data indicate that USP10 is involved in the EGF response, the next question was what molecular pathways might underlie this phenomenon.
As EGF is a potent stimulator of the PI3K/AKT/mTOR and MAPK/ERK pathways and dysregulation of these pathways is common in CRC, we next tested whether USP10 knockout affects EGF-dependent activation of the PI3K/AKT/mTOR and MAPK/ERK signaling pathways.
First, we examined EGF-induced phosphorylation of EGFR tyrosine 1068 (p-EGFR). Interestingly, no significant differences in basal and EGF-induced p-EGFR levels were observed when comparing HCT116 Ctr and USP10 knockout cells. In addition, total EGFR levels were similar in Ctr and both USP10 KO cell lines. These data indicate that the effects of USP10 on EGF signaling do not appear to be related to ligand-receptor binding and subsequent activation of EGFR. Since dimerization of EGFR and HER2 is often associated with a worse prognosis than to when EGFR remains as a homodimer [20], we examined HER2 phosphorylation as well as the total HER2 levels in HCT116 cells. No differences in total HER2 protein levels were detected by Western blotting, and no HER2 phosphorylation was observed upon EGF treatment. Protein levels of ERBB3 and ERBB4 could not be detected by immunoblotting in HCT116 cells (Fig. 3A).
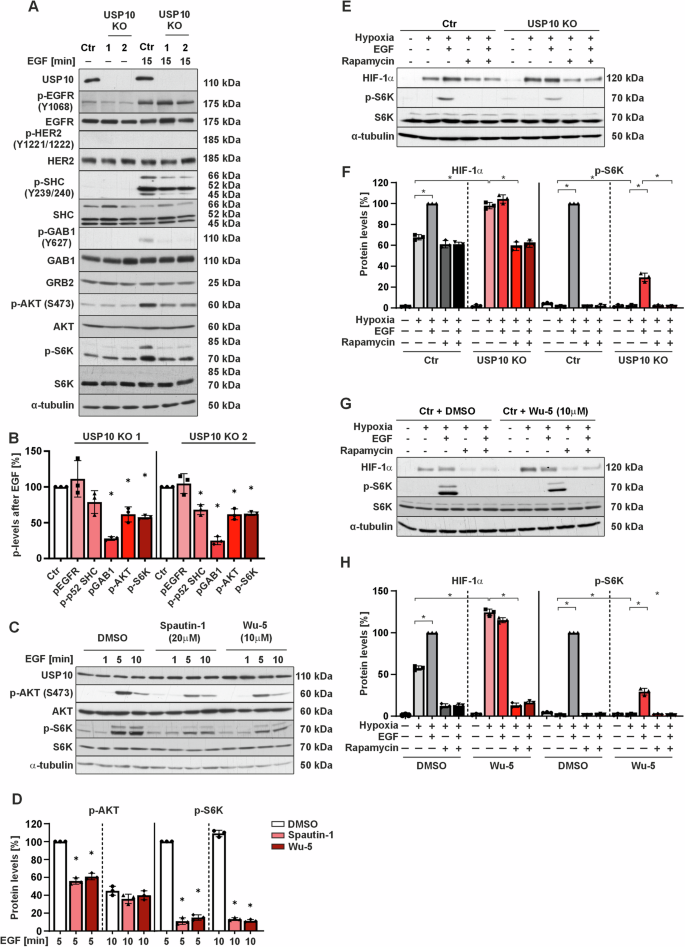
A Representative immunoblots of cell lysates from Ctr and USP10 KO1 and KO2 cells treated with EGF (100 ng/ml) for 15 min. B Quantitative analysis of p-EGFR, p-SHC, p-GAB1, p-AKT and p-S6K in Ctr vs. USP10 KO1 and KO2 cells after stimulation with EGF for 15 min. The protein levels of the corresponding phospho (p) proteins in the Ctr and USP10 KO cells were quantified and normalized to their total levels and the levels of phosphorylated proteins in Ctr cells were set to 100%. *p ≤ 0,05; n = 3. C Representative immunoblots of lysates from HCT116 cells pretreated with Spautin-1 (20 μM) and Wu-5 (10 μM) for 24 h prior to treatment with EGF for 0, 1, 5, and 10 min. D p-AKT and p-S6K protein levels were measured by Western Blot analysis. Protein levels in the control cells after 5 min treatment with EGF were set to 100%. *p ≤ 0,05; n = 3. E Representative immunoblots of protein lysates from Ctr and USP10 KO cells treated with EGF (100 ng/ml) for 15 min to detect phosphorylation of pS6 kinase, and for 4 h to detect HIF-1a protein levels. F HIF-1α and p-S6K protein levels were measured by Western Blot analysis. Protein levels in the control cells treated with EGF under hypoxia were set to 100%. *p ≤ 0,05; n = 3. G Representative immunoblots of protein lysates from HCT116 cells treated with either solvent or the USP10 inhibitor Wu-5 (10 μM) in the presence of EGF (100 ng/ml); treatment was for 15 min to detect pS6 kinase, and for 4 h to detect HIF-1α. H HIF-1α and p-S6K protein levels were measured by Western Blot analysis. Protein levels in the control cells treated with EGF under hypoxia were set to 100%. *p ≤ 0,05; n = 3.
For further signal transduction EGFR is known to interact with several adapter proteins that amplify and distribute the signal and/or regulate signal attenuation. These include growth factor receptor-bound protein 2 (GRB2), SHC-transforming protein (SHC) and Grb2-associated binder 1 (GAB1) [21]. Therefore, the protein levels of p-SHC and p-GAB1, as well as SHC, GAB1 and GRB2 in HCT116 Ctr and HCT116 USP10 KO cells were determined. It was found that, while there were no changes in the total protein levels of GRB2, SHC and GAB1, the phosphorylation level of both GAB1 and SHC was significantly lower in USP10 KO cells than in Ctr cells upon treatment with EGF (Fig. 3A, B). Thus, USP10 deficiency affects the phosphorylation of EGFR adapter proteins.
We next tested whether the observed differences were further transmitted to the level of AKT, ERK1/2, and S6 kinase isoforms. Although there was no significant difference in total AKT between Ctr and USP10 KO cells, the phosphorylation of AKT was drastically lower in USP10-deficient cells than in Ctr cells when the cells were treated with EGF. Of note, basal levels of pERK1/2 and pMEK1/2 were reduced in USP10 KO cells compared to controls. However, the EGF-dependent induction of pERK1/2 and pMEK1/2, defined as the increase in phosphorylation after EGF stimulation relative to basal levels, was similar between USP10 KO and control cells. (Supplementary Fig. S1A, B). These findings suggest that USP10 may play a role in maintaining the basal activity of the MEK/ERK signaling pathway, but it does not appear to be essential for the EGF-dependent activation of this pathway.
Interestingly, phospho-p70 and p85 S6 kinase levels were found to be increased in USP10 knockout cells compared to Ctr cells under basal conditions. However, the pattern changed upon treatment with EGF, and the phosphorylation of both S6 kinase isoforms was stronger in HCT116 Ctr cells than in USP10 KO cells. In addition, the pattern of S6 kinase activation followed that of AKT (Fig. 3A, B).
To investigate whether the observed differences between Ctr and USP10 KO cells apply only to EGF signaling or also affect signaling of other tyrosine kinase receptors such as the insulin receptor, which induces AKT, ERK1/2, and S6K, we next tested whether USP10 deficiency would evoke similar effects on AKT, ERK1/2, and S6K upon treatment with insulin. Importantly, treatment of cells with insulin did not cause any differences in the phosphorylation of AKT, ERK1/2 and p70S6 kinases in Ctr versus USP10 knockout cells, indicating that USP10 deficiency is rather selective for EGFR signaling (Supplementary Fig. S2A).
To understand to what extent the catalytic activity of USP10 is involved in the observed changes in AKT, and S6K activation, we pretreated cells with the USP10 inhibitors Spautin-1 (20 µM) which binds the catalytic cleft of USP10 and the pan-USP inhibitor Wu-5 (10 mM) for 24 h before stimulating them with EGF for 1, 5 and 10 min. Both Spautin-1 and Wu-5 were able to reduce the EGF-dependent activation of AKT and p70S6 after 5 min EGF stimulation and mimicked the pattern of AKT, and p70S6 kinase phosphorylation seen in USP10 knockout cells (Fig. 3C, D). Thus, the catalytic activity of USP10 is crucial for mediating a proper cellular response to EGF in terms of AKT, and p70S6 kinase phosphorylation.
One of our previous studies showed that lack of USP10 causes an increase in HIF-1α proteins [16] suggesting an improved response towards hypoxia. In addition to hypoxia, HIF-1α abundance in the cell is frequently upregulated in response to certain hormones, cytokines, and growth factors such as EGF. Hence, it was next tested whether USP10 deficiency would alter the induction of HIF-1α in response to EGF. The data show that although USP10 KO cells had higher basal levels of HIF-1α compared to Ctr cells, they did not increase HIF-1α in response to EGF, unlike the Ctr cells, which did show an increase (Fig. 3E, F). A similar pattern was observed when USP10 was inhibited with Wu-5 (Fig. 3G, H), further indicating that the catalytic activity of USP10 is critical for the EGF-induced increase in HIF-1α. Additionally, the EGF-mediated increase in HIF-1α in Ctr cells appeared to be translational, as mTOR inhibition by rapamycin blocked this induction. Notably, consistent with our previous study [16], rapamycin also reduced the HIF-1α increase caused by USP10 deficiency (Fig. 3E–H). To further test whether the observed EGF-mediated activation of AKT and pS6 kinases involves PI3K, which is a major upstream regulator of AKT phosphorylation, cells were pretreated with the PI3K inhibitor LY294002 (10 μM) prior stimulation with EGF. As a result, the differential phosphorylation of AKT and pS6 kinases was completely blocked in both Ctr and USP10 KO cells. This indicates that PI3K is involved in the signal transduction towards AKT and pS6 phosphorylation (Supplementary Fig. S2B).
USP10 affects INPP4B protein levels in HCT116 cells
The above data with respect to AKT, ERK1/2 and S6K activation in response to EGF indicate that USP10 is likely to affect the abundance of a protein that acts more upstream of these kinases, potentially by modulating the abundance of proteins involved in adapter protein activation. Mass spectrometry is a useful tool to identify changes in protein abundance that result from an e.g., impaired protein degradation due to USP10 deficiency. To probe into this, we performed mass spectrometry experiments with HCT116 Ctr and USP10 KO cells. The data revealed several differentially abundant proteins between Ctr and USP10-deficient cells (Fig. 4A, Supplementary Table S1 and S2), most notably inositol polyphosphate 4-phosphatase type II (INPP4B), which is known to play a pivotal role in receptor trafficking, PI3K/AKT signaling, and exerts tumor-suppressive functions [22]. In support, we discovered a negative correlation between USP10 and INPP4B expression when analyzing publicly available data from 315 colorectal cancer patients (Fig. 4B). Western blotting further confirmed that the protein level of INPP4B was increased in USP10 KO cells compared to Ctr cells; USP10 KO1 cells showed ~1.8-fold and USP10 KO2 cells ~1.5-fold higher INPP4B levels compared to Ctr cells (Fig. 4C, D). Interestingly, this regulation affected all INPP4B isoforms of ~100, ~90 and ~85 kDa, that were detected with the INPP4B-specific antibody on HCT116 cell lysates (Fig. 4C). Thus, these data strengthen the argument that USP10 deficiency may contribute to the downregulation of INPP4B, thereby highlighting a putative mechanism promoting tumorigenesis through aberrant PI3K/AKT signaling.
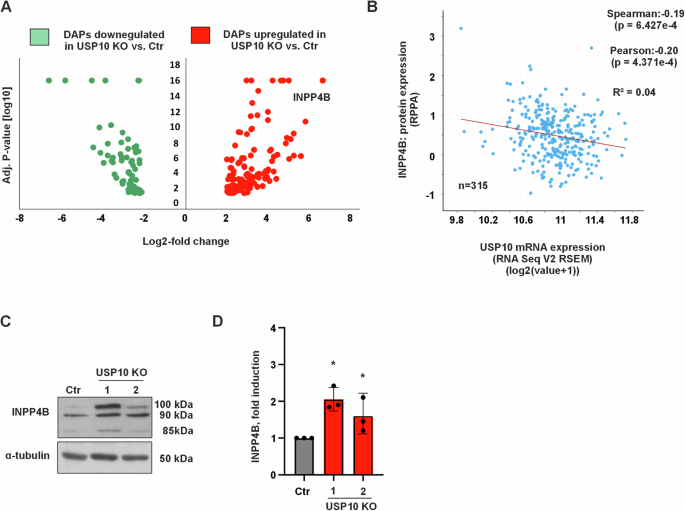
A Volcano plot of data from label-free quantification of differentially abundant proteins (DAPs) from HCT116 Ctr and USP10 KO cells. Red dots represent up‑regulated proteins with fold-change ≥ 1.8 in USP10 knockout HCT116 colon cancer cells compared to Ctr HCT116 colon cancer cells, while green dots represent down-regulated proteins with fold-change ≤ 1.8, p-value cut-off < 0.05. Black dots represent proteins with fold-change between 1.8 and −1.8, p-value cut-off < 0.05, n = 3. B Negative correlation between USP10 mRNA expression and INPP4B protein expression in colorectal cancer patients (n = 315). Data were obtained from the cBioPortal at https://www.cbioportal.org. C Representative immunoblots of INPP4B levels (three isoforms of ~100, ~90 and ~85 kDa) in Ctr and USP10 KO1 and KO2 cell lysates. D Quantification of the INPP4B protein levels in Ctr and USP10 KO1 and KO2 cells.
INPP4B counteracts USP10-mediated cellular effects in vitro and in vivo
To test whether the increased levels of INPP4B in the USP10 KO cells could be responsible for the reduced responsiveness to EGF and TKIs, we next generated HCT116 cells that were depleted of either USP10, INPP4B, or both in combination.
The INPP4B knockdown alone did not affect EGF-induced activation of AKT, whereas USP10 deficiency reduced it (Fig. 5A, B). Importantly, the combined depletion of INPP4B and USP10 could antagonize the reduced phosphorylation of AKT and S6K in response to EGF normally seen upon USP10 deficiency, without affecting the total levels of AKT or S6K (Fig. 5C, D). Thus, these results indicate that INPP4B is, at least in part, critical for USP10 modulated EGFR/PI3K/AKT signaling.
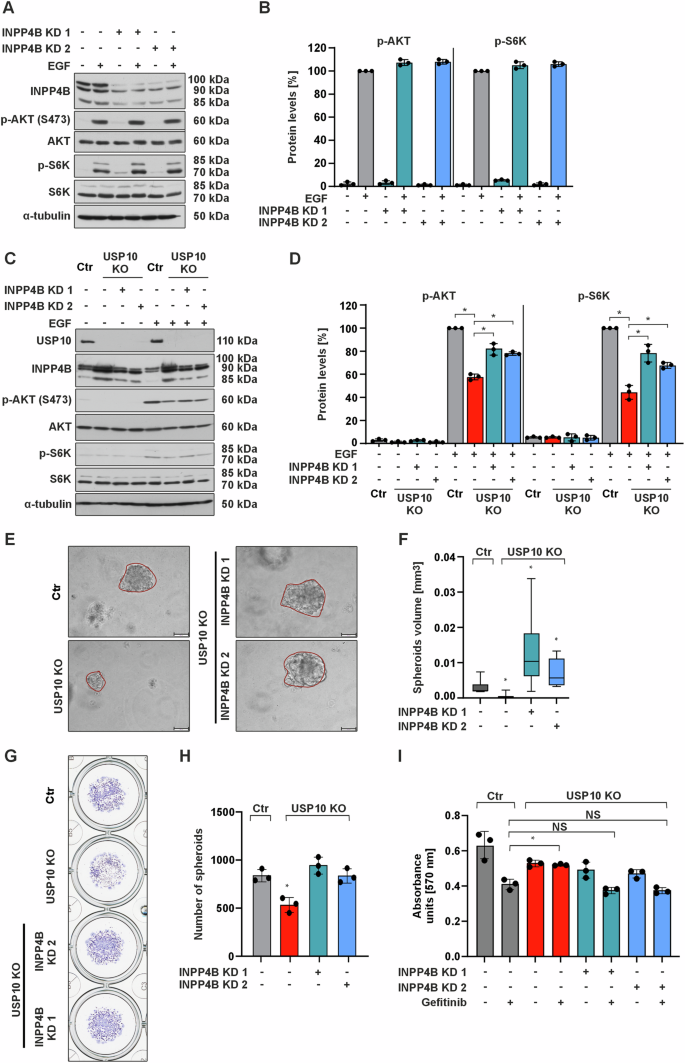
A Representative immunoblots of cell lysates from Ctr and INPP4B KD1 and INPP4B KD2 cells treated with EGF (100 ng/ml) for 15 min. B p-AKT and p-S6 kinase protein levels were measured by Western blot analysis. Protein levels in the control cells treated with EGF were set to 100%. *p ≤ 0,05; n = 3. C Representative immunoblots of lysates from Ctr, USP10 KO, USP10 KO + INPP4B KD1 and USP10 KO + INPP4B KD2 cells grown in 10% FBS, starved or treated with EGF (100 ng/ml) for 15 min. D p-AKT and p-S6 kinase protein levels were measured by Western blot analysis. Protein levels in the control cells treated with EGF were set to 100%. *p ≤ 0,05; n = 3. E Representative phase contrast images of spheroids derived from Ctr, USP10 KO, USP10 + INPP4B KD1 and USP10 + INPP4B KD2 cells grown in 3D for 10 days. Scale bar 100 μm. F Analysis of the volume (mm3) of spheroids derived from Ctr, USP10 KO, USP10 + INPP4B KD1 and USP10 + INPP4B KD2 cells. The volume (V) was calculated by using the formula: V = (width2 x length)/2. *p ≤ 0,05; n = 6. G Representative images of Ctr, USP10 KO, USP10 + INPP4B KD1 and USP10 + INPP4B KD2 cell-derived spheroids grown in 3D for 10 days and stained with crystal violet. H Quantitative analysis of the number of spheroids derived from Ctr, USP10 KO, USP10 + INPP4B KD1 and USP10 + INPP4B KD2 cells. *p ≤ 0,05; n = 3. I MTT absorbance of Ctr, USP10 KO, USP10 + INPP4B KD1 and USP10 + INPP4B KD2 cells treated with gefitinib (10 μM). *p ≤ 0,05; n = 3.
Importantly, knockdown of INPP4B in USP10 KO cells was able to rescue the size (Fig. 5E, F) and number of spheroids (Fig. 5G, H) and reduce gefitinib resistance (Fig. 5I), implying that the INPP4B USP10 connection is involved in mediating TKI sensitivity.
Next, we tested whether the increased levels of INPP4B could be involved in USP10-mediated tumorigenesis in vivo. To do this, we injected HCT116 Ctr, USP10 KO, USP10 + INPP4B KD1 and USP10 + INPP4B KD2 cells subcutaneously into the flanks of athymic nude mice.
Consistent with the previous data, we found that the weight of USP10 KO tumors was significantly decreased (~2 fold) compared to Ctr tumors. By contrast, knock down of INPP4B in USP10 KO cells could increase the tumor weight compared to tumors derived from the USP10 KO cells (Fig. 6A, B). This observation was true for both the USP10 KO + INPP4B KD1 and USP10 KO + INPP4B KD2 derived tumors.
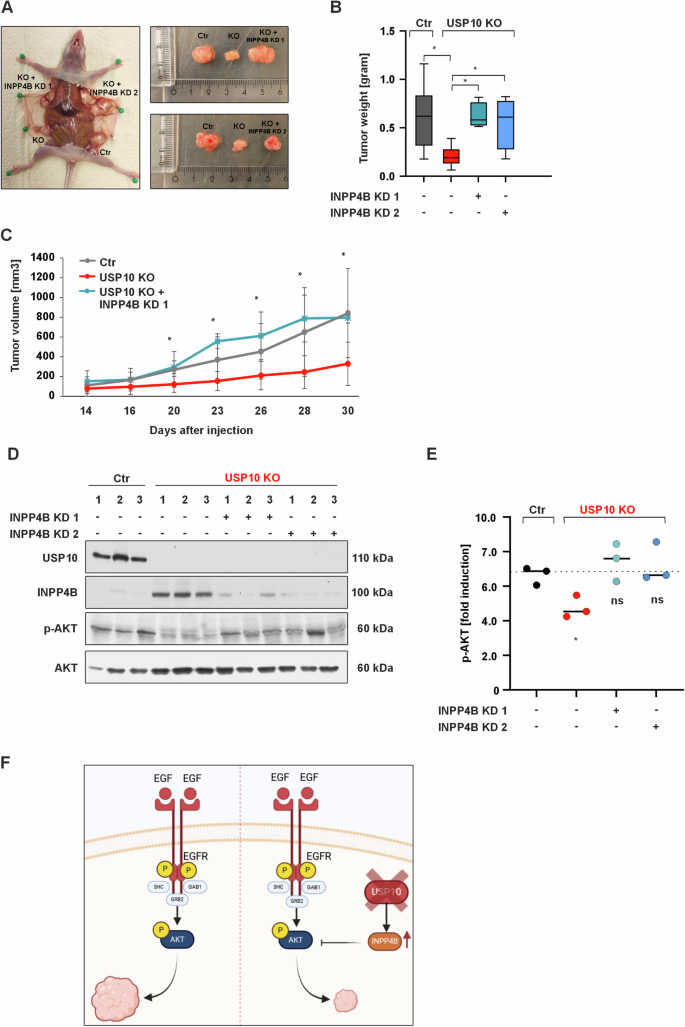
A Representative images of xenografted tumors derived from Ctr, USP10 KO, USP10 + INPP4B KD1 and USP10 + INPP4B KD2 cells. B Quantitative analysis of the tumor weight (grams). *p ≤ 0,05; n = 6. C Quantitative analysis of the tumor volume (mm3). *p ≤ 0,05; n = 6. D Representative immunoblots of lysates from Ctr, USP10 KO, USP10 KO + INPP4B KD1 and USP10 KO + INPP4B KD2 cell-derived tumors. E Quantitative analysis of p-AKT in tumor lysates. *p ≤ 0,05; n = 3. F Graphic summary showing how USP10 deficiency inhibits tumor growth via upregulation of the PI3K/AKT inhibitor INPP4B.
When the tumor tissues were examined for activation of AKT and ERK1/2, we found that USP10-deficient tumors had decreased levels of AKT, and ERK1/2 phosphorylation compared to tumors derived from Ctr cells. However, simultaneous knockdown of INPP4B and USP10 (Fig. 6D, E) could rescue the phosphorylation of AKT and partially that of ERK1/2 (Supplementary Fig. S1E).
Collectively, these findings support the notion that USP10 mediated INPP4B regulation is an important hub during CRC tumorigenesis.
Discussion
In the present study, we have unraveled the intricate role of USP10, a key member of the deubiquitinase (DUB) family, in the context of EGF signaling in colon cancer. Our results show a significant reduction in spheroid and tumor growth in USP10-deficient colon cancer cells. Notably, reduced USP10 expression correlates with decreased sensitivity to the EGFR tyrosine kinase inhibitor gefitinib and impaired activation of AKT1/PKB after EGF stimulation. Interestingly, we identified the phosphoinositide phosphatase INPP4B as a key mediator of these effects. Furthermore, our in vivo transplantation study in nude mice clearly demonstrates the indispensable role of USP10 in cooperation with INPP4B in carcinogenesis. While the marked reduction in tumor growth in vivo in USP10-deficient cells underscores the importance of USP10 in promoting carcinogenic processes, deletion of INPP4B emerges as a viable rescue mechanism. While our work once again highlights the complexity of the colorectal cancer landscape and the role of USP10 therein, it also opens the door to a nuanced discussion of the multiple treatment options that may arise from the identification of the USP10-INPP4B interplay.
The role of USP10 for growth processes is underscored by studies from USP10 knockout mice, which demonstrated that these mice die within 1 year after birth due to deficiency of all three blood cell lineages – red cells, white cells, and platelets [23]. This profound impact on hematopoiesis emphasizes USP10’s indispensable function in maintaining essential physiological processes. Furthermore, USP10 has been implicated in various types of cancer, although the intricate causal relationships have often lacked clear elucidation. Therefore, conflicting observations have arisen, indicating that USP10 can function as both tumor promoter and suppressor in the same cancer type. For example, it was shown that overexpression of USP10 promoted tumorigenesis in solid cancers such as glioblastoma multiforme, non-small-cell lung cancer, hepatocellular carcinoma (HCC), and colon cancer as well as leukemias such as T-cell leukemia, and chronic myeloid leukemia (CML) [18, 24,25,26,27,28]. Conversely, decreased expression of USP10 has been reported to trigger tumorigenesis in HCC, colon cancer, and gastric carcinoma (GC) [29].
Until now, no mutations that are causally responsible for tumorigenesis have been found in the USP10 gene. Thus, the role of USP10 as a bona fide oncogene or tumor suppressor gene is uncertain, although a more indirect tumor promoting role can certainly be assumed. For example, in acute myeloid leukemia (AML), USP10 selectively stabilizes the mutant FMS-related receptor tyrosine kinase 3 FLT3-ITD by deubiquitylation [26]. Similarly to the EGFR tyrosine kinase, depletion of USP10 in Ba/F3 and MOLM14 AML cells led to a reduction of the critical regulator of FLT3, the tyrosine kinase SYK [26]. Therefore, depending on the cellular context, USP10 appears to modulate the PI3K/AKT/mTOR pathway effectively and influences various signaling relays regulated by tyrosine kinases.
Of particular importance is the finding of reduced AKT1 activation in USP10 knockout cells. Furthermore, previous research has shown that the PI3K/AKT/mTOR pathway is activated by EGF [30] and plays an important role in both the acquisition of drug resistance and the initiation of metastasis in CRC [31, 32]. These findings are consistent with the results of our current study, in which the absence of USP10 resulted in increased sensitivity to the EGFR tyrosine kinase inhibitor gefitinib.
The current data shows an increase in INPP4B levels in USP10 KO cells, further supporting the link between EGFR signaling and PI3K/AKT pathway regulation. Since INPP4B functions as a negative regulator of the PI3K/AKT pathway, high levels of INPP4B in USP10 KO cells should reduce or prevent EGFR signaling with respect to PI3K/AKT activation. This finding from the current study again confirms the involvement of these two proteins in EGFR signaling. Downregulation of INPP4B protein and mRNA expression has been observed in prostate cancer, where it is associated with accelerated biochemical recurrence, lower recurrence-free survival, tumor stage, and worse patient outcome [33, 34]. Additionally, another discovery has shown that INPP4B is also down-regulated in colorectal cancer and contributes to the development and progression of CRC [35]. This is partially consistent with the findings of the present study, where knockdown of INPP4B in USP10 KO cells restored EGF-induced AKT activation and tumor growth in nude mice.
Overall, the multitude of findings obtained in this study using USP10-deficient colon cancer cells provide evidence for the role of USP10 in promoting tumorigenesis and open the door to a more sophisticated discussion of the multifaceted treatment options that may arise from the identification of the USP10-INPP4B interplay. Our current findings suggest that USP10 may be involved in colon carcinogenesis by modulating the EGFR signaling pathway through the INPP4B phosphatase and may represent a novel therapeutic target.
Materials and methods
Chemicals
All biochemicals were of analytical grade and were obtained from commercial suppliers. Cultrex BME, Type II was purchased from Biotechne R&D Systems (Minneapolis, MN, USA) rapamycin and cycloheximide from Merck (Darmstadt, Germany), LY294002 from Alexis Biochemicals (Lausen, Switzerland), Wu-5 from Glixx Laboratories (Hopkinton, MA, USA), Spautin-1 and human recombinant EGF from Cayman Chemical (Ann Arbor, MI, USA), gefitinib and osimertinib from LC Laboratories (Woburn, MA, USA). All substances were dissolved in DMSO. Cells were treated with 100 nM rapamycin, 25 µg/µl cycloheximide, 10 µM Wu-5, 20 µM Spautin-1, 100 ng/ml EGF and 1–10 µM gefitinib or 1–2.5 µM osimertinib.
Mass spectrometry
To analyze the proteome of the HCT116 Ctr and USP10 knockout cell lines, the cell lines were plated on 10 cm dishes and proteins were isolated after 36 h. Then SDS-PAGE and Coomassie staining were performed and fractionation of the gel was followed by in-gel digestion of the proteins with trypsin to measure the proteome of the HCT116 cell lines using an HPLC-MS/MS Orbitrap Fusion Lumos Tribrid mass spectrometer (Thermo Fisher Scientific Waltham, MA, USA). After the sample was run through the mass spectrometer, the data were collected in. raw files and processed using Proteome Discoverer 2.2 software (Thermo Fisher). The mass spectrometry proteomics data have been deposited to the ProteomeXchange Consortium via the PRIDE partner repository with the dataset identifier PXD052294.
Cell 2D culture and maintenance
The human colon cancer cell line HCT116 (RRID: CVCL_0291) was purchased from American Type Culture Collection (ATCC) and all experiments were performed with mycoplasma-free cells. USP10 knockout was generated with the help of CRISPR/Cas9 technology. INPP4B knockdowns in USP10 knockout HCT116 cells were achieved by using INPP4B shRNA expressing vectors and a respective scrambled vector. All cells were maintained in 75 cm2 culture flasks at 37 °C and 95% humidity under normoxia in Dulbecco’s modified Eagle’s medium (DMEM) (Merck) supplemented with 10% fetal bovine serum (FBS) (Merck), 1% non-essential amino acids (Merck) and 0.5% ciprofloxacin hydrochloride (MP Biomedicals, Santa Ana, CA, USA).
CRISPR/Cas9-mediated gene editing of USP10
The clustered regulatory-interspaced short palindromic repeats CRISPR/Cas9 nuclease approach was used to generate a cell line deficient in USP10 as described before [16]. A missense sequence (targeting a scrambled sequence OG from OriGene) was selected as a corresponding negative control.
Generation of stable cell lines expressing INPP4B shRNAs
To achieve INPP4B knockdown in USP10 knockout cells, the 293 T(-D10) packaging cells were transfected with either the lentiviral pLKO.1 vector or the lentiviral pLKO.1 vector containing the target gene (pLKO.1-INPP4B-shRNA1 and pLKO.1-INPP4B-shRNA2). Transfection was performed using Lipofectamine 2000 (Thermo Fisher Scientific Waltham, MA, USA) according to the manufacturer’s protocol, together with pVSVG envelope and pPAX2 Gag:Pol:Tat. The virus-containing supernatant batches were collected and lentiviral infection was performed.
Western blot analysis
Protein samples from 2D cultured cells were collected as described before [16]. To collect protein from the cells grown in 3D culture, cells together with Cultrex were first disassembled mechanically in ice cold PBS until the Cultrex was fully dissolved and centrifugated. For the extraction of proteins from tissue, 40 mg of sample were minced in 300 µl lysis buffer for 3 min using the tissue homogenizer TissueLyser LT (Qiagen, Venlo, Netherlands). The analytical separation of proteins depending on their molecular weight was carried out in polyacrylamide gels according to Laemmli [36]. Electrophoretic separation of the proteins was followed by transfer to a nitrocellulose membrane (GE Healthcare, Chicago, IL, USA). The membranes were incubated for 60 min in 1x PBS-T buffer with 5% fat-free milk, followed by an incubation with the primary antibody at 4 °C overnight. Secondary anti-mouse (BioRad, 170–6516, 1:5000) and anti-rabbit (BioRad, 170–6515, 1:5000) HRP-conjugated antibodies were used after. The ECL Western Blotting Detection Reagent (GE Healthcare). Films were scanned and analyzed using the ImageJ software for quantification.
Cell proliferation assay and colony formation assay
For the real-time quantitative cell proliferation analysis, the cells were seeded onto 96-well plates (3 × 10³ or 5 × 10³ cells per well). Plates were transferred to the IncuCyte S3 System (Essen BioScience, Ann Arbor, MI, USA) for live phase contrast imaging of cell confluence for at least 72 h at 3-h intervals. Where indicated, cells were starved overnight in media containing 3% FBS before the proliferation assay, and then repeatedly treated with 100 ng/ml EGF every 24 h. Confluence analysis was performed using the default settings of the IncuCyte software.
For colony formation assay, HCT116 cells were seeded into 6-well plates at a density of 1.000 cells/well and allowed to settle for 6 h. Subsequently, the medium was changed, and cells were treated with Gefitinib (1 µM, 10 µM). Every second day, the medium containing Gefitinib (1 µM, 10 µM) was replaced. After 10 days, the cells were fixed with 4% paraformaldehyde (PFA) and stained with crystal violet (Applichem). Plates were scanned and analyzed using ImageJ software.
3D culture
1000 to 10,000 HCT116 cells were dispersed in 60 mL of Cultrex. Subsequently, 10% FBS containing DMEM was added to each well and the spheroids were cultured for up to 10 days. Spheroid growth was monitored using an Olympus cellSens (Olympus, Tokyo, Japan) phase-contrast live cell/time lapse imaging system equipped with a 20x UPLSAPO objective. The cell mixture was placed in the center of a 24-well plate and allowed to solidify at 37 °C for 15 min. Spheroid number and size were manually scored using ImageJ software.
Flow cytometric analysis of cell viability
To determine the ratio of live, apoptotic, and necrotic cells, fluorescent double staining with Annexin-V-FLUOS and PI was performed according to the instructions provided with the Annexin-V-FLUOS Staining Kit (Merck). 1 × 10⁶ cells were washed with 1 x PBS before being resuspended in 100 μl Annexin-V-FLUOS labeling solution and incubated for 20 min at room temperature prior to analysis. Data were collected using a BD LSR-Fortessa (Becton Dickinson, Franklin Lakes, NJ, USA) flow cytometer and analyzed using the FlowJo 10.7.1 program.
Drug cytotoxicity MTT assay
Cell viability was assessed by the MTT [3-(4,5-dimethylthiazol-2-yl)-2,5-diphenyl tetrazolium bromide] reduction assay. Cells were plated on 96-well plates (1 × 10⁴ cells per well) and cultured in a humidified incubator. Gefitinib (1 µM, 10 µM) and Osimertinib (1 µM, 2,5 µM) were added to the plates. Three days later, the MTT assay was performed at 37 °C for 40 min. Formazan crystal formation was determined spectrophotometrically at a wavelength of 570 nm using a TECAN Spark (Tecan, Männedorf, Switzerland) plate reader.
Xenograft mouse model
1 × 10⁶ or 0.5 × 10⁶ HCT116 Ctr and HCT116 USP10 knockout cells were injected subcutaneously into flanks of female athymic nude mice (Envigo, Indianapolis, IN, USA). Mice were housed in IVC cages for up to 6 weeks. Animals were euthanized by CO2 inhalation, and tumors were harvested for weighing and preparation of protein samples for Western blotting. Tumor volume was calculated using the following formula: volume = (width2 × length)/2. All animals were housed at the Laboratory Animal Center of the University of Oulu in dedicated pathogen-free facilities with a 12 h light/dark cycle, a constant temperature of 22 °C, and food and water ad libitum and experimental protocols were approved by the Animal Experiments Committee of Finland.
Analysis of publicly available data
Kaplan–Meier curves for colon cancer patients were generated with the Kaplan-Meier plotter online software tool [37]. Box plots using TCGA and GTEx data were generated using GEPIA2 [38]. The expression data were log2(TPM + 1) transformed and the log2FC was defined as median (tumor) – median (normal). p-values were calculated with one-way ANOVA comparing tumor with normal tissue.
Statistical analyses
Data in this study were analyzed with GraphPad Prism 9.3.1. (GraphPad Software, La Jolla, Ca, USA) and Microsoft Excel. Within the whole study all values are expressed as mean ± standard deviation (SD), whereas statistical significance for two groups was determined using the two-tailed Student’s t-test.
Ethics approval and consent to participate
All protocols for animal use and experiments were approved by the National Animal Experimental Board of Finland (ELLA) as well as the Animal Welfare Body of the Laboratory Animal Center under the license ESAVI-5491-2022 and conducted according to the EU directive 2010/63/EU on the protection of animals used for scientific purposes.


Responses