TFCP2L1 drives stemness and enhances their resistance to Sorafenib treatment by modulating the NANOG/STAT3 pathway in hepatocellular carcinoma

Introduction
Hepatocellular carcinoma (HCC) is a highly malignant tumor with a poor prognosis, characterized by a 5-year survival rate of only 20% in clinical practice [1, 2]. Its recurrence and metastasis rates are notably high, affecting nearly two-thirds of patients within 5 years of diagnosis [3, 4]. Despite the introduction of molecularly targeted drugs such as Sorafenib and lenvatinib, significant challenges persist due to strong drug resistance, recurrence, and metastasis [5,6,7]. Previous studies have highlighted similarities between tumor cells and pluripotent stem cells, such as embryonic stem cells (ESCs), in terms of self-renewal, proliferation, and plasticity [8]. In addition, it is widely acknowledged that tumors can originate from specific populations of cancer stem cells (CSCs), which typically remain in a quiescent state within the tumor cells under normal conditions but possess the ability to rapidly self-renew and replenish damaged tumor cell populations when disrupted [9, 10]. Therefore, CSCs are considered to be one of the root causes of metastasis, recurrence, and drug resistance, making their elimination a promising clinical strategy [11, 12]. However, the precise mechanisms governing CSC self-renewal and their functional maintenance in HCC remain contentious and poorly understood. Thus, further research is essential to elucidate the biological mechanisms underlying the role of CSCs in HCC progression and recurrence, and to develop targeted therapeutic strategies.
Given the high degree of similarity between CSCs and ESCs, insights into ESC self-renewal mechanisms may provide more insights into CSC biology. In this regard, our previous research identified Tfcp2l1 as a key gene for ESC self-renewal, regulated by the Wnt/β-catenin signaling pathway [13]. Another investigation extensively explored TFCP2L1’s role in maintaining mouse and human ESC self-renewal [14]. However, its specific function in tumors, particularly in CSCs, remains unclear. Herein, our present study aims to elucidate the role of TFCP2L1 in tumor cells and CSCs, specifically in HCC.
TFCP2L1, a member of the TFCP2 subfamily, shares structural similarities with TFCP2 and UBP1, featuring an N-terminal DNA-binding domain and a C-terminal sterile alpha motif domain crucial for protein dimerization [15]. Notably, TFCP2L1 exhibits tissue-specific expression, predominantly in ESCs and adult kidney cells [16]. Recent investigations have reported elevated TFCP2L1 expression in certain tumors; however, its role remains contentious, with limited studies in HCC.
Building on our previous findings, this study investigates the expression of TFCP2L1 in HCC CSCs and observes that it is significantly upregulated. Knockout experiments demonstrate that TFCP2L1 depletion markedly diminishes HCC stem cell formation capacity. Furthermore, we identify Ti3, a specific small molecule targeting TFCP2L1’s active domain, which enhances HCC cell sensitivity to Sorafenib. These findings strongly suggest that TFCP2L1 functions in HCC similar to its role in ESCs. Thus, targeting TFCP2L1 represents a promising strategy to enhance the efficacy of targeted therapies in HCC, addressing current challenges in clinical outcomes.
Materials and methods
Patients and specimens
The HCC tissues used for constructing tissue microarrays (TMAs) were obtained from 124 consecutive patients diagnosed with HCC via pathological examination. These patients underwent surgical resection at the Third Affiliated Hospital of Sun Yat-sen University between September 2003 and September 2010. Additional HCC tissues, including both tumor and adjacent liver tissues for qRT-PCR analysis, were collected from patients undergoing surgical resection at the same hospital between January 2018 and January 2023. Inclusion criteria included histologically confirmed HCC, no prior oncological treatments, comprehensive follow-up data, and availability of paraffin-embedded specimens. Normal liver tissue was obtained from the surrounding liver tissue of a hemangioma patient after surgical resection, with the patient testing negative for related liver or systemic diseases. This study was approved by the Human Ethics Committee of the Third Affiliated Hospital of Sun Yat-sen University.
TMAs construction
TMAs were constructed following established protocols [17]. Briefly, two cores were sampled from the selected tumor area per case. Using a hollow needle, cylindrical tissue cores (1.0 mm in diameter) were extracted from donor tissues. These tissue cores were then precisely arrayed in a recipient paraffin block using an automated TMA instrument (Beecher Instruments, Silver Spring, MD, USA).
Acquisition and preprocessing of the TCGA data
RNA-Seq data for HCC (LIHC) were obtained from the Cancer Genome Atlas (TCGA) database (https://portal.gdc.cancer.gov/). This dataset included RNA-Seq profiles from 374 HCC tissues and 50 normal liver tissues, along with associated gene expression data and clinical information [18]. Initially formatted as Fragments Per Kilobase per Million (FPKM), the RNA-Seq data were converted to Transcripts Per Million (TPM) and subsequently underwent log2 transformation.
Cell lines and culture
The Huh7 cell line was previously stored in our laboratory. Hep3B, 97L, 97H, and SK-Hep-1 cell lines were purchased from the Cell Bank at the Institute of Biochemistry and Cell Biology, China Academy of Science (Shanghai, China). All cell lines were cultured in Dulbecco’s modified Eagle’s medium (DMEM) or Roswell Park Memorial Institute 1640 medium supplemented with 10% fetal bovine serum (FBS). Cultures were maintained at 37 °C in a humidified atmosphere containing 5% CO2. All cell culture reagents were sourced from Life Technologies (Thermo Fisher Scientific, USA).
Plasmid construction
The coding regions of TFCP2L1 were cloned from cell cDNA with Phanta Max Super-Fidelity DNA Polymerase (Vyzame, Nanjing, CHN) and inserted into the piggyBac vector. For RNA interference in HCC cells, shRNA constructs were designed to target 21 base-pair gene-specific regions of TFCP2L1 and then cloned into pLKO.1-TRC plasmid. For gene knock-out in HCC cells, gRNA construsts were designed to target the CDs region of TFCP2L1 and cloned into lentiCRISPR v2 plasmid.
Cell trancfection and virus package
For gene overexpression, HCC cells were transfected with 1 μg piggyBac inserted with mentioned genes plus 1 μg transposase vector using lipofectamine3000 (Invitrogen, USA). Drug selection was begun at next day with 2 μg/ml puromycin added. For gene knockdown experiment, pLKO.1 based lentiviral vectors and packaging plasmid psPAX2 and VSV-G were transfected into 293FT cells using Lipofectamine3000. Supernatant was harvested after 48 h and passed through 0.45μm filters (Millipore, USA). HCC cells were infected by the viral supernatant in the present of 8 μg/ml polybrene (sigma, USA) for 24 h. Drug selection was begun two days after virus infected. For gene knockout experiment, Plasmid LentiCRISPR v2 which target TFCP2L1 gene was constructed followed the protocol, then lentivirus were packaged and harvested. HCC cells were infected and selected by puromycin. Then 100 cells were transferred into 96-well plates for monoclonal screening. At last, the obtained cell lines were identified and subsequent to do next experiments. Guide RNAs (gRNAs) were designed using DESKGEN (https://www.deskgen.com/landing/).
Western blotting
Cells were lysed in RIPA lysis buffer containing a protease inhibitor cocktail (Bimake, USA). All protein lysates were quantified using a quantitative bicinchoninic acid protein assay. Then proteins were separated by SDS-PAGE gel and transferred onto PVDF membrane (Millipore, USA). PVDF membranes were blocked with 5% nonfat milk for 1 h and incubated with relevant primary antibodies overnight at 4 °C, and incubated for 2 h at room temperature with the appropriate secondary antibodies. The blots were developed using ECL reagents (Advansta, USA). The fluorescence signals were recorded with a luminescent image analyzer (Bio-Rad, USA).
Real-time PCR
Total RNA was extracted using TRIzol Reagent (Invitrogen, USA), cDNA was synthesized from 1 μg of total RNA using cDNA synthesis kit (Vazyme, CHN) according to the manufacturer. Relative gene expression levels following different treatments were determined using RealStar Green Mixture (Genstar, CHN) in a LightCycler 480. GAPDH or 18S RNA were used as internal control. The expression values of target genes were calculated by using the 2-ΔΔCt method. The primers used are listed in Supplementary Table S1.
Cell proliferation assay
For the proliferation assay, control and modified HCC cells were plated in triplicated into 96-well plate with 2000 cells per well. At the indicated time points, 10 μl of cell counting kit 8 (CCK-8) solution (Dojindo, Japan) was added into each well according to the manufacturer’s instructions.
Colony formation assay
HCC cells were plated in triplicate in 12-well plate (2000 cells/well) and cultured for one week. After fixation with methanol for 15 min, the colonies were stained with 0.5% crystal violet for 15 min, washed three times with PBS. The colonies were counted in 5 random microscopic fields per well.
Cell invasion assay
Cell invasion ability was evaluated by Transwell plate (Corning, USA). HCC cells subjected to different treatments were seeded in the upper chamber with Matrigel-coated membrane, and the lower chambers were supplied with DMEM containing 15% FBS to act as chemo-attractant. Cells that had already migrated or invaded to the lower surface of membrane were fixed and stained with crystal violet. The invaded cells were counted in 5 random microscopic fields per well.
Cell apoptosis assay
Cell apoptosis was analyzed by flow cytometry using annexin V-FITC. Apoptosis detection kits (BD, USA) were used according to the manufacturer’s instruction. Briefly, cells were harvested and suspended in binding buffer (1×). an aliquot of 100 μl was incubated with 5 μl annexin V-FITC and 5 μl propidium iodide (PI) for 15 min in the dark. The stained cells were analyzed by flow cytometry (BD, USA) within 30 min.
Sphere formation assay
HCC cells were seeded in triplicate into 12-well Ultra-Low Attachment plate (Corning, USA), 500 cells per well, and cultured with tumor sphere medium which containing DMEM/F-12, 50× B27 (Invitrogen, USA), 20 ng/ml human recombinant bFGF and 20 ng/ml EGF for 10 days. Then spheres were photographed and counted with microscope.
Limiting dilution assay
For in vitro limiting dilution assay, indicated Hep3B and 97 L cells were seeded at a density of 100, 50, 20, 10, 5, 1 per 96-well plate and cultured by sphere formation medium. The cells were cultured for 2 weeks. The frequency of CSC was determined by the LDA software (http://bioinf.wehi.edu.au/software/elda/).
Immunohistochemistry
The paraffin-embedded HCC samples were cut into 4μm thick sections. After deparaffinizing and rehydrating the sections and blocking endogenous peroxidase activity, the sections were boiled in a citrate antigen retrieval solution for 20 min in an electric pressure cooker for antigen retrieval. The sections were then incubated overnight with primary antibody in wet box at 4 °C. Next day the sections were washed three times by PBST buffer and incubated with secondary antibody for 30 min at 37 °C. Diaminobenzidine (DAB) staining was used for detecting immunoreactivity (Dako, Japan). Counter staining was performed using hematoxylin (Keygen Biotech, CHN). This study was authorized by the Institutional Research Ethics Committees of the Third Affiliated Hospital of Sun Yat-sen University, and informed consent was obtained from all patients for research purposes.
TUNEL staining assay
For the TUNEL assay, sections were deparafinnized and apoptotic cells were detected using the In Situ Cell Death Detection Kit (Roche) and counterstained with DAPI.
Luciferase reporter assay
Distinct lengths of the NANOG promoter fragment were subcloned into the pGL3-basic vector. There different vectors were co-transfected with pRL-TK to normalize the transfection efficiency. Luciferase activity was measured using the Dual-Luciferase Reporter Assay System (Promega, USA) according to the manufacturer’s instructions.
In vivo animal assays
Male Balb/c nude mice (6 weeks of age) received single subcutaneous flank injection of HCCs suspended in 100 μl PBS after randomly grouped. Tumor growth was monitored by bi-dimensional measurements using a caliper. Tumor-bearing mice were sacrificed 4 weeks after inoculation, and the tumors were removed for further study. Animal study was approved by the Institutional Research Ethics Committees of the Third Affiliated Hospital of Sun Yat-sen University.
Statistical analysis
Statistical analyses were performed using SPSS 18.0 software. Experiment values for continuous variables are expressed as the mean ± standard error of the mean. Chi-squared tests, Student’s t tests were used when appropriate to evaluate the significance of differences between groups. The relationships between TFCP2L1 expression and TTR or OS were analyzed using Kaplan-Meier survival curves and log rank tests, respectively. P < 0.05 was considered statistically significant.
Results
Expression level of TFCP2L1 in liver tissue is inversely correlated with HCC patient survival
To investigate the impact of TFCP2L1 expression on disease prognosis, we analyzed tumor RNA expression data from the TCGA database. Our findings indicated that HCC patients with high TFCP2L1 expression had significantly shorter overall survival compared to those with low expression (Fig. 1A). Moreover, high TFCP2L1 expression showed a trend towards shorter disease-specific survival times (Fig. 1B), suggesting that high TFCP2L1 expression in HCC tissues is associated with poor prognosis in patients. Furthermore, we also investigated TFCP2L1 gene expression in HCC tissues compared to adjacent normal liver tissues from the TCGA dataset. Our findings consistently showed significantly higher levels of TFCP2L1 expression in cancerous tissues. Moreover, paired samples from the same patients confirmed increased TFCP2L1 expression in tumor tissues compared to adjacent non-cancerous liver tissues, highlighting its potential role in HCC progression.

A Kaplan–Meier curve analysis depicting overall survival (OS; p = 0.022) in HCC patients based on high and low TFCP2L1 expression levels in TCGA cohorts. B Kaplan–Meier curve analysis illustrating disease-specific survival (p = 0.085) in HCC patients stratified by high and low TFCP2L1 expression using TCGA cohorts. C Immunohistochemical staining showing TFCP2L1 expression in tumor and adjacent normal liver tissues. D Representative images demonstrating high and low TFCP2L1 expression in tumor tissues. E, F Kaplan-Meier curve analysis presenting overall survival (OS; p = 0.001) and progression-free survival (PFS; p = 0.014) in HCC patients based on high and low TFCP2L1 protein expression levels in immunohistochemical staining (Red arrowhead indicates low nuclear expression; blue arrowhead indicates high nuclear expression). G Quantitative analysis of TFCP2L1 mRNA expression levels in liver tissues from HCC patients by qRT-PCR analysis (n = 16 paired samples, p = 0.0053). H Western blot analysis showing representative TFCP2L1 protein levels in adjacent normal tissues and tumor tissues from 10 HCC patients.
Further analysis of patients with poor prognostic indicators, such as those who had passed away or underwent palliative surgical resection, revealed significantly elevated TFCP2L1 expression in their tumor tissues. To delve deeper into the prognostic implications, we utilized TMAs to assess TFCP2L1 protein expression in 124 surgically treated HCC patients. Consistently, TFCP2L1 protein levels were found to be markedly higher in cancerous tissues compared to adjacent normal liver tissues (Fig. 1C, D). Importantly, patients with high TFCP2L1 protein expression exhibited significantly reduced overall survival and disease-free survival times compared to those with low expression levels (Fig. 1E, F). Multivariate analysis revealed TFCP2L1 as an independent prognostic factor for overall survival in HCC, with its expression also correlating with larger tumor size (Table S1 and S2). Validation studies using HCC tumor tissues and adjacent tissues further confirmed elevated TFCP2L1 expression in cancerous versus non-cancerous tissues (Fig. 1G, H). These findings collectively suggest TFCP2L1’s crucial role in the development and progression of HCC.
TFCP2L1 expression increased in HCC tissues and cells
CSCs are characterized by their ability to self-renew, metastasize, and initiate tumors. To explore the role of TFCP2L1 in liver CSCs, we first analyzed its protein and mRNA expression levels in various HCC cell lines, including Huh7, Hep3B, 97 L, 97H, and SK-Hep-1 (Fig. 2A, B). Subsequently, we assessed the stem cell properties of each cell line by quantifying sphere formation, limiting dilution assay, and examining the expression of stem cell surface markers on sphere cells. Our findings demonstrated a correlation between TFCP2L1 expression levels and the number of spheres formed, as well as an increase in the proportion of CD133/CD90 double-positive cells within the spheres. Specifically, cell lines such as 97 L and SK-Hep-1, which exhibited high TFCP2L1 expression, formed significantly more spheres and higher frequency of stem cells compared to Huh7 cells with low TFCP2L1 expression (Fig. S1A, B). Moreover, the proportion of CD133/CD90 double-positive cells in spheres derived from 97L and SK-Hep-1 cells increased by 6.55 and 5.17 times, respectively, compared to adherent cells, whereas Huh7 sphere cells only increased by 1.8 times (Figs. 2C and S1C–G). These results suggest that elevated TFCP2L1 expression enhances the stemness of HCC cells.
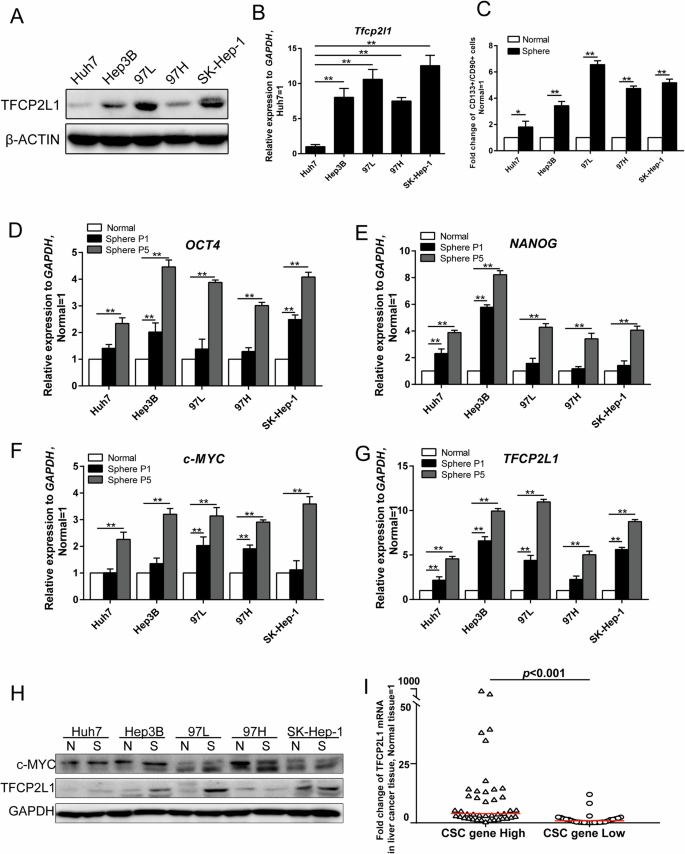
A Western blot analysis of TFCP2L1 protein expression levels in different HCC cell lines, with β-ACTIN used as a loading control. B qRT-PCR analysis of TFCP2L1 mRNA expression levels in different HCC cell lines. C Quantification of CD133 and CD90 double-positive cells by flow cytometry after culturing different HCC cell lines in tumor sphere-forming medium for 12 days. D–G qRT-PCR analysis showing mRNA expression levels of OCT4, NANOG, c-MYC, and TFCP2L1 in various types of HCC spheres across different passages. H Western blot analysis depicting c-MYC and TFCP2L1 protein expression levels in different HCC cell lines, with GAPDH used as a loading control. I Fold change in TFCP2L1 mRNA expression levels in liver tissues of HCC patients with varying expression levels of CSC genes. The data are presented as mean ± SD of three independent experiments. *p < 0.05; **p < 0.01; ns no significance, compared with the control group.
Next, we further investigated the expression of NANOG, OCT4, and c-MYC, key regulators associated with CSC induction and maintenance, alongside TFCP2L1. Our results indicated significantly higher mRNA levels of these genes in spheres compared to adherent cells, with their enrichment becoming more pronounced over successive passages (Fig. 2D–G). Additionally, we observed increased sphere formation ability and sphere cell diameter with passages (Fig. S2A, B). Protein analysis confirmed elevated levels of TFCP2L1 and c-MYC in spheres (Fig. 2H). To validate our findings in clinical samples, we extracted mRNA from 70 HCC tissue samples and conducted qRT-PCR to assess the expression changes of CSC genes (NANOG, OCT4, c-MYC) and TFCP2L1 relative to normal liver tissues. Samples showing CSC gene mRNA expression more than two times higher than the control group (normal liver tissue) were categorized as the high expression group, while others were classified as the low expression group. Comparison of TFCP2L1 mRNA fold change in tumor tissue versus normal liver tissue revealed significantly higher expression in the high CSC gene expression group compared to the low expression group, with statistical significance (Fig. 2I). Collectively, our findings indicate a positive correlation between TFCP2L1 expression and the stemness of HCC cells, suggesting its involvement in the maintenance and self-renewal of HCC CSCs.
TFCP2L1 overexpression increased HCC cell proliferation, clonogenicity, sphere formation, and invasion abilities
To explore the potential role of TFCP2L1 in HCC tumorigenesis in vitro, we transfected HCC cell lines Hep3B and 97L with a PiggyBac (PB) transposon-based vector expressing TFCP2L1 (Fig. 3A). Our findings revealed that TFCP2L1 overexpression significantly enhanced cell proliferation compared to control cells, as assessed by a CCK8 assay (Fig. 3B). Additionally, TFCP2L1 overexpression in Hep3B and 97 L cells increased clonogenicity, as demonstrated by cell colony formation assays. To evaluate the impact of TFCP2L1 on stem cell-like properties, we conducted sphere formation assays using transfected cells. Our results showed a marked increase in both the number and size of spheres formed by TFCP2L1-overexpressing Hep3B and 97L cells compared to controls (Fig. 3C–F). Furthermore, limiting dilution assays (LDA) indicated that TFCP2L1 overexpression elevated the probability of sphere formation (Fig. S2C). We further investigated the effect of TFCP2L1 on tumor cell invasiveness using transwell assays. The number of migrated cells significantly increased in TFCP2L1-overexpressing Hep3B and 97 L cells (Fig. 3G, H). Given that tumor stemness is often associated with drug resistance, we evaluated the half-maximal inhibitory concentrations (IC50) of Sorafenib in HCC cells overexpressing TFCP2L1. Our results demonstrated a notable increase in the IC50 of Sorafenib in cells overexpressing TFCP2L1 compared to control cells (Fig. 3I).
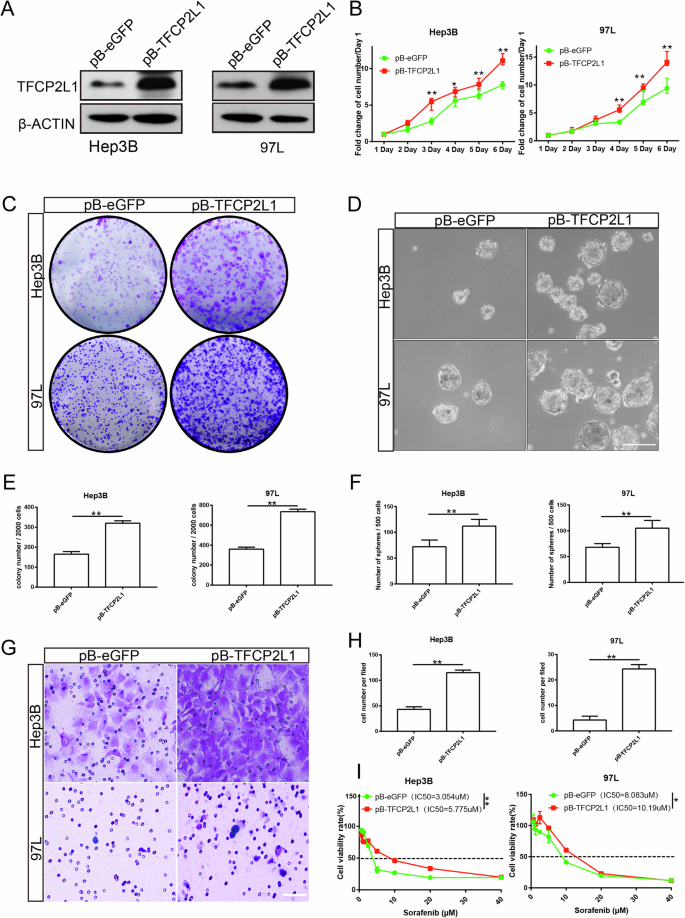
A Western blot analysis showing the effect of TFCP2L1 overexpression in Hep3B and 97L cell lines. B Cell viability of Hep3B and 97L cells overexpressing TFCP2L1 assessed by CCK-8 assay at indicated time points. C Colony formation assay demonstrating increased clonogenicity of Hep3B and 97 L cell lines with TFCP2L1 overexpression. D Representative images of sphere formation assay in Hep3B and Huh7 cells with TFCP2L1 overexpression. Scale bar = 100 μm. E, F Quantitative analysis of colony formation (E) and sphere formation (F) assays. G Representative images of transwell invasion assay showing enhanced invasion of Hep3B and 97L cells overexpressing TFCP2L1 compared to empty vector control. Scale bar = 100 μm. H Quantitative analysis of cell invasion. I IC50 values of Sorafenib in indicated HCC cell lines after 48 h, evaluated using Compusyn. The data are presented as mean ± SD of three independent experiments. *p < 0.05; **p < 0.01; ns no significance, compared with the control group.
TFCP2L1 knockdown decreased HCC cell proliferation, clonogenicity, sphere formation, and invasiveness
To assess the impact of TFCP2L1 knockdown in HCC cells, we used lentiviral vectors encoding three specific short hairpin RNAs (shRNAs) targeting TFCP2L1 mRNA to infect Hep3B and 97L cells. After selection with appropriate drugs, we confirmed the stable reduction of both TFCP2L1 mRNA and protein levels (Fig. 4A, B). Among the tested shRNAs, TFCP2L1-sh#2 and TFCP2L1-sh#3 demonstrated high knockdown efficiency and were chosen for subsequent experiments. TFCP2L1 knockdown in Hep3B and 97L cells resulted in fewer colonies formed and a reduced proliferation rate compared to the scramble control group (Fig. 4C–E). Moreover, TFCP2L1 knockdown led to decreased numbers and sizes of spheres in the sphere formation assay (Fig. 4F, G). Limiting dilution assays (LDA) further confirmed a lower probability of sphere formation following TFCP2L1 knockdown (Fig. S2D). Additionally, migration assays showed a decrease in the number of migrated cells upon TFCP2L1 knockdown in both cell lines (Fig. 4H, I). These findings collectively indicate that TFCP2L1 plays a critical role in promoting the proliferation, sphere formation, and invasiveness of HCC cells. Moreover, TFCP2L1 emerges as a potential biomarker and promising therapeutic target in HCC. Furthermore, the reduced IC50 of Sorafenib observed in HCC cells following TFCP2L1 knockdown suggests a potential strategy to enhance drug sensitivity in HCC treatment (Fig. 4J).
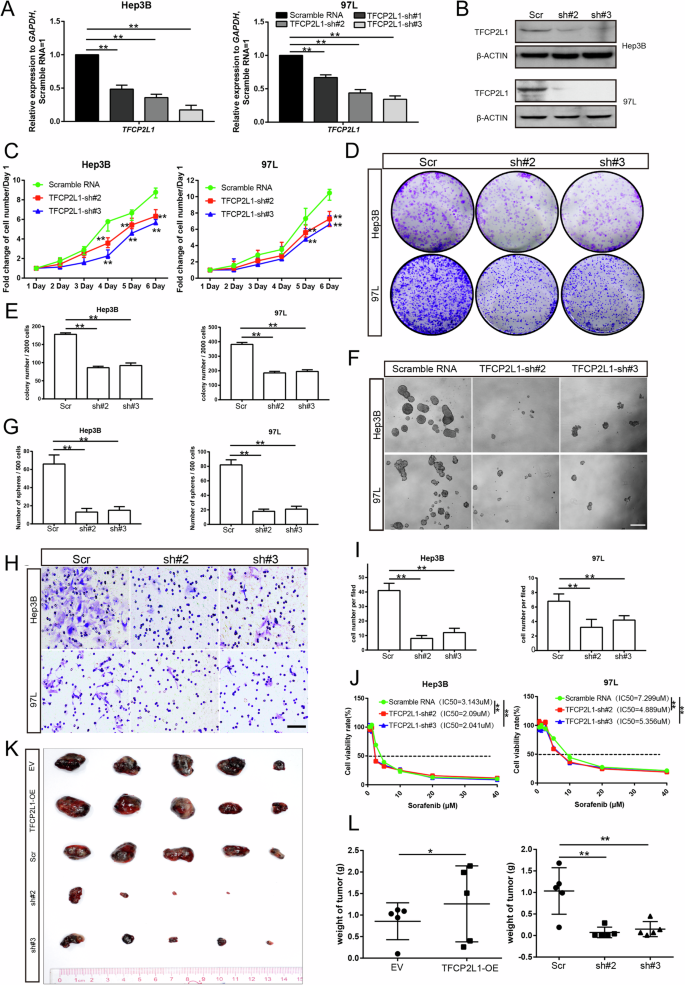
A qRT-PCR analysis showing the effect of TFCP2L1 knockdown in Hep3B and 97 L cell lines. B Western blot analysis confirming TFCP2L1 knockdown in Hep3B and 97 L cell lines. C Cell viability of Hep3B and 97 L cells with TFCP2L1 knockdown assessed by CCK-8 assay at indicated time points. D Colony formation assay demonstrating reduced clonogenic potential of Hep3B and 97L cell lines with TFCP2L1 knockdown. E Quantitative analysis of colony formation assay. F Representative images of sphere formation assay in Hep3B and 97L cells with TFCP2L1 knockdown. Scale bar = 100 μm. G Quantitative analysis of sphere formation assay. H Representative images of transwell invasion assay showing decreased invasion of Hep3B and 97 L cells with TFCP2L1 knockdown compared to scramble RNA control. Scale bar = 100 μm. I Quantitative analysis of cell invasion assay. J IC50 values of Sorafenib in indicated HCC cell lines after 48 h, evaluated using Compusyn. K Photograph of xenograft tumors derived from modified Hep3B cells at the final time point after subcutaneous injection into nude mice. L Statistical analysis of the final weight of xenograft tumors derived from indicated Hep3B cells at the endpoint. The data are presented as mean ± SD of three independent experiments. *p < 0.05; **p < 0.01; ns no significance, compared with the control group.
TFCP2L1 regulates tumor growth in vivo
In vivo experiments confirmed the role of TFCP2L1 in tumor growth regulation. Subcutaneous implantation of 5 × 10⁶ Hep3B cells overexpressing TFCP2L1 and control (vector) cells into nude mice revealed that after 6 weeks, mice injected with TFCP2L1-overexpressing Hep3B cells developed significantly larger tumors compared to those injected with control cells. Conversely, the tumor volume in the TFCP2L1-knockdown group was notably reduced compared to the scramble control group (Fig. 4K and L). These findings underscore the regulatory impact of TFCP2L1 in vivo.
The N-terminus and CP2-like domain are required for the regulatory function of TFCP2L1
To identify the essential domain of TFCP2L1 required for its regulatory function, we generated four mutant TFCP2L1 proteins lacking the N-terminus (ΔNT), CP2-like domain (ΔCP2), SAM-like domain (ΔSAM), or C-terminus (ΔCT) (Fig. 5A), as previously described. These flag-tagged mutant forms of TFCP2L1 were successfully overexpressed in both Hep3B and 97 L cells (Fig. 5B). Functional assays demonstrated that TFCP2L1ΔSAM and TFCP2L1ΔCT could mimic the effects of full-length TFCP2L1, enhancing migration, colony formation, and sphere formation compared to the vector control group. In contrast, TFCP2L1ΔNT and TFCP2L1ΔCP2 failed to induce clonogenicity and invasiveness in Hep3B and 97 L cells (Fig. 5C–E). These results indicate that TFCP2L1’s regulatory role in HCC cells relies on its N-terminus and CP2-like domain. Moreover, LDA experiments demonstrated that overexpression of TFCP2L1ΔNT and TFCP2L1ΔCP2, but not TFCP2L1ΔSAM and TFCP2L1ΔCT, resulted in loss of the ability seen with full-length TFCP2L1 to increase the probability of spheroid formation (Fig. S2E, F). The statistical analyses of the invasion assay, colony formation assay, and sphere formation assay are shown in Fig. 5F–H.
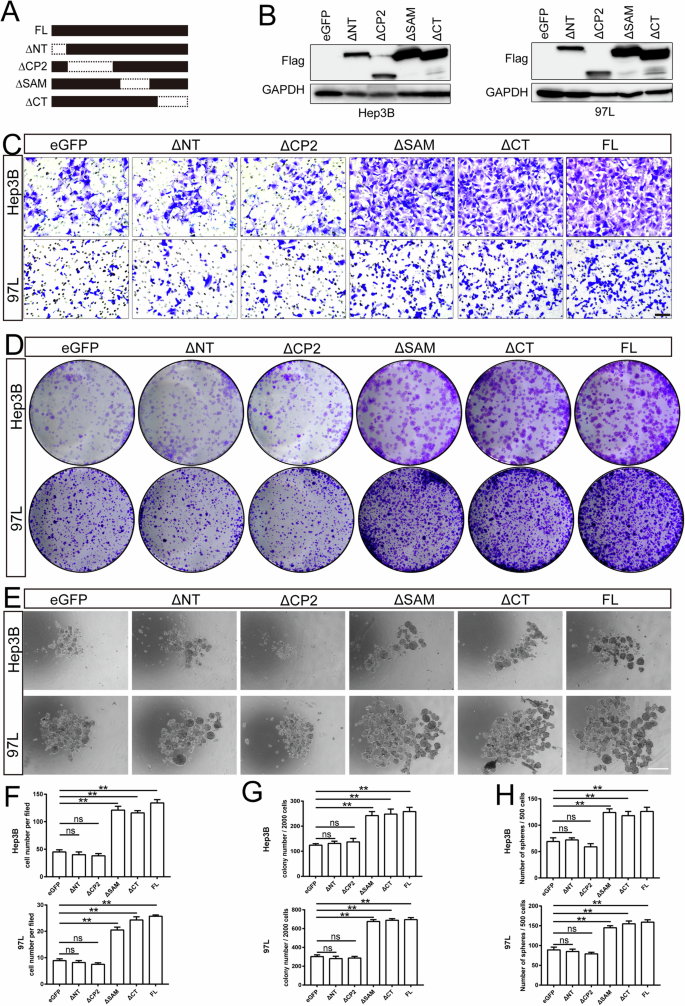
A Schematic representation of TFCP2L1 domains. B Western blot analysis showing overexpression of different TFCP2L1 mutants in Hep3B and 97L cell lines. C Representative images of transwell invasion assay in indicated cell lines, with empty vector as the control group. Scale bar = 100 μm. D Colony formation assay of indicated cell lines, with empty vector as the control group. E Representative images of sphere formation assay in indicated cell lines. Scale bar = 100 μm. F–H Quantitative analysis of cell invasion (F), colony formation (G), and sphere formation (H) assays. The data are presented as mean ± SD of three independent experiments. *p < 0.05; **p < 0.01; ns no significance, compared with the control group.
TFCP2L1 regulates HCC cell proliferation and invasion partially by the NANOG/STAT3 signaling pathway
To elucidate the regulatory mechanism of TFCP2L1 in HCC cells, we conducted western blot analysis to assess the expression of stemness-related proteins and the phosphorylation status of STAT3, AKT, and ERK. TFCP2L1-overexpressing cells demonstrated significantly elevated levels of phosphorylated STAT3 and AKT compared to the control group, while total STAT3 and AKT levels remained unchanged. Conversely, TFCP2L1 knockdown markedly attenuated STAT3 and AKT phosphorylation (Fig. 6A–D). Notably, no significant changes were observed in ERK phosphorylation throughout this process. Furthermore, we observed a concurrent increase in NANOG expression upon TFCP2L1 overexpression, which decreased correspondingly following TFCP2L1 downregulation (Fig. 6E, F). However, the expression levels of CTNNB and c-MYC did not show significant alterations under these conditions, and OCT4 was undetectable by Western blotting in these cells.
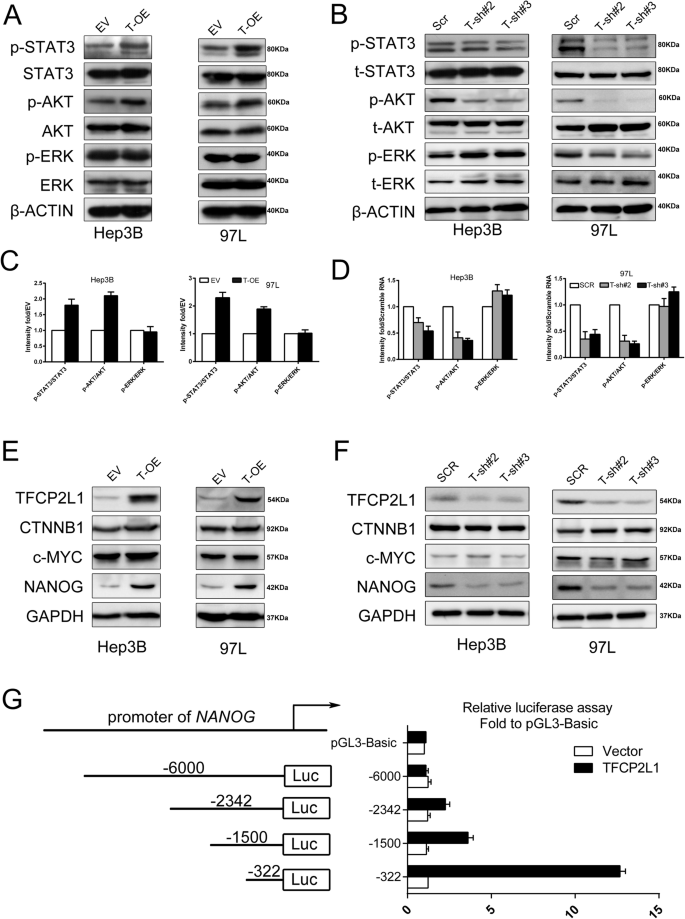
A Western blot analysis of total and phosphorylated levels of STAT3, AKT, and ERK after TFCP2L1 overexpression in Hep3B and 97L cells. B Western blot analysis of total and phosphorylated levels of STAT3, AKT, and ERK after TFCP2L1 knockdown in Hep3B and 97L cells. C Quantitative analysis of phosphorylation levels in panel A. D Quantitative analysis of phosphorylation levels in panel B. E Western blot analysis showing expression levels of CTNNB1, c-MYC, and NANOG after TFCP2L1 overexpression in Hep3B and 97L cells. F Western blot analysis showing expression levels of CTNNB1, c-MYC, and NANOG after TFCP2L1 knockdown in Hep3B and 97L cells. G Promoter activity of the NANOG gene measured using Dual-luciferase reporter assay. The cells were transfected with pGL3-basic or various lengths of the 5′-flanking region of the NANOG gene, as indicated. The data are presented as mean ± SD of three independent experiments. *p < 0.05; **p < 0.01; ns no significance, compared with the control group.
Given previous reports indicating that NANOG can independently activate the STAT3 and AKT pathways in various cell types, we hypothesized that TFCP2L1 might regulate NANOG gene transcription in HCC cells by interacting with its promoter. To investigate this hypothesis, we cloned different lengths of the NANOG promoter region into the pGL3 vector (−6k/+1, −2342/+1, −1.5k/+1, and −322/+1) and conducted dual-luciferase reporter assays. Our results indicated that the maximum luciferase activity was observed with the pGL-322 construct, suggesting that the core regulatory site of TFCP2L1 may reside within the −322/+1 region of the NANOG promoter (Fig. 6G). Together, these findings suggest that TFCP2L1 plays a crucial role in activating the STAT3 and AKT pathways, potentially through upregulation of NANOG expression in HCC cells.
Specific inhibitor of TFCP2L1 and Sorafenib combination synergistically targets HCC cells in vitro
To identify a small molecule capable of selectively inhibiting TFCP2L1 function, we conducted a virtual screening of a molecular library containing over 200,000 compounds using Schrödinger software (Fig. 7A). From this screening, we selected the top nine potential compounds for further experimentation (Table S3). Hep3B and 97 L cells were individually treated with these nine compounds, and the expression levels of NANOG and OCT4 were assessed by qRT-PCR (Fig. S3). Among them, compound number 3 (termed Ti3) exhibited significant suppressive effects, reducing both the number and size of spheres compared to the control group (Fig. S4).
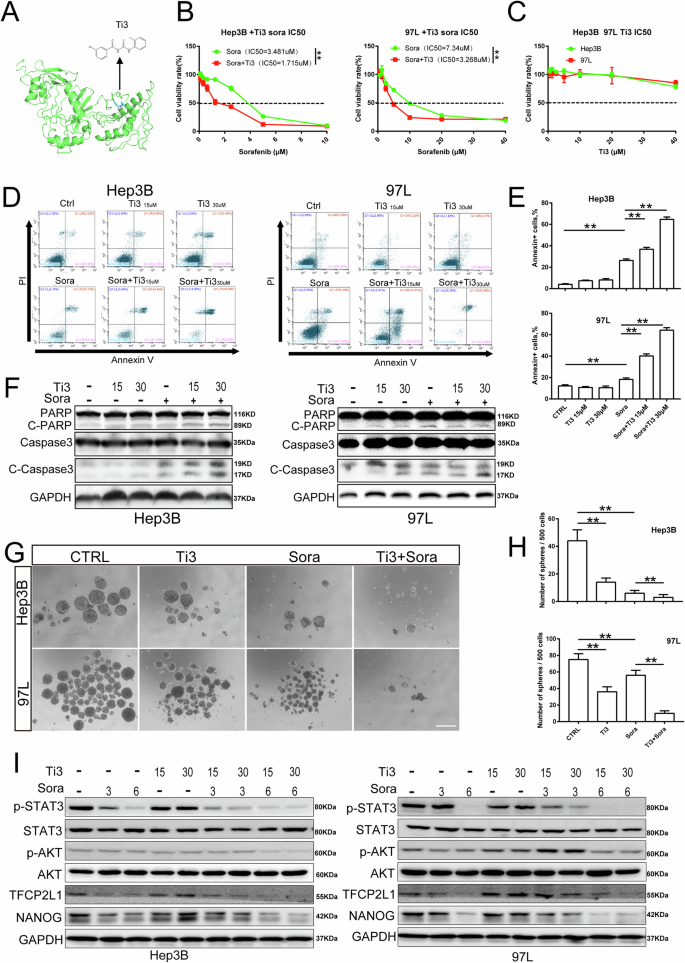
A Structural formula of Ti3, a specific inhibitor of TFCP2L1. B IC50 values of Sorafenib in the indicated HCC cell lines for 48 h with or without Ti3. C IC50 values of Ti3 in the indicated HCC cell lines for 48 h were evaluated using Compusyn. D Cell apoptosis of HCC cell lines treated with Ti3, Sorafenib, and their combination at different concentrations as assessed by flow cytometry. E Quantitative analysis of apoptotic cells in panel D. F Expression of cleaved-PARP, PARP, cleaved-Caspase3, and Caspase3 after treatment with Ti3 or Sorafenib at indicated concentrations in HCC cell lines detected by western blotting. G Representative image of sphere formation assay in indicated cell lines treated with Ti3, Sorafenib, and their combination. Scale bar = 100 μm. H Quantitative analysis of sphere formation in panel G. I Expression of p-STAT3, STAT3, p-AKT, AKT, TFCP2L1, and NANOG after treatment with Ti3 or Sorafenib at indicated concentrations in HCC cell lines detected by western blotting. The data are presented as mean ± SD of three independent experiments. *p < 0.05; **p < 0.01; ns no significance, compared with the control group.
Interestingly, we observed that Sorafenib, a standard drug for HCC, exhibited enhanced anti-cancer activity when combined with Ti3. Our data showed that the half-maximal inhibitory concentrations (IC50) of Sorafenib on HCC cell lines were reduced in the presence of Ti3. Although both Hep3B and 97L cells were sensitive to Sorafenib alone, they demonstrated increased sensitivity when treated in combination with Ti3 (Fig. 7B, C).
To explore the effects of this combination on cell viability inhibition, we subjected HCC cells to different treatments followed by Annexin V-FITC/PI double-staining and flow cytometry analysis. The results showed that the combination treatment group had more Annexin V-positive cells compared to the Sorafenib-only group. Importantly, treatment with Ti3 alone did not significantly increase the number of Annexin V-positive cells compared to the control group (Fig. 7D, E). Annexin V-positive cells include apoptotic and some necrotic cells, suggesting that Ti3 enhances Sorafenib’s inhibition of cell viability, possibly through the combined induction of apoptotic pathways.
Moreover, to further validate these findings, we assessed the expression of apoptosis-related proteins following treatment with Ti3, Sorafenib, or their combination. Our results demonstrated that co-treatment with Ti3 and Sorafenib significantly increased the expression of Cleaved-PARP and cleaved-Caspase-3 in HCC cells compared to treatment with Sorafenib alone. Notably, Ti3 alone did not induce activation of these apoptotic proteins (Fig. 7F). Cleaved-PARP and cleaved-Caspase-3 are active forms of the apoptosis-related proteins PARP and caspase-3, indicating activation of the apoptotic pathway leading to cell apoptosis. These results suggest that Ti3 enhances Sorafenib-induced apoptosis. Additionally, the combined treatment of Ti3 and Sorafenib significantly reduced the number of liver cancer cell spheres compared to treatment with either Sorafenib or Ti3 alone (Fig. 7G, H), indicating that Ti3 sensitizes HCC cells to Sorafenib.
To investigate the underlying mechanism of this synergy, Western blot analysis was performed. The results demonstrated marked inhibition of STAT3 and AKT phosphorylation, as well as reduced expression levels of TFCP2L1 and NANOG in the combination treatment group compared to the Sorafenib-only group (Fig. 7I). These findings suggest that Ti3 enhances the therapeutic efficacy of Sorafenib by suppressing the NANOG/STAT3 signaling pathway and downregulating TFCP2L1 expression in HCC cells.
Sorafenib combined with Ti3 gained better tumor inhibitory efficiency for HCC compared with the monotherapy
To investigate the synergistic impact of combining Ti3 with Sorafenib against HCC in vivo, we established a subcutaneous xenograft model using Hep3B-Ctrl, Hep3B-TFCP2L1-KO, and Hep3B-TFCP2L1-OE cells. Three weeks post-injection, tumor-bearing mice were orally administered Ti3 and/or Sorafenib twice weekly. As depicted in Fig. 8A–F, the combined treatment of Ti3 (10 mg/kg) and Sorafenib (25 mg/kg) led to an 84% inhibition of tumor growth in the Hep3B-Ctrl group, whereas Sorafenib alone inhibited growth by 61%. No significant difference was observed between the vehicle group and the Ti3 alone group. Notably, Sorafenib alone inhibited tumor growth by 85% in the TFCP2L1-KO group, with minimal additional benefit observed in the combined treatment group (83%) (Fig. 8E, F). Conversely, in Hep3B-TFCP2L1-OE tumor-bearing mice, Sorafenib monotherapy achieved only a 25% suppression rate, while the combination restored the inhibition rate to 83%. These results underscore TFCP2L1’s significant role in modulating tumor cell sensitivity to Sorafenib. Overall, combining Sorafenib with Ti3 demonstrates superior tumor inhibitory efficacy in HCC treatment.
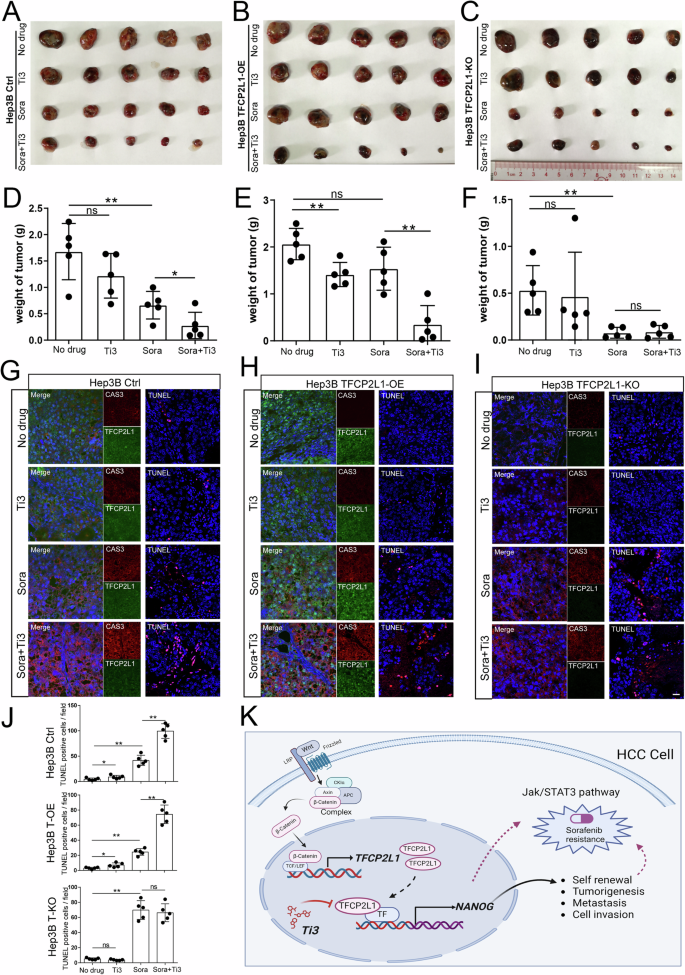
A–C Photographs of Hep3B-Ctrl (A), Hep3B TFCP2L1-OE (B), and Hep3B TFCP2L1-KO (C) xenograft tumors at the endpoint after treatment with the indicated drug combinations. D–F Statistical analysis of the final weight of xenograft tumors at the endpoint. *p < 0.05; **p < 0.01; ns represents no significance compared with the control group. G–I Immunofluorescence staining of Caspase3 and TFCP2L1 expression in xenograft tumors, along with TUNEL staining to assess tumor cell apoptosis. Representative images are shown. DAPI was used to stain the nuclei. Scale bar = 100 μm. J Statistical analysis of TUNEL-positive cells per field from panels G–I. *p < 0.05; **p < 0.01; ns represents no significance compared with the control group. K Graphical abstract of the research findings. TFCP2L1 drives NANOG expression in HCC cells, activating the JAK/STAT3 signaling pathway to promote CSC stemness and HCC pathogenesis. The small molecule Ti3, which targets the active domain of TFCP2L1, can enhance the efficacy of Sorafenib treatment in hepatoma cells.
To elucidate the underlying inhibitory mechanism, tumor tissues were embedded and subjected to immunofluorescence for Caspase-3 expression and TUNEL staining. As shown in Fig. 8G–J, Caspase-3 expression (including precursor Caspase-3 and cleaved-Caspase-3) and the number of TUNEL-positive cells were consistently highest in the Sorafenib and Ti3 combination group, indicating significant apoptosis induction. TFCP2L1 knockout enhanced apoptosis predominantly with Sorafenib alone, whereas TFCP2L1 overexpression attenuated Sorafenib-induced apoptosis.
Discussion
The theory of CSCs posits that the recurrence, metastasis, and drug resistance observed in HCC can be largely attributed to the presence of these CSCs [10]. However, conventional treatments such as surgery or chemotherapy primarily target rapidly proliferating tumor cells and cannot effectively tackle CSCs, indicating a significant limitation in the current therapeutic landscape as CSCs are pivotal for disease progression [19]. Thus, a more comprehensive understanding of the regulatory mechanisms governing HCC CSCs holds promise for developing novel therapeutic strategies aimed at preventing recurrence and metastasis. Herein, our study demonstrated promising results in the development of new CSC-targeted therapies, specifically TFCP2L1 inhibitors such as Ti3, which could potentially enhance the efficacy of current treatments and improve clinical outcomes for HCC patients. The regulation of HCC CSCs involves complex signaling pathways and factors, including the Wnt/β-catenin, Jak/STAT3, and TGFβ/SMAD pathways [20]. Targeting these pathways and factors with innovative therapies may represent a promising avenue to improve patient outcomes by addressing the underlying disease mechanisms. Our investigation focused on TFCP2L1, a downstream transcription factor of the Wnt pathway, due to its critical role in the initiation, progression, and treatment of HCC, including its implications for immunotherapy [21, 22]. In this regard, our findings suggest that TFCP2L1 inhibitors (such as Ti3) have the potential to enhance the therapeutic efficacy of tyrosine kinase inhibitors (TKIs), currently the mainstay of targeted therapy for HCC, thereby offering a viable combination therapy strategy. Ti3 could potentially serve as an adjunctive therapy in the future, presenting a novel approach to overcoming drug resistance and improving treatment outcomes in HCC, which constitutes a significant contribution of our study to the field.
ESCs, pluripotent stem cells, and CSCs share several similarities in the maintaining their stemness [8]. For instance, the pluripotent factors OCT4, SOX2 and NANOG, which are essential for stemness maintenance, also function as oncogenes pivotal in tumor development. Moreover, CSCs have high expression levels of these factors, indicating similarity in self-renewal mechanisms with pluripotent stem cells [23]. However, some CSCs employ entirely different biological mechanisms to sustain their stemness, which in some cases may involve the loss of stemness genes through signals resembling those in pluripotent stem cell differentiation. While TFCP2L1 has been identified as a key transcription factor in maintaining ESC self-renewal, its role in tumors remains debated. Several studies indicate that TFCP2L1 overexpression in bladder urothelial carcinoma affects the cell cycle, enhances tumor stemness and invasiveness, and correlates with poor prognosis, suggesting a role similar to that in ESCs [24, 25]. Conversely, in clear cell renal cell carcinoma (ccRCC) [26], renal medullary carcinoma (RMC) [27], and papillary thyroid carcinoma (PTC) [28], TFCP2L1 is downregulated, implying divergent mechanisms from ESCs in maintaining tumor characteristics in these contexts.
Although research regarding the role of TFCP2L1 in HCC remains limited, our study provides compelling evidence that TFCP2L1 is significantly upregulated in HCC, particularly within liver CSCs. We observed that elevated TFCP2L1 expression in HCC patients correlates with poor prognosis. Furthermore, the knockdown of TFCP2L1 in hepatoma cell lines markedly reduced proliferation, invasion, metastasis, clonal formation, and sphere formation ability. Subcutaneous tumorigenesis in nude mice also demonstrated a positive correlation between TFCP2L1 expression levels and tumor size. These findings underscore the crucial role of TFCP2L1 in maintaining the self-renewal of HCC CSCs, suggesting a mechanism akin to that observed in ESCs.
Previous studies have reported the activation of stem cell transcription factors such as SOX2 and Nanog during HCC initiation [29,30,31], further supporting parallels between ESCs and HCC CSCs in stemness regulation. Additionally, the Wnt signaling pathway has been identified as crucial for maintaining HCC CSCs, with TFCP2L1 acting as a downstream transcription factor of Wnt [13, 32]. Activation of TFCP2L1 through the canonical Wnt signaling pathway involves β-catenin complex activation and subsequent binding to the TFCP2L1 promoter region within the cell nucleus, thereby initiating TFCP2L1 transcription. Similarly observed in ESCs, TFCP2L1 exhibits transcriptional activity, notably promoting NANOG gene transcription. Our luciferase reporter assays confirmed TFCP2L1’s direct regulation of NANOG transcription. Notably, modulation of TFCP2L1 expression minimally impacted upstream β-catenin protein levels in HCC, highlighting TFCP2L1’s specific role in regulating NANOG expression independent of upstream Wnt pathway components. Given NANOG’s critical role in HCC cell malignant transformation and stemness maintenance, our study highlights the significance of TFCP2L1 in CSC self-renewal regulation. Thus, our findings support TFCP2L1 as a potential therapeutic target for liver cancer, specifically targeting CSCs (Fig. 8K).
Activation of TFCP2L1 in ESCs occurs via LIF/STAT3 signaling, leading to direct transcriptional regulation of NANOG expression [33,34,35,36]. In this present study, we found that changes in TFCP2L1 expression in liver cancer cells not only affected NANOG expression but also directly impacted STAT3 activation. This finding is intriguing, as STAT3 activation is pronounced in HCC due to its association with inflammation. However, direct inhibition of STAT3 can cause severe side effects. Therefore, targeting its overactivation through TFCP2L1 inhibition appears promising.
Sorafenib targets proteins upstream in the STAT3 signaling pathway, including RAS/RAF, suggesting its ability to inhibit STAT3 signaling. In this study, we confirmed that Sorafenib significantly reduces STAT3 phosphorylation (Fig. 7I). However, previous studies have revealed that overactivation of STAT3 is associated with Sorafenib resistance, underscoring the dependency of Sorafenib efficacy on its inhibitory effect on STAT3. In our study, inhibition of STAT3 phosphorylation is more pronounced when Sorafenib is combined with Ti3 (Fig. 7H), further highlighting the critical role of TFCP2L1 inhibition in enhancing sensitivity to Sorafenib. Previous research has shown that NANOG and STAT3 cooperatively promote the development of HCC-initiating stem cells [30]. Moreover, our in vivo and in vitro experiments confirmed that TFCP2L1 directly regulates the expression of NANOG and functions as a downstream effector of the classical Wnt signaling pathway in HCC. Thus, we propose that TFCP2L1 serves as a critical intersection of these pivotal pathways in HCC CSCs, highlighting its potential as a transcriptional regulator with significant research implications.
To further determine TFCP2L1’s pivotal role in HCC, further research utilizing gene knockout mice and downstream factor analyses is essential to elucidate its intricate regulatory mechanisms. A major contribution of our study is the identification of Ti3, a specific inhibitor targeting TFCP2L1, which represents a crucial advancement toward clinical translation. Furthermore, our research revealed a correlation between TFCP2L1 expression and Sorafenib resistance. Sorafenib remains the sole targeted drug for advanced HCC over the past decade [7], yet its clinical utility is limited by resistance and severe side effects [37, 38]. Herein, we demonstrated a direct association between TFCP2L1 expression and Sorafenib resistance. Following TFCP2L1 knockout or Ti3 inhibition, we observed a significant improvement in Sorafenib’s therapeutic efficacy. At a concentration of 30 μM, Ti3 synergized with Sorafenib to induce apoptosis in liver cancer cells, while observing no inhibitory effects on normal cells at therapeutic doses. These findings suggest that Ti3 holds promise as a precursor for drug development. Further molecular modifications could lead to the development of small molecule drugs with lower effective concentrations, potentially enhancing their suitability for future clinical applications.
In conclusion, our study elucidated the mechanism of self-renewal dependence in liver CSCs, highlighting its similarities with ESCs, particularly in the regulation of TFCP2L1-mediated signaling pathways. Additionally, we identified Ti3, a small molecule inhibitor specifically targeting TFCP2L1, which significantly enhances the sensitivity of Sorafenib. This discovery positions Ti3 as a promising candidate for clinical development. Our findings not only uncover a novel mechanism of self-renewal in liver cancer CSCs but also pioneer the development of a small molecule drug that synergizes effectively with Sorafenib, marking a significant advance for clinical translation.


Responses