Anionic lipids direct efficient microfluidic encapsulation of stable and functionally active proteins in lipid nanoparticles
Introduction
The vast majority of FDA approved protein therapeutics target soluble factors in serum or receptors on cell surfaces, but not intracellular ligands, because naked proteins do not efficiently penetrate the plasma membrane. However, encapsulated RNAs in lipid nanoparticles, RNA-LNPs, can pass efficiently through the plasma membrane, which is a major factor responsible for the remarkable success of mRNA-LNP vaccines such as those for the SARS Cov2 virus1,2. LNPs are nanoparticles with an outer lipid monolayer and/or lipid bilayer membrane. By various accounts, lipid nanoparticles are endocytosed through the plasma membrane and further processed through the endosomal pathway to release their contents from late endosomes1,3,4,5,6. The goal of this study was to develop methods for efficient microfluidic packaging of active proteins into the lumen (i.e., the region completely encapsulated by the outer-most membrane) of LNPs to generate stable Encapsulated Protein LNPs, EP-LNPs. We define efficient loading as the loading of proteins at an order of magnitude higher concentration into the lumen of EP-LNPs than outside in the aqueous medium surrounding the LNPs. This is a stringent definition, considering that the luminal volume within the liposomal fraction after microfluidic packaging is several orders of magnitude smaller than the outside aqueous volume. By active proteins we mean the proteins retain their biological and biochemical activities in the EP-LNPs. By referring to them as stable EP-LNPs, we mean that most of the proteins would be retained within the lumen of the EP-LNP, after a month or more of storage at 4oC. EP-LNPs would offer many benefits to protein pharmaceuticals, such as better cell, tissue and tumor penetration, longer protein reagent half-lives, and slow controlled release7,8,9. The three main features − efficient loading, maintaining biological activity, and long-term stability− are essential for any practical application of the EP-LNP technology. Because LNPs transfer their cargos through the plasma membrane, EP-LNPs would make thousands of new intracellular targets available for the development of novel protein therapeutics. Currently, there are no FDA approved therapeutics with proteins packaged in the lumen of LNPs for cytosolic delivery. This limitation to clinical medicine is due to the lack of a simple technology for efficient luminal loading of active proteins into EP-LNPs and the instability of protein lipid complexes as previously assembled. Our goal in this study is to develop a simple and efficient method for preparing stable EP-LNPs.
Proteins are amphoteric poly-ionic macromolecules. At physiological pH values, the vast majority behave as positively charged poly-cations10. This property is due to the surface presentation of more amino acid side chains with positively charged amines (lysine, arginine, histidine) than amino acid side chains with negatively charged carboxylic acids (e.g., aspartic acid, glutamic acid). Further, moderately acidic buffers have the potential to make proteins more cationic by titrating a high percentage of the uncharged amines, including exposed histidine residues, to cations. We hypothesize that anionic phospholipids would associate with the cationic surfaces of proteins to enable the luminal encapsulation of protein polycations during microfluidic chip assembly of protein-lipid complexes (Fig. 1). During microfluidic chip mixing of proteins in mildly acid buffers, the cationic domains of proteins would interact most strongly with anionic lipids (Fig. 1A, left) and the lipid coated proteins would be concentrated into unstable protein-lipid complexes (Fig. 1B, left). Dialysis of lipid-protein complexes into neutral aqueous buffers would titrate proteins to a more anionic state, which would break their interaction with anionic lipids (Fig. 1A, right) and transform protein-lipid complexes into closed EP-LNPs with the removal of organic solvent (Fig. 1B, right). Once enclosed in the lumen of an EP-LNP, proteins should remain stably packaged. The change in pH will not alter the negative charge on phospholipids. This model is based on the elegant experimental data and models presented for the microfluidic assembly of RNA-LNPs11,12,13. A reagent that fluoresces when it intercalates into RNA enables highly sensitive quantitative assays of RNA. It does not penetrate liposomes. When mRNA lipid complexes first emerge from microfluidic assembly they behave as nanoparticles, but most of the RNA still stains. Hence, the RNA lipid particles are illustrated as in an open conformation, as drawn here for our newly formed protein lipid complexes (Fig. 1B, left). However, after dialysis of RNA-LNPs, the RNA does not stain unless the liposomes are lysed. Hence, the dialyzed RNA-LNPs have a closed fused membrane conformation as we modeled for EP-LNPs after dialysis (Fig. 1B, right). In summary, we speculate that microfluidic packaging to make stable EP-LNPs will proceed through a sequence of events similar to those reported for RNA-LNPs.
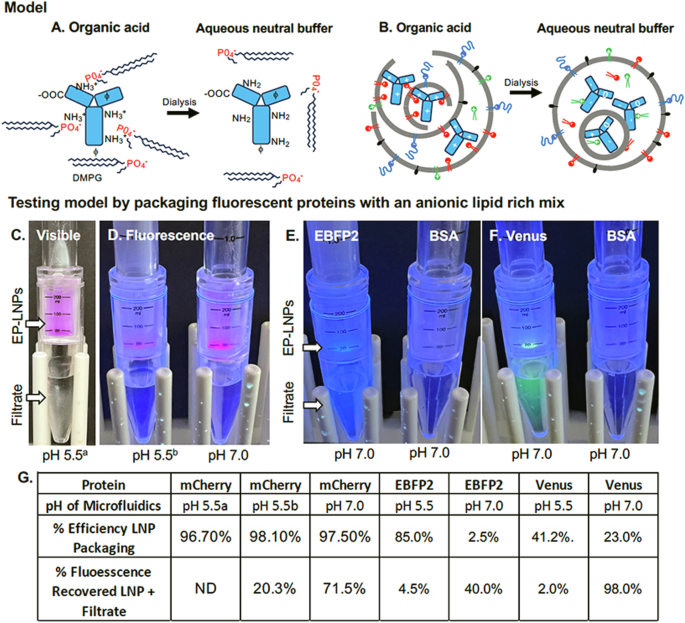
A, B A model for the formation of stable EP-LNPs. A In organic acids the majority of proteins are polycations with mostly basic (+), fewer acidic (-), and some hydrophobic (ϕ) amino acid residues on their surfaces. They associate with anionic lipids during microfluidics. Dialysis into neutral aqueous buffer neutralizes the protein and reduces its interaction with anionic lipids. B During microfluidic chip processing in organic acid, unstable protein-lipid complexes are formed (left). Dialysis converts lipid complexes into stable closed EP-LNPs (right). C – G Initial experimental evidence for the formation of EP-LNPs. C Visible red color of mCher-LNPs trapped by a 300,000 MWCO spin filter and colorless filtrate below from the first filtration. Packaging was performed at pH 5.5. This was a seminal experiment demonstrating the efficient packaging of protein into EP-LNPs using a benchmark DMPG lipid rich mixture. D Red fluorescence of mCher-LNPs trapped by a 300,000 MWCO spin filter and lack of fluorescence in the filtrate, when packaged at pH 5.5 and 7.0, as indicated. E, F Blue and green fluorescence of EBFP2-LNPs and Venus-LNPs, respectively, trapped by the spin filter and fluorescent filtrate below when packaged at pH 7.0. Spin filters when non-fluorescent BSA was packaged at pH 7.0 are shown in each panel to help resolve protein fluorescence from background blue fluorescence of the plastic tubes. G Table of percent efficiency of packaging (Equation #1) and percent of starting protein fluorescence recovered in LNP + Filtrate (Equation #2) for samples in (C–F). ND, no data collected.
In this model, the efficiency of protein packaging depends upon the ionizable amphoteric nature of proteins. The mechanism(s) for protein interactions with phospholipids would be the inverse of that for mRNA interactions with amino phospholipids employed to prepare SARS Cov2 vaccines11,14. For the microfluidic assembly of mRNA-LNPs, ionizable cationic amino phospholipids interact with anionic mRNAs. During the microfluidic chip assembly of mRNA-LNPs, the solute mRNA remains an anion throughout packaging of RNA lipid complexes. The ionizable lipid is neutralized as mRNA lipid complexes are dialyzed into neutral aqueous buffers, forming closed roughly spherical LNPs with encapsulated mRNA11. Here in our model of microfluidic assembly of EP-LNPs, ionizable cationic proteins interact with anionic phospholipids, and the phospholipids remain anionic during the process, whereas the proteins are neutralized during dialysis.
Inefficient cellular uptake of proteins results in short half-lives, low bioavailability and reduced efficacy15,16,17,18. Therefore, researchers have been trying to package hydrophilic proteins into stable lipid complexes for half a century with the goal of improving intracellular delivery. The lipid mixtures employed have been dominated by amino phospholipids and the proteins are commonly dissolved in neutral buffers. Most studies used classical high energy organic chemical techniques for packaging such as thin film hydration and rehydration, cycles of freeze thawing, and/or sonication. In 1971, Gregoriadis et al.19 reported the entrapment of several percent of the total initial amyloglucosidase enzymatic activity in “multilamellar” vesicles using thin film hydration19. Using freeze-thaw and extrusion technologies, Colletier et al.20 encapsulated acetylcholine esterase into lipid complexes with up to 45% efficiency and with little loss of enzyme activity. Protein packaging efficiencies of 4 – 48% were reported for BSA, ovalbumin, albumin, and insulin21,22,23,24,25,26. It is notable that most studies have either not reported on the long-term stability of their protein lipid complexes or reported short half-lives. By conjugating proteins to highly sulfonated compounds proteins can be cloaked as polyanions. Anionic cloaked proteins may be complexed with Lipofectamine and delivered to cells using methods similar to those used to deliver nucleic acids27. Forbes et al.28 reported the microfluidic packaging of ovalbumin into lipid particles using lipid mixtures rich in one of various amino phospholipids such as DSPC. They reported initial ovalbumin entrapment efficiencies of 10 – 25% for all four lipid mixtures using microfluidics, whereas in their hands, packaging with these lipid mixtures using sonication or extrusion were completely ineffective. However, the ovalbumin lipid nanoparticles they produced by microfluidics were unstable, with half-lives for protein loss from particles measured in hours. We speculate that proteins leaked out of protein-lipid complexes such as those modeled in Fig. 1B (left). Here we made a significant advance over these seminal studies, using microfluidics to prepare stable EP-LNPs from which encapsulated proteins could not readily escape.
We tested the microfluidic encapsulation of several diverse proteins in acidic and neutral buffers using a lipid mixture dominated by the anionic phospholipid DMPG 14:0 PG, hereafter DMPG (Supplemental Table 1 and Fig. SF2) dissolved in two different organic solvent mixtures. Proteins were loaded in aqueous buffers at pH 5.5 and 7.0. We developed simple benchmark protocols in which proteins were efficiently loaded into highly stable EP-LNPs and proteins retained their biological activities for prolonged periods. We believe that this promising technology will open new fields of intracellular protein therapeutics.
Results
Developing a protocol using anionic lipids for the efficient encapsulation of proteins into EP-LNPs
In order to thoroughly test our working hypothesis concerning the encapsulation of proteins into the lumen of EP-LNPs with anionic lipids, we employed six proteins ranging from 28 kDa to 148 kDa in molecular weight and 5.3 to 8.7 in their isoelectric points (Table 1 and Fig. 1). Just prior to microfluidic packaging, proteins were diluted into one of two buffers: pH 5.5 acetate buffer (A5.5) or pH 7.0 phosphate buffered saline (PBS) (Supplemental Fig. 1). The benchmark lipid mixture (a.k.a., DMPG mix) contained 50 mol % DMPG along with other helper lipids (Supplementary Table 1). This lipid mixture is identical to that in Modern’s Covid-19 mRNA-LNP vaccine, except that the ionizable cationic amino phospholipid SM-102 was replaced with the anionic phospholipid DMPG14. The benchmark lipid mixture was prepared in one of two organic solvents: #1 Chloroform (TCM):Ethanol (EtOH) 1:1 v:v or #2 Trifluoroethanol (TFE):Methanol (MeOH) 4:1 v:v.
Packaging was performed at a protein:lipid w:w ratio of 1:20, following on the 1:20 RNA:lipid w:w ratio that is optimal for mRNA packaging in mRNA-LNPs11. Immediately following microfluidics LNPs were dialyzed into a neutral aqueous buffer to remove organic solvent, which is essential to complete membrane fusion into closed LNPs11,12,13. In preliminary experiments, we packaged mCherry (Fig. 1C), because its red color enabled visible light monitoring of the protein’s distribution between the EP-LNP and unencapsulated protein. Its fluorescence enabled sensitive quantitative measurement of EP-LNP packaging efficiencies. Based on our model, the mCherry isoform (pI 6.3) would be more cationic at an acidic pH value (e.g., 5.5), should have a strong electrochemical interaction with the anionic phospholipid DMPG (Fig. 1A), and therefore package more efficiently as compared to packaging at pH 7.0. Immediately after packaging, the protein-lipid complexes were dialyzed into TAS2, a pH 7.5 sucrose stabilization buffer. This would eliminate the organic solvent, make mCherry less cationic, and convert protein-lipid complexes into stable EP-LNPs with a closed membrane structure (Fig. 1B, right). After packaging, the mCherry EP-LNP preparation was concentrated and washed through a 300,000 MWCO spin filter (Fig. 1C) to remove unencapsulated protein. A high percentage of the visible mCherry protein was captured in the EP-LNP fraction in the upper chamber and little if any red protein was observed in the filtrate in the lower chamber (Fig. 1C), indicating a high packaging efficiency. Indeed, in subsequent experiments, using Equation #1 and the mCherry fluorescence of the two fractions, we estimated % efficiency of packaging to be 96.7% (Fig. 1G, left). Next, we compared the microfluidic packaging of mCherry dissolved in pH 5.5 and pH 7.0 buffers. Fluorescent images of the two spin columns are shown in Fig. 1D, respectively. We found that packaging was highly quantitative with the % efficiency of packaging of 98.1% for pH 5.5 and 97.5% for pH 7.0 (Fig. 1G). The total % of mCherry fluorescence recovered was estimated using Equation #2. Even though nearly all the fluorescence recovered was packaged in LNPs relative to fluorescence in the filtrate, only 20% and 71% of the protein’s initial fluorescence was recovered at pH 5.5 and 7.0, respectively. The dramatically reduced recovery of fluorescence at pH 5.5 relative to 7.0 was visually obvious (Fig. 1D). Replicates of this experiment gave similar results. The results raised two issues: (1) The packaging efficiency of mCherry at pH 7.0 was as high as that at pH 5.5, which does not support our hypothesis that acidic pH would improve packaging efficiency due to the amphoteric nature of the protein, if such a benefit existed. (2) The lower recovery of fluorescence for the sample packaged at pH 5.5 is likely due to the fact that mCherry fluorescence is less stable at pH 5.5 compared to neutral pH29.
To determine if our packaging process and high packaging efficiency was unique to the mCherry protein, we proceeded with packaging blue fluorescent EBFP2 and green fluorescent Venus in pH 5.5 and 7.0 buffers using the DMPG lipid mix (Fig. 1E, F). At pH 5.5, packaging efficiencies of EBFP2 and Venus proteins based on fluorescence were relatively high, 85% and 41%, respectively (Fig. 1G). At pH 7.0, the packaging efficiency of EBFP2 and Venus dropped to 2.5% and 23%, respectively. This result supported our working hypothesis, suggesting that the amphoteric nature of these two proteins and their polycationic isoforms at acidic pH 5.5 favored more efficient packaging of protein in EP-LNPs, relative to less efficient packaging when the proteins were more anionic during packaging at pH 7.0. However, when packaged at pH 5.5, only 4.5% and 2% of EBFP2 and Venus of their starting fluorescence was recovered in the combined EP-LNP and filtrate fractions, respectively (Equation #2). When packaged at pH 7.0, 40% and 98% of the starting fluorescence were recovered between the EP-LNP and filtrate fractions, respectively. The fluorescence of the EP-LNP fractions at pH 5.5 were not visible, hence we only showed the pH 7.0 samples in Fig. 1E, F. Because the microfluidic assembly proceeded without clogging of the chip and only very minor traces of precipitated protein were observed after dialysis in these experiments, we speculated that either pH 5.5 and/or Solvent #1 may have caused a conformational loss of fluorescence, but not complete denaturation to insoluble protein.
We then went on to package larger proteins, BSA and goat IgG (Table 1), using the same benchmark protocols at pH 5.5 and 7.0. We chose BSA because it has a relatively low pI of 5.3. Therefore, it might not be more efficiently packaged in the A5.5 buffer based on our model (Fig. 1). The packaging efficiencies (Equation #1) for BSA and IgG were 94% and 95% at pH 5.5, and 82% and 67% at pH 7.0 (Table 2). Again, the lower packaging efficiency at pH 7.0 supports a model in which pH impacts protein packaging, although BSA was still packaged reasonably efficiently at pH 7.0. Using standard curves for the pure proteins, a protein assay, and Equation #2, we estimated that 60% to 98% of the proteins were recovered in the EP-LNPs, respectively. These results for the packaging of five divergent proteins are highly representative among multiple biological replicates (Fig. 1, Table 2).
The nm diameter sizes and size distributions of the five EP-LNPs samples prepared at pH 7.0 were determined using a cytometric flow nanoparticle analyzer (Fig. 2). The Mean diameters for mCherry-, EBFP2-, Venus-, BSA- and IgG-LNPs, ranged from 66.5 to 73.1 nm (Fig. 2B), with an average of 69.4 nm. Fresh preparations of mCher-LNPs, IgG-LNPs and Empty-LNPs were analyzed by Transmission electron microscope (TEM). Representative TEM images of the phosphotungstic acid (PTA) stained LNPs are shown in Supplemental Fig. 6. The particles appeared nearly spherical. Most of the LNPs appeared to be single particles with a homogeneous interior or a more darkly stained interior and less uncommonly we saw evidence of one LNP encapsulating another smaller one. Previous studies on microfluidic preparation of RNA-LNPs also suggested it produced a wide variety of particle morphologies11. Mean particle diameters from TEM were estimated at 83.4, 77.9 and 113 nm, respectively. TEM analysis of an independent preparation of mCher-LNPs gave a diameter size estimate of 71 nm.
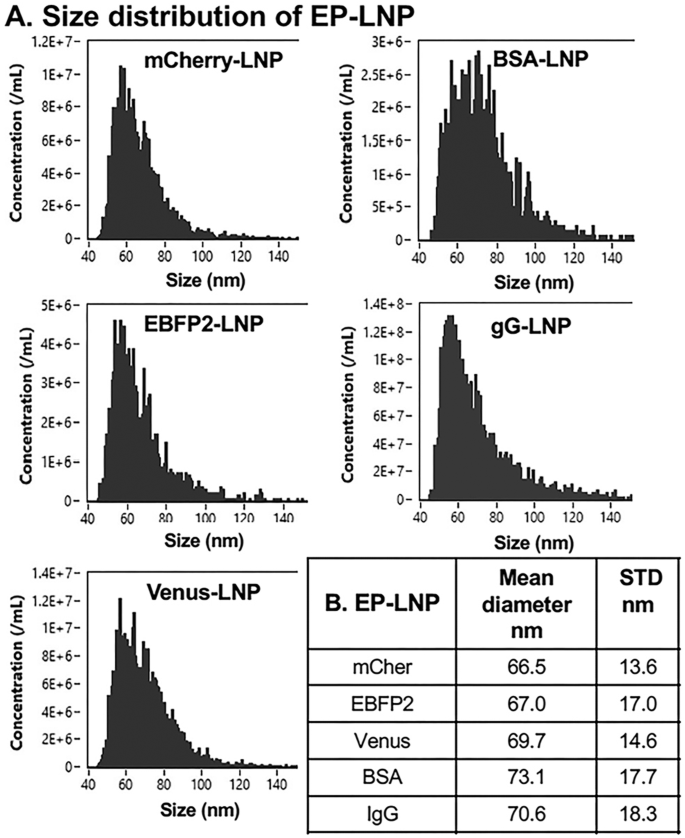
A The size distribution profiles are shown, plotting particle frequency vs estimated nanometer diameter (nm) of mCherry-LNPs, EBFP2-LNPs, Venus-LNPs, BSA-LNPs, and IgG-LNPs. B Summary of the Mean diameter for the five LNP types estimated from the distribution profiles and the standard deviation from the Mean (STD).
We wanted to know if the 1:20 w:w ratio of protein to lipid being used approached the capacity for protein loading similar to the 1:20 w:w ratio of mRNA to lipid commonly used in preparing mRNA-LNP vaccines11. Considering that proteins have a 28% larger Partial Specific Volume (0.728 mL/g) than RNA (0.569 mL/g)30, a 1:20 protein:lipid ratio was an optimistic starting point for developing EP-LNP technology. Yet, at this ratio, we found that essentially all of the various proteins were being efficiently packaged. When we increased the ratio of mCherry protein to 2- or 3-fold higher levels (e.g., protein:lipid w:w ratios of 1:10 or 3:20), there was no significant improvement in the amount of protein loaded at pH 7.0 buffer. A significant portion of the excess protein appeared to be denatured during dialysis of the EP-LNPs and was spun down as a visible pellet (Supplementary Fig. 3). We presume that protein that was not protected in the aqueous lumen of an EP-LNP was denatured via direct exposure to organic solvents during or shortly after microfluidics. Therefore, we continued to use protein:lipid ratios of 1:20 (w:w) in the subsequent experiments in the development of our protocols.
EP-LNPs efficiently penetrate mammalian cells and even fungal cells with a cell wall
The medically relevant aim of this work was to improve the intracellular delivery of proteins. We tested the ability of EP-LNPs to penetrate cells relative to unpackaged proteins. Live human A549 lung cancer cells were incubated for 16 hours with Venus-LNPs, mCherry-LNPs, and the corresponding unpackaged proteins at 1:1,000 w:v protein:growth medium ratios. Nearly all cells exposed to Venus-LNPs or mCher-LNPs showed significant green or red fluorescence by epifluorescence microscopy (Fig. 3A, C). Fluorescence was distributed throughout the cells, suggesting that the EP-LNPs passed efficiently through their plasma membrane. Most of the protein appeared to be in particulate vesicles distributed in the cytoplasm. Only a few of the cells treated with the equivalent concentrations of unpackaged Venus or mCherry protein showed detectable fluorescence (Fig. 3B, D). Quantification based on area of fluorescence per photographic field in multiple images revealed that uptake of Venus-LNPs and mCher-LNPs were 23-fold and 147-fold greater than for the corresponding unpackaged proteins (Fig. 3G). Clearly packaging these proteins in EP-LNPs improved their delivery into cells. Even after only a 2 h exposure to these reagents, cells took up significant amounts of the two LNPs with the uptake of Venus-LNPs and mCher-LNPs being 10-fold and 8-fold higher, respectively, than that for the unpackaged proteins (Supplementary Fig. 4). These observations also demonstrated that proteins delivered into cells remained functional (i.e., fluorescent).
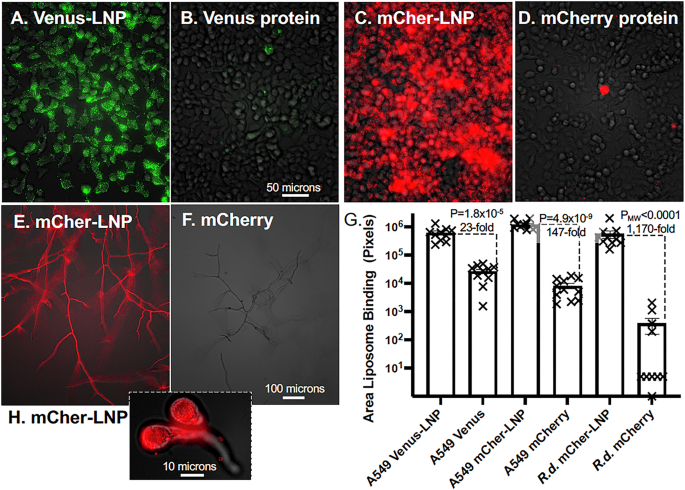
A through (D) A549 cells were incubated with Venus-LNPs and mCher-LNPs delivering 1:1,000 w/v protein and an equivalent amount of unpackaged Venus and mCherry protein in their growth media. After incubating for 16 h under standard growth conditions the cells were washed and viewed live. A Venus-LNPs. B Venus protein. C mCher-LNPs. D mCherry protein. Exposures: Bright field 2% light intensity 15 msec. FITC 82% 660 msec, TxRed 100% 800 msec. A 50 micron size bar is shown. E R. delemar sporangiospores were incubated with mCher-LNPs and mCherry protein (F) for 9 hrs as they developed hyphae and viewed live without washing. A – F A549 and R. delemar cells were viewed bottom up combined brightfield microscopy and the appropriate FITC (ex470/em525) and TxRed (ex560/em630) fluorescent channels, with a 20X NA 0.45 NA lens. G Scatter Bar Plots compare the total fluorescent pixels per image of for LNPs vs protein taken up by the cells. P-values or PMW values and fold differences are indicated. N = 10. H R. delemar germlings (60X NA 0.8 lens) took up significant amounts of mCher-LNP after only 5 h incubation (this is the central image from a Z-stack).
We wanted to determine if the dramatically improved delivery of EP-LNPs over unpackaged protein extended to cells with a cell wall. We tested this idea with the fungal pathogen Rhizopus delemar, the primary causative agent of mucormycosis. We mixed R. delemar sporangiospores with mCher-LNPs or naked mCherry proteins at the same low protein concentration (1:1000 w/v). After 9 h of germination and growth, R. delemar hyphae showed strong red fluorescence when incubated with mCher-LNPs, while the sample incubated with unpackaged mCherry showed little or no detectable fluorescence (Fig. 3E, F). The cells treated with mCher-LNPs showed 1170-fold more fluorescence than those treated with unpackaged mCherry (Fig. 3G). Because these live fungal cell samples were not washed before being photographed, the unpackaged mCherry protein was likely degraded by proteases secreted by the fungus31, which resulted little background fluorescence. Similarly, incubation with mCher-LNPs for a shorter period of time (5 h rather than 9 hr), without washing, produced highly fluorescent germling-stage cells with little background from residual fluorescence in the media, as show in an optical section through the middle of the germling taken at high magnification (Fig. 3H). Thus, EP-LNPs are readily taken up by R. delemar cells at various developmental stages, while naked protein is not.
EP-LNP improved the delivery and performance of the anti-breast cancer antibody Trastuzumab
Next, we wanted to test if antibodies delivered intracellularly through EP-LNPs can interact with their ligand. To that end, we packaged the anti-HER2 IgG1 monoclonal antibody Trastuzumab (TRZ), delivered it into mammalian cells, and examined whether TRZ-LNPs alter a cancer cell phenotype. We used goat IgG as a control. TRZ binds to the extracellular domain of membrane receptor HER2 and inactivates it. In addition to its roles in promoting cell proliferation, migration, and invasion, HER2 overexpression also promotes breast cancer tumorigenesis by suppressing multi-vesical autophagy phenotypes. Blocking HER2’s interaction with Beclin 1, an activator of autophagy, dramatically reduces tumorigenesis32. Starvation rapidly induces an autophagy phenotype in most eukaryotic cells, but SKBR3 breast cancer cells are resistant to this starvation response due to HER2 overexpression. Both RNAi knockdown of HER2 expression and an autophagy-inducing peptide restore some level of starvation-induced autophagy to various HER2+ cells including SKBR3 cells32. Therefore, we thought it is likely that by blocking HER2 activity, TRZ and/or TRZ-LNPs might restore the starvation induced multi-vesicle phenotype to SKBR3 cells.
We conjugated red fluorescent rhodamine B to TRZ and IgG to monitor their behavior. TRZ-Rhod bound strongly to the plasma membrane of fixed HER2 + SKBR3 breast cancer cells, as expected. We prepared TRZ-Rhod-LNPs using our benchmark protocol using pH 5.5 and 7.0 buffer and lipids dissolved in Solvent #1 (TCM:MeOH 3:1). To determine if packaging damaged the activity of TRZ-Rhod, the TRZ-Rhod-LNPs were lysed and rhodamine fluorescence and immunological activity were assayed. The TRZ-Rhod packaged at both pH values retained its fluorescence and was soluble, but it no longer bound to SKBR3 cells. It appeared that the microfluidic packaging protocol employed destroyed the immunological activity of TRZ for binding HER2.
Antibodies are relatively stable in mildly acidic buffers. Therefore, we speculated that the chloroform in Solvent #1 (1:1, TCM:EtOH) employed for dissolving the lipids during microfluidic assembly of EP-LNPs, may have denatured TRZ’s antigen binding site. Even brief shaking with modest concentrations of TCM is reported to completely denature some proteins33. To test this possibility, we instead dissolved lipids in Solvent #2 (TFE:MeOH 4:1). Trifluoroethanol (TFE) has the reported potential to maintain tight hydrophobic interactions within proteins34 and was potentially less denaturing than TCM. TRZ-Rhod and IgG-Rhod dissolved in pH 5.5 buffer were packaged into EP-LNPs using Solvent #2 (Fig. 4). The packaging efficiency (Equation #1) was 76% and 51%, respectively, and 98% and 95% of the total fluorescence was recovered in the combined LNP and filtrate fractions. After lysis of the TRZ-Rhod-LNPs, the antibody binding activity of TRZ-Rhod towards fixed SKBR3 cells was visually indistinguishable from that of the starting TRZ-Rhod protein (Fig. 4B, labeling with TRZ at 1:200 w/v). The full retention of TRZ’s immunological activity was further confirmed by quantification of the fluorescence of these cells (Fig. 4C).
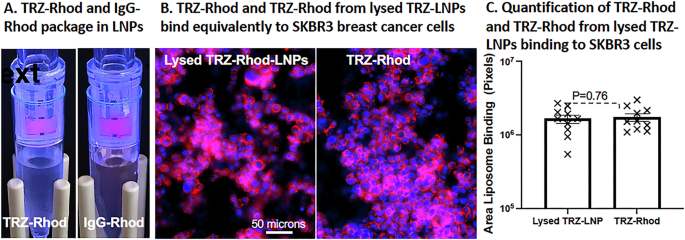
A Rhodamine conjugated TRZ-Rhod and IgG-Rhod were efficiently packaged in LNPs. Red fluorescence of TRZ-Rhod-LNPs and IgG-Rhod-LNPs were trapped by a 300,000 MWCO spin filter and the filtrates containing the unpackaged proteins are nearly colorless. Packaging was performed in A5.5 buffer using lipids in Solvent #2. B TRZ-Rhod and TRZ-Rhod from lysed TRZ-LNPs appear to bind equivalently to fixed HER2 + SKBR3 breast cancer cells. Binding was performed with TRZ-Rhod at 1:100 w/v and images taken at 20X (NA 0.8) using 100 msec exposures Ex560/Em630. C The area of red fluorescent TRZ-Rhod binding was quantified using AreaPipe. A scatter bar plot compares the level of binding between the two samples and shows them to be equivalent (P = 0.76). Whiskers show the standard errors from the mean. N = 10 images.
To determine if packaging of TRZ in an EP-LNP increased penetration through the mammalian cell membrane, we again employed the lung cancer cell line A549 that is HER2- negative. This allowed us to compare the uptake of an EP-LNP (TRZ-Rhod-LNP) to TRZ-Rhod protein without the complication of TRZ-Rhod binding to the cell surface. Indeed, we did not observe any TRZ-Rhod cell binding to fixed A549 cells. We treated live A549 cells overnight with TRZ-Rhod protein and TRZ-Rhod-LNP delivering 1:200 w/v protein to the media and photographed them at 10X magnification (Fig. 5). TRZ-Rhod-LNPs were taken up by 100% of the cells, while only traces of TRZ-Rhod were seen and only in a few cells per microscopic field (Fig. 5A). Quantification of red fluorescence indicated that cellular uptake of TRZ-Rhod-LNP was 1100-fold greater than for TRZ-Rhod (Fig. 5B).
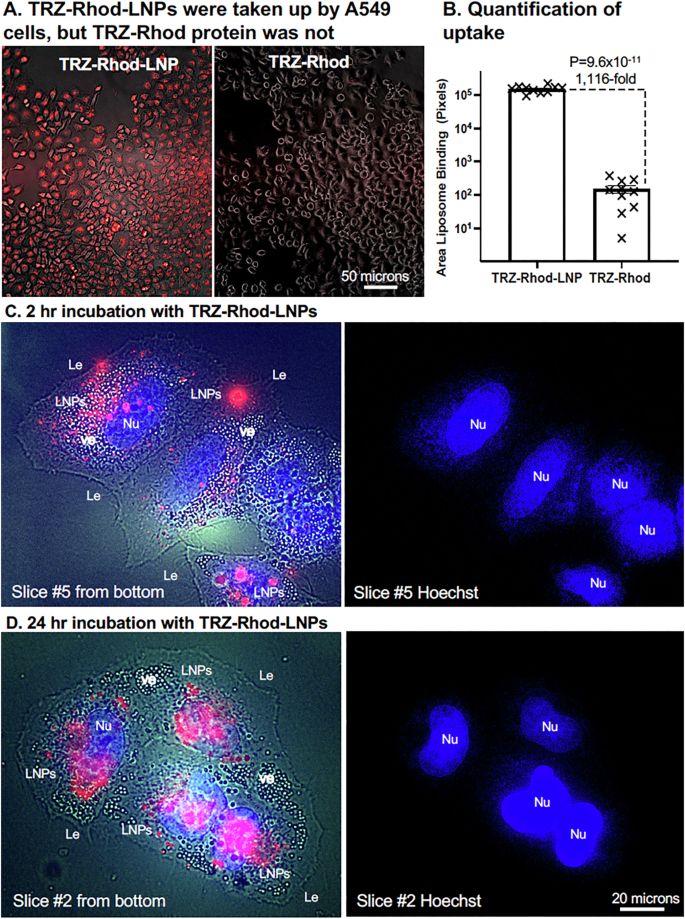
Live HER2 negative A549 lung cancer cells were incubated with TRZ-Rhod-LNPs or TRZ-Rhod at 1:200 w/v TRZ protein:media. A. After overnight incubation with these fluorescent reagents, washed cells were photographed bottom up at 10X using combined low transmitted light (3% intensity, 30 msec) and red fluorescence (100% intensity, 1,300 msec) exposures. The brightness of the two original images was enhanced equivalently for better viewing. B A scatter bar plot quantified the area of liposomal red fluorescence in randomly taken original images (N = 10 for each). The fold difference and P-value between TRZ-Rhod-LNP and TRZ-Rhod treated samples are indicated along with whiskers showing the standard error from the mean. C, D 60X magnification optical slices of A549 cells after 2 h and 24 h incubation with TRZ-Rhod-LNPs (1:100, protein:media, w/v), respectively. Exposures for left images: Bright field 20 msec, blue fluorescence of Hoechst-stained nuclei 100 msec, LNP red fluorescence 800 msec (C) and 70 msec (D). The total brightness was enhanced to reveal the Le. Right images are from the blue fluorescent channel to identify nuclei. Le, leading edge of cells; Nu, nuclei; ve, vesicles.
Further, evidence that the EP-LNPs were taken into the cytoplasm of cells and were not located on the cell surface was obtain by taking 60X magnification through-focus stack of images of live A549 cells incubated for 2 h and 24 h with TRZ-Rhod-LNPs. Cells were co-stained with Hoechst to identify nuclei. Weak bright field exposures were included to identify the leading edges (Le) of the cells. One optical slice out of each stack of 7 slices from the 2 h and 24 treatments is shown in Fig. 5C, D, respectively. An adjacent image of the Hoechst-stained nuclei (Nu) is shown on the right to define the number of cells in the image and help identify cell boundaries. For the 2 h treatment the 5th slice from the bottom (second down from the top) was selected, because it contained the maximum number of in-focus TRZ-Rhod-LNPs (Fig. 5C). For the 24 h treatment the 2nd slice from the bottom (6th down from the top) was selected, because it was one of the slices with the maximum number of in-focus TRZ-Rhod-LNPs (Fig. 5D). In the 2 h sample, the vast majority of red fluorescent TRZ-Rhod-LNPs were in observed in the cytoplasm, some near the Le, but most were located further within the cells and co-distributed with cellular vesicles (ve) seen as white spots and nuclei in the same focal plane. The LNPs appeared to be excluded from nuclei. Clearly, the EP-LNPs were taken up rapidly. The 24 h sample gives more robust evidence of the cytoplasmic distribution of LNPs. These cells contained at least an order of magnitude more red fluorescent liposomes and the exposure times in the red fluorescent channel had to be reduced more than 10-fold. TRZ-Rhod-LNPs are rarely seen near the Le, even though the Le represents the largest surface area of the cells. It is worth noting that the in-focus LNPs appear to have moved from the second slice down from the top at 2 h to the 5th slice down from the top by 24 h, following their progression into the cell interior. All the optical slices in the two stacks are shown together in Supplemental Fig. 5. Scanning through these slices, from the bottom slice adjacent to the glass slide to the top slice at the top of the cells, visually demonstrates that essentially all of the in-focus TRZ-Rhod-LNPs are in the same planes as in-focus vesicles and nuclei, and rarely located near the Le.
TRZ is an effective therapeutic for treating HER2+ breast cancer tumorigenesis, both inhibiting growth and killing HER2+ cells in vivo. However, the efficacy of TRZ’s antitumor cell cytotoxicity is dependent upon T cell-mediated immunity35 and TRZ is not particularly effective at inhibiting or killing HER2+ cancer cells growing in vitro, even after several days of treatment36,37,38. Because we found no previous reports of TRZ being delivered to the cell interior, when packaged within a nanoparticle, we could only speculate about possible phenotypes for TRZ-Rhod-LNP treatment of HER2 + SKBR3 cells. Most cultured mammalian cells produce a multi-vesicle starvation phenotype within a few hours of being transferred from rich media to minimal salts media32,39,40. Furthermore, HER2 overexpression, as occurs in some HER2+ cancer cells, including SKBR3 cells, inhibits this normal starvation-induced multi-vesicle phenotype32. In other words, unlike most cells, HER2 overexpressing cells do not develop a significant multi-vesicle phenotype when switched to minimal media. Therefore, we proposed that if TRZ-Rhod and/or TRZ-Rhod-LNPs were delivered to the cytoplasm, TRZ would restore the starvation-induced multi-vesicle phenotype by reducing HER2 activity. We transferred SKBR3 cells to a minimal salt media containing TRZ-Rhod or TRZ-Rhod-LNPs (1:200 w:v TRZ:media), incubated them for 3 h, and photographed the live cells (Fig. 6). As expected, TRZ-Rhod bound primarily to the cell surface. But, only a few to several of the TRZ-Rhod treated cells in each microscopic image showed even a trace of a discernable multi-vesicle phenotype (Fig. 6A, C). By contrast, nearly every cell in the TRZ-Rhod-LNP treated sample showed a strong distinct multi-vesicle phenotype (Fig. 6B, E). We scored the percent of cells per microscopic field that showed any discernable multi-vesicle phenotype from 10 random images for each treatment. Ten-fold more of the TRZ-Rhod-LNP treated cells showed the multi-vesicle phenotype than the TRZ-Rhod treated cells (Fig. 6F). As a LNP control, Venus-LNPs were included with the TRZ-Rhod treatment. They labeled vesicles green in a very few cells per field (Fig. 6D, F). A complete biological replicate of this experiment gave similar results. It should be noted that it was not known if the HER2-dependent block of the starvation-induced multi-vesicle phenotype in HER2+ cells originated from HER2 activities in the plasma membrane or possible intracellular activities. Our results suggest that intracellular HER2 activities in HER2 overexpressing cells may be responsible for suppression of the starvation induced multi-vesicle phenotype. A number of additional experiments will be needed to determine if the vesicles observed in the TRZ-Rhod-LNP treated cells are indeed true autophagosomes32. The result reported here suggests the untapped potential of delivering protein therapeutics as EP-LNPs.
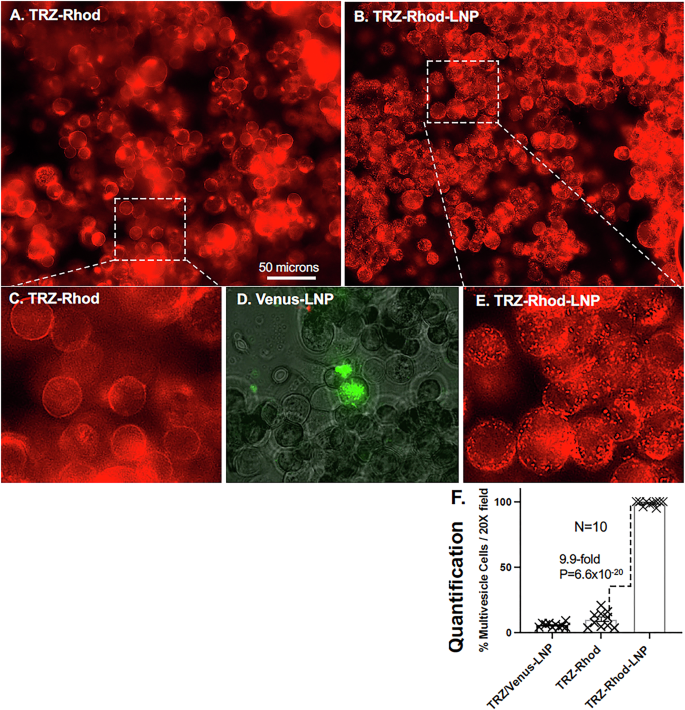
SKBR3 cells were switched from rich media to minimal starvation media containing either (A) TRZ-Rhod + Venus-LNP or (B) TRZ-Rhod-LNPs (TRZ:media 1:200 w:vol) and incubated for 3 h, washed and photographed top down with a 20X lens (N.A. 0.8). C, E Inserts show a representative portion of each image enlarged 3.2-fold to better observe the multi-vesicle phenotype. D Selected area from A (Green channel) to reveal cells with Venus-LNP stained vesicles. A size bar indicates the degree of magnification in photographs. F A scatter bar plot compares the percent of cells per microscopic field with a discernable multi-vesicle phenotype for the treatments shown in (A, B). N = 10 each bar. The fold differences and P-value for the comparison between samples are indicated along with whiskers showing standard errors from the mean.
Validating and quantifying our revised benchmark protocol for preparing stable EP-LNPs
Having established a revised Benchmark protocol showing the DMPG mix in Solvent #2 and TRZ in pH 5.5 buffer preserved the immunological activity of TRZ, we then compared this method of packaging for EBFP2, Venus, and mCherry to the former method. We found a significant amount of all three fluorescent proteins were retained in the EP-LNPs fractions relative to the filtrates (Fig. 7). Their packaging efficiencies were 32%, 27%, and 79%, respectively (Fig. 7B top, Equation #1). More importantly, the level of recovery of fluorescence in the combined LNPs and filtrate was 60%, 98%, and 98%, respectively (Equation #2). Thus, for all three proteins, packaging using Solvent #2 provided vastly superior recovery of total fluorescence (4 to 61-fold more recovered) than Solvent #1 (Fig. 7B, bottom). The improved preservation of protein fluorescence is likely due to replacing TCM with TFE.
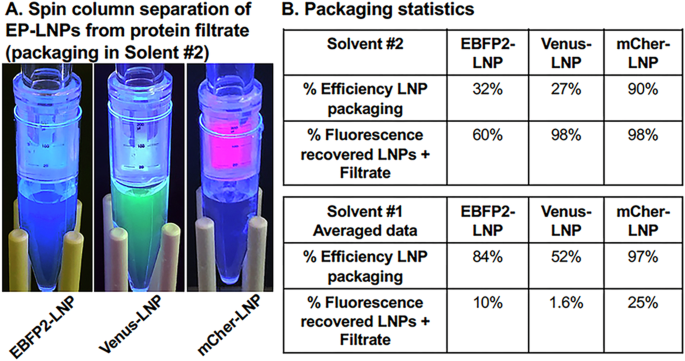
A After preparing EBFP2-LNPs, Venus-LNPs, and mCher-LNPs at pH 5.5 with the DMPG lipid mixture in Solvent #2 (TFE:MeOH 4:1 v:v) the LNPs were trapped on 300,000 MWCO spin filters and un-encapsulated fluorescent proteins passed into the filtrate. B The percent packaging efficiency (Equation #1) and the percent of the input fluorescence recovered in LNP + filtrate (Equation #2) were compared between preparations prepared in Solvent #2 (top) to Solvent #1 (bottom).
In order to validate the importance of anionic lipids in preparing EP-LNPs, we examined the ability of two other anionic phospholipids, DHP and DMPGA, and the ionizable cationic amino phospholipids SM102 and DSPC, both zwitterions, to promote efficient loading of protein into LNPs. The chemical structures of these lipids are shown in Supplementary Fig. 2. The 50 mol % DMPG in our standard lipid mix was replaced by the same mol % of these alternate lipids. We found that lipid mixes rich in both anionic lipids DHP and DMPGA were effective at packaging mCherry, while both SM102 and DSPC, were ineffective. The results are obvious based on an examination of the spin filters (Fig. 8A), which was validated by quantitative fluorescence assays (Fig. 8C). The lipid mixtures dominated by SM102 and DSPC packaged little if any mCherry (<1% packing efficiency). By contrast, lipid mixtures dominated by anionic lipids DHP and DMPGA had mCherry packaging efficiencies of 97.7% and 28.2%, respectively. The reduced packaging efficiency observed with DMPGA was unexpected given that DMPGA has a similar structure to DMPG (Supplementary Fig. 2). Based on these results, it appears that ionizable cationic amino phospholipids do not promote protein loading under the conditions we tested. Anionic phospholipids promote active protein loading into EP-LNPs, although some work better than others.
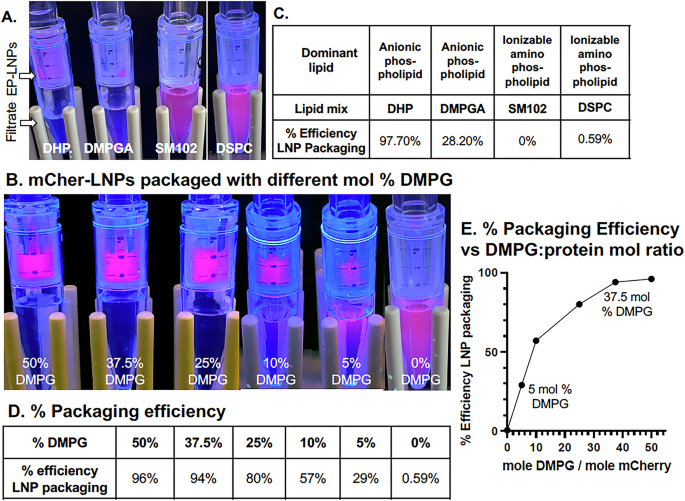
A Red fluorescence of mCherry-LNPs trapped by a 300,000 MWCO spin filter and/or of free mCherry protein in the filtrate below for four lipid mixtures, DMPG (50 mol %), DMPGA, SM102, and DSPC. B Preparation of mCher-LNPs as the mol% DMPG was reduced from 50% down to zero (TFE:MeOH 4:1 v:v) at pH 5.5. C, D Tables showing the % efficiency of LNP packaging for the samples in (A, B) respectively (see Equation #1). E The % efficiency of LNP packaging data from (B, D) is plotted as a function of the mol:mol ratios of DMPG molecules to mCherry molecules as calculated by Equation #3.
We then estimated the mol % of DMPG in our lipid mix in Solvent #2 that was necessary for efficient protein packaging of mCherry. We tested lipid mixtures in which the mol % of anionic DMPG was reduced from 50% down to 37.5, 25%,10%, 5% and 0%, while the % of the amino phospholipid DSPC was increased correspondingly. Packaging was again performed with the standard protein:lipid w:w ratio of 1:20. As the mol % of the DMPG component dropped, the amount of mCherry encapsulated visually dropped, with the most noticeable decrease occurring when the DMPG concentration fell below 25 mol % (Fig. 8B). Relative to the Benchmark lipid mix with 50 mol % DMPG, the % efficiency of LNP packaging dropped from 96%, to 94%, 80%, 57%, 29%, and finally to 0.59% (Fig. 8D). We then estimated the mol:mol ratios of DMPG to mCherry in each packaging experiment using Equation #3 and plotted the values vs the percent efficiency of packaging (Fig. 8E). We found that we had achieved close to 100% efficiency of protein loading with 37.5 and 50 mol % DMPG (Fig. 8E), where the mol:mol DMPG:mCherry ratios were ~37.5:1 and 50:1. When the mol:mol ratio of DMPG to mCherry was as low as 5:1 (Fig. 8E, DMPG at 5 mol % in the mix), packaging efficiency was still 29%. This latter result suggests that a significant amount of protein packaging occurred when only 5 molecules of DMPG were associated with one mCherry polypeptide. In other words, only a small number of anionic phospholipid molecules need to be associated with each protein molecule for modestly efficient packaging.
Preparing EP-LNPs that were stable for an extended period was part of our overall goal, because of its potential benefits to most applications of EP-LNPs. We had recorded the content of fluorescent proteins in preparations of Venus-LNPs, mCher-LNPs, and TRZ-Rhod-LNPs the day after they had been prepared at pH 5.5 in Solvent #2. We repeated these measurements after the preparations had been stored at 4oC in TAS2 buffer for 3 months, after centrifuging them again through a 300,000 MWCO spin filter. The fluorescence in the LNP and filtrate fractions were quantified (Table 3). We found that 83–98% of each sample’s total fluorescence was retained in the LNP fraction (i.e., not lost to the surrounding media due to lysis of the LNP) (middle row, Table 3). Further, the samples had retained 60% – 98% of their total original fluorescence (bottom row, Table 3). Thus, EP-LNPs prepared by this method appear to be reasonably stable when stored for an extended period at 4oC.
Protein payload capacity of EP-LNPs
We calculated the protein payload capacity in numbers of protein molecules per LNP for various EP-LNPs (Table 3) assuming a mean LNP diameter of 70 nm. Based on substantial previous literature on RNA-LNPs prepared by microfluidics, their membrane structures are complex and generally have a mixture of lipid monolayer and bilayer membranes6,12,41,42,43. For our payload calculations we made the assumption that EP-LNPs had a lipid monolayer membrane. We made the additional assumption that there were negligible amounts of lipid in the lumen of the LNPs. We estimated 2.5 lipid molecules per nm2 in a lipid monolayer membrane44. First, we calculated the Dalton (Da) molecular weight (MW in atomic mass units, AMU) of the lipid mono layer membrane of a diameter of 70 nm LNP using Equation #4. From the product of the surface area in nm2 of a 70 nm sphere and 2.5 lipid molecules per nm2 of a mono-layer membrane we obtained (3) the number of lipid molecules per LNP (38,500). We estimated (4) the mol weight average in Da of the lipids in the DMPG lipid mixture that comprised the lipid membrane in Supplementary Table 1 as 665 Da. From the product of the number of lipid molecules per LNP and the mol weight average of the lipids, we obtained (5) an estimate of the AMU weight of the membrane component of an LNP (25,600,000 Da) (Table 4). The payload capacity in numbers of protein molecules per LNP was then estimated using Equation #5, which is based on the AMU weight of one LNP, the AMU of each protein, corrected for the percent loading efficiency and the percent of total protein recovered, which are expressed as fractions in this equation and finally adjusted for the protein:lipid loading ratio of 1:20 (w:w). This ratio of loading was further validated by direct measurement of the amount of protein in each preparation of EP-LNPs. We estimated we had encapsulated ~31 molecules of mCherry, 18 molecules of BSA, and 7 molecules each of IgG and TRZ per EP-LNP (Table 5). As a caveat, these payload calculations assume a lipid monolayer membrane. If indeed, future characterization shows EP-LNPs with a lipid bilayer membrane or a mixture of monolayer and bilayer membranes14,45, then the weight of the lipid membrane in each LNP would be greater and the estimated protein copy number per EP-LNP would be higher.
Summary of results
We developed and demonstrated the efficient microfluidic luminal packaging of proteins in EP-LNPs using our benchmark protocols. These protocols worked well for 6 proteins with diverse MWs and pIs. The optimal benchmark microfluidic encapsulation protocol used proteins dissolved in pH 5.5 or 7.0 buffers and lipid mixtures rich in an anionic lipid DMPG dissolved in Solvent #2, TFE:MeOH 4:1. We demonstrated that even lower percentages of the anionic phospholipid DMPG in the lipid mixture promoted significant levels of protein loading. The protein in EP-LNPs remained stably packaged and active after a few months of storage. We showed that EP-LNPs were efficiently taken up into the cytoplasm of two human cancer cell lines. EP-LNPs were also taken up efficiently by germling and mature hyphae of R. delemar fungal cells, which was surprising considering that this fungus has a thick cell wall composed of diverse crosslinked polysaccharides46. By contrast, the unpackaged proteins were taken up order(s) of magnitude less efficiently by human and fungal cells alike. Our results distinguish themselves based on the qualitative and/or quantitative results for the efficiency of protein encapsulation, cellular uptake, preservation of protein function, and long-term particle stability.
Discussion
Microfluidic packaging of proteins in EP-LNPs
Because polypeptides do not cross the plasma membrane efficiently, protein therapeutics are restricted from developing reagents that target ligands within a cell. The simple microfluidic method reported herein for making stable EP-LNPs that efficiently penetrate the cell membrane should expand the number of therapeutic target ligands by orders of magnitude. The long-term stability of EP-LNPs will enable the thorough characterization of stored reagents prior to use in the laboratory or clinic.
In recent years, RNA-LNPs have taken center stage for delivering mRNA-based vaccines2 and siRNA therapeutics47. The efficient packaging of RNAs into LNPs depends primarily upon acidic pH titrating the amino group of an ionizable amino phospholipid such as SM102 (pKa 6.8) to its cationic state during packaging. At acidic pH values, cationic SM102 is proposed to associate with the anionic mRNA phosphodiester backbone during microfluidic packaging into mRNA lipid complexes3,11,14. Dialysis to neutral pH converts the lipid into an anion, removes organic solvent, and resolves disorganized RNA lipid complexes into stable relatively organized and spherical RNA-LNPs with a closed membrane structure. Our model and strategy for protein packaging might be considered the opposite of that for mRNA, because it depends in part upon the pH titration of residues on the protein solute and not the lipid. It is a less obvious strategy, because the extreme diversity of structures and sequences of proteins relative to the consistent anionic phosphodiester backbone of RNA. In our model, we propose that because proteins are amphoteric poly-ions and most are polycations in acidic pH packaging buffers, they would associate with an anionic phospholipid during microfluidic assembly and efficiently load into protein-lipid complexes. Based on data from more thoroughly characterized mRNA-LNP packaging models11, we speculated that dialysis into neutral buffer would accomplish two things. First, the removal of organic solvent would force lipid complexes into more stable EP-LNPs with a closed membrane structure. Second, neutral pH would make the proteins less cationic, wherein they would lose much of their electrochemical interaction with anionic lipids and be trapped as solutes in the LNP’s interior. We employed a lipid mixture dominated by the phospholipid DMPG, which remains anionic at any physiological pH, analogous to RNA during production of RNA-LNPs.
Protein packaging efficiencies were modestly high for all six diverse proteins using benchmark protocols with the DMPG lipid mixture and proteins at acidic or neutral pH. Packaging efficiencies for all of the proteins were higher in the acidic buffer, with the exception of mCherry. These data strongly supported our hypothesis. However, all of the proteins were also packaged at reasonable efficiencies at pH 7.0. In short, acidic pH was not absolutely required for moderately efficient packaging. The three fluorescent proteins had similar theoretical pIs of 6.1 to 6.3 and should have been polycations at pH 5.5, yet two of them were packaged with different efficiencies at pH 5.5 and 7.0. BSA has an experimental pI of 5.3, and should be neutral or only slightly negatively charged at pH 5.5. By our hypothesis, pH 5.5 should have eliminated some of BSA’s electrochemical interaction with DMPG. Yet, BSA was packaged with reasonable efficiencies at pH 5.5 and 7.0. IgGs are a mixture of protein isoforms with pIs ranging from 6.3 to 8.4 and these isoforms should have ranged from being polyanions to polycations at pH 7.0, respectively. IgG was packaged with modest efficiency (51%). We do not know if the IgG population with more acidic pI values were underrepresented in the LNP fraction. In short, our hypothesis about the role of pH and protein pI values explained part, but not all, of what was observed. The data on the successful loading of all six proteins suggest that perhaps in addition to electrochemical interactions and hydrophobic interactions between protein and the lipid component of DMPG may also be in play.
Packaging efficiencies were high and relatively equivalent for proteins ranging from 29,000 Da to 145,000 Da. Hence, within the range of proteins examined and the microfluidic method we employed, size was not a limitation. However, it is easy to imagine that very large and/or unusually shaped proteins such as the stick-like 606,000 Da thyroglobulin (26 × 11 x 11 nm)48 or planar 900,000 Da IgM antibodies (42 x 42 x 13 nm)49 might not be package with the same efficiencies.
Further, we showed that three anionic phospholipids promoted the microfluidic packaging of protein into EP-LNPs, but cationic lipids did not enable any significant packaging. This indicated that interaction of the hydrophobic tail of a cationic lipid with protein did not suffice. Entering the project with our hypothesis in mind, we were surprised at the modestly high packaging efficiencies observed at pH 7.0, wherein some of the proteins had relatively neutral overall charges. Perhaps hydrophobic and cationic sub-domains on a protein’s surface interact cooperatively with the hydrophobic and anionic ends of phospholipids to carry the protein into lipid complexes during microfluidic assembly. Thus, the overall pI of the protein would be less important, but the physical spatial relationship of cationic and hydrophobic subdomains would be more important. The idea that protein subdomains are important was evidenced by the fact that as few as five molecules of DMPG per molecule of mCherry, produced significant loading. Finally, a protein’s estimated pI is determined from its primary sequence, while a functional pI is dependent upon its surface charge and usually determined by isoelectric focusing or related experimental protocols50. This fact further complicates making predictions about packaging from theoretical pI values. Molecular modeling of the interaction of individual proteins with anionic lipids such as DMPG might begin to illuminate the details of the packaging process.
It has been shown that mRNA-LNPs prepared by microfluidics methods, such as those employed herein, reach their loading capacity at a RNA:lipid ratio of 1:20 (w:w), at which point no more RNA may be loaded11. Due to the significantly higher partial specific volume of protein (0.728 mL/g) relative to RNA (0.569 mL/g)30, an equivalent weight of protein is expected to take up more volume than RNA. In addition, the payload capacity for protein likely depends upon its interaction with associated anionic lipids in the lumen of the LNP. We began with the same loading ratio, protein:lipid of 1:20 w/w, assuming we might have to reduce the amount of protein to achieve most efficient loading. However, we validated in experimental detail that a 1:20 w:w protein to lipid ratio allowed highly efficient packaging for six diverse proteins. We were unable to package more, with the excess protein precipitating after packaging, during dialysis. Lowering the concentration of the anionic lipid component, lowered the efficiency of packaging. But we cannot say that other lipid compositions might not allow even more efficient protein packaging.
The delivery of functional proteins into the lumen of liposomes by any technique presents special problems, first, due to protein denaturation by organic solvents necessary to dissolve component lipids and second, because the proteins need to be released into the cytoplasm after passing through the plasma membrane. The significant loss of fluorescence when packaging fluorescent proteins at pH 5.5, was to be anticipated because some fluorescent proteins undergo partial denaturation, oxidation, and significant loss of fluorescence below pH 6.051,52,53. Consistent with our results, GFP fluorescence is reported to be more sensitive to acidic pH than mCherry29. We also found that a chloroform-rich solvent was detrimental to maintaining the florescence of fluorescent proteins and to the immunological activity of TRZ. These problems were partially solved by dissolving the lipids in TFE:EtOH (Solvent #2) and the proteins in pH 7.0 PBS.
Cryogenic Transmission Electron Microscopy (Cryo-TEM) has emerged as an effective method for distinguishing lipid monolayer from lipid bilayer LNP membranes, and in particular, the structure of RNA-LNPs prepared by microfluidics14,45,54,55,56. Since there is no such literature on EP-LNPs prepared by microfluidics, we draw on the RNA-LNP literature to interpret our results. The lipid membrane structure of RNA-LNPs is more complex than might have been imagined. Cryo-TEM shows that RNA-LNP particle populations have a mixture of lipid monolayer and bilayer membranes, often presented as membrane fusions in the outer membrane of one LNP or even lipid bilayer particles within lipid monolayer LNPs12,45,54,55,56. The RNA is often packaged in one bleb of a LNP composed to two such compartments14,45. Our TEM images of negatively stained EP-LNPs gave evidence of some LNP particles with a smaller LNP packaged inside.
Potential applications of EP-LNP technology
Reliable efficient methods of making stable EP-LNPs that efficiently penetrated the cell membrane would expand the number of potential therapeutic target ligands by orders of magnitude. This in turn would expand the numbers of novel classes of therapeutic proteins and polypeptides employed as therapeutics. Take as a first example therapeutics for cancer. Hundreds of proteins involved in neoblastic transformation of cancer cells are located on the plasma membrane, but even more within the cytosol, endosomes, and nucleus. However, nearly all the clinically approved antibody therapeutics target receptors exposed on the surface of cancer cells57,58,59. As an example, monoclonal antibody Trastuzumab binds to the Epidermal Growth Factor Receptor 2 (HER2) on the cell surface. Antibodies do not efficiently cross the plasma membrane, so immune reagents that attack intercellular targets have not made it to the clinic. Enzyme based anticancer therapies have been in practice for decades60, but nearly all suffer the same limitations and target ligands in serum or on cell surfaces. Even smaller anticancer peptides typically attack the plasma membrane61,62,63, but their activities are generally limited by short half-lives due to proteolytic degradation in serum61,64. It has been suggested that anticancer peptides delivered in nanoparticles would have improved serum stability, better cell penetration, and therefore enhance antitumor activity62,64. By contrast, clinically approved low MW agents targeting components in signal transduction pathways inside cancer cells, such as Copanlisib, Binimetinib, Dabrafenib, Alpelisib, Palbociclip, and Olaparib57, can penetrate the cell membrane. That said, even the delivery of such small molecule drugs to within cells benefits from their being packaged in lipid nanoparticles65.
Aberrant signal transduction also plays a critical role in cardiovascular disease66, respiratory disease67, and diabetes68. All these diseases are rich in intercellular ligand targets that might be treated with highly specific immune reagents or protein inhibitors delivered as EP-LNPs61,62,64. The ability to package active anti-disease antibodies and protein inhibitors in the lumen of LNPs and efficiently deliver them to the cytoplasm and nucleus would stimulate research and open up numerous new treatment options for these diseases.
CRISPR/Cas9 technology can edit genomic DNA correcting harmful mutations, and thus, it holds great promise for treating hundreds of diseases. Cas9 is a large protein (~160 kDa, pI 9.1), similar in size to IgG, which carries a relatively small CRISPR sgRNA. Because the controlled intercellular delivery of CRISPR/Cas9 RNP complexes through the plasma membrane is inefficient and limits its utility, various nanomaterials are being explored as carriers16,17,18. For example, Lipofectamine®, a mixture of cationic lipids, has been used to package the RNP into lipid complexes, but most such lipid complexes are unstable and must be used immediately after their preparation69,70. The EP-LNP technology presented herein may dramatically enhance the efficiency the delivery of CRISPR-Cas9 RNPs in the clinic and for gene editing of agriculturally or industrially relevant plants, fungi, or bacteria. Long-term stability would enable better characterization of editing reagents. In summary, the enhanced microfluidic luminal packaging of proteins and peptides in EP-LNPs as described herein has the potential to improve the efficacy of a wide variety of therapeutic agents, benefit basic research, and generate new markets for therapeutic EP-LNPs.
Consider as an additional example of the utility of EP-LNPs, the limitations of current therapeutics used to treat deadly invasive fungal pathogens. There are several million individuals with invasive fungal infections reported around the globe and ~1.5 million associated deaths annually71,72,73,74,75,76. Due to the growing numbers of individuals on immunosuppressants as part of their therapies for some cancers, stem cell and organ transplants, for medical device implants, and for inflammatory diseases74,77, the at-risk population has been increasing for five decades. With few exceptions, fungal infections are treated with only four classes of small molecule drugs, triazoles, echinocandins, polyenes, and nucleotide analog antimetabolites78,79,80,81. Nearly all of these drugs have been in use for two to seven decades. Hence, there is a desperate need for new antifungal drugs and treatment strategies81,82. The same fungal-specific pathways treated by low MW antifungal drugs could be targeted by antifungal proteins delivered as EP-LNPs. Consider the long complex pathway for the synthesis of ergosterol83. Ergosterol is a chemical analog of cholesterol and replaces cholesterol in the bilipid membranes of most fungal pathogens. Starting with squalene, several of the early enzymatic steps for the biosynthesis of ergosterol and cholesterol are shared between the fungal and mammalian pathways, respectively84. However, in the billion-plus years since these two kingdoms diverged, the sequences of the shared enzymes have diverged significantly. The last few steps required for the fungal synthesis of ergosterol are not found in mammals. Therapeutic antibodies that bind the fungal enzymes, but not the mammalian enzymes, should be relatively easy to generate. For comparison, polyenes target ergosterol in the fungal membrane and triazoles target ergosterol synthesis. Both classes of drugs are only slightly less toxic to humans than to fungi. Drug resistance is increasingly common for most antifungals and often only requires a single mutation in the target gene. Triazole resistance has emerged independently all over the globe due primarily to mutations in the P450 cyp51A. By contrast, antibodies or protein antimetabolites that specifically inhibit any of the more than a dozen intercellular enzymes required for ergosterol biosynthesis delivered as EP-LNPs should overcome these problems and should be less sensitive to small numbers of resistance mutations in the target enzymes. We showed that EP-LNPs were efficiently taken up by R. delemar, which predicts real potential for developing protein therapeutics to treat invasive fungal infections.
Conclusions
Our microfluidic luminal encapsulation of proteins in EP-LNPs enjoyed high packaging efficiency and stability and they penetrated cells efficiently. We propose that our simple benchmark protocol at pH 5.5 or 7.0 with solvent #2 has the potential of being widely employed for delivering diverse proteins of interest to cells and tissues and being used in basic and clinical biomedical research in the near future. Some components of our model for protein packaging were well supported, such as the benefits of employing anionic lipids and the stability of the resulting EP-LNPs. The role of pH was measurable, but appeared less important than we had modeled. However, many important variables and applications of EP-LNP technology have not been explored. For example, what other anionic lipids will promote protein packaging? Will including ionizable triple-tailed lipids benefit the late endosomal release of protein 85? Will the efficacy of packaging functional proteins improve significantly if we test more variables? Will extensive structural analyses of EP-LNPs reveal differences from RNA-LNPs? Will antibody EP-LNPs targeting signal transduction pathways in cancers open up novel therapeutics that are currently only achievable by small molecules 57?
Materials, methods and protocols
Reagents
We purchased the following lipid reagents from the indicated sources: DMPG 14:0 PG (1,2-dimyristoyl-sn-glycero-3-phospho-(1’-rac-glycerol) sodium salt) (CAS 200880-40-6, Broad Pharm, BP-26310); DMG-PEG-2000: (3-(2-(2-methoxyethoxy) ethoxy)-2-tetradecanoyloxypropyl) tetradecanoate (CAS 156543-00-9, Broad Pharm, Cat.# BP-25496); DSPC: 1,2-distearoyl-sn-glycero-3-phosphocholine (CAS 816-94-4, Millipore Sigma Cat.# P1138); Cholesterol (Millipore Sigma CAS 57-88-5, Cat# PHR1533); SM-102 (CAS 2089251-47-6, Broad Pharm) # BP-25499, heptadecan-9-yl 8-(2-hydroxyethyl-(6-oxo-6-undecoxyhexyl)amino octanoate); DHP (CAS 2197-63-9, Broad Pharm # BP-29565, Dihexadecyl Phosphate, Broad Pharm) and DMPGA (CAS 80724-31-8, Broad Pharm # BP-29572, 1,2-dimyristoyl-sn-glycero-3-PA sodium salt). DMPG is widely used in FDA approved non-LNP pharmaceuticals. No significant toxicity has been reported for this lipid86,87.
We packaged six proteins with diverse properties into EP-LNPs. Bovine serum albumin (BSA, Sigma, #A7906) has a molecular weight (MW) of 66.3 kDa and a pI of 5.388; goat IgG immunoglobulins (Sigma Aldrich, I9140) is a mixture of proteins with MWs of ~148 kDa and pI values ranging from 6.3 to 8.789; Trastuzumab (TRZ, Fisher Scientific, Cat# 502269445, LT1500-1MG) is an IgG1 with a MW of 145 kDa and an approximate pI of 8.790. The isoform of Trastuzumab we employed is a recombinant human IgG1 biosimilar of Herceptin® with identical variable regions to the human therapeutic antibody 4D5-8 and human IgG1 constant regions and used in the clinic. TRZ binds to the HER2 receptor (Human Epidermal growth factor Receptor 2) in HER2+ neoplasms35 and on HER2+ breast cancer cells grown in vitro such as SKBR3 with a dissociation constant (Kd) of ~3 nM (i.e., 44 ng TRZ/mL)91. We also examined three fluorescent proteins, blue EBFP292, green Venus93 and red mCherry92. The genes encoding our His6 tagged isoforms of EBFP2, Venus, and mCherry were synthesized (Supplementary Fig. 1) and cloned under control of a Galactose regulated T7 promoter in pET45b+ plasmid vector by GenScript. We expressed these three proteins in Nico21 E. coli cells (New England Biolabs, # C2529H) following IPTG induction and purified them using Ni(I) resin affinity (Qiagen, #30210) following the resin manufacturer’s recommended protocol for native proteins eluting with increasing concentrations of imidazole at pH 8.0 and storing them at 4oC, similar to the methods we described recently94,95.
Our benchmark lipid mixture contained DMPG, DSPC, Cholesterol, and DMG-PEG-2000 at mol percent ratios of 50:10:38.5:1.5 dissolved in either Solvent #1 (chloroform:ethanol, TCM:EtOH, 1:1 v:v) or Solvent #2 (trifluoroethanol:methanol, TFE:MeOH, 4:1 v:v) (Supplementary Table 1). During the course of this study, we found that while the chloroform-rich solvent was very effective a promoting protein loading, it was detrimental to maintaining the fluorescence of fluorescent proteins and the immunological activity of TRZ. This problem was solved by delivering lipids dissolved in Solvent #2. The protocols we used and lipid content of these mixtures resembled that used in assembling Moderna’s Spike mRNA-CoV2 vaccine, a mRNA-LNPs14, except that we replaced the dominant ionizable cationic lipid component of their vaccine SM102 with the anionic phospholipid DMPG. The lipid stocks were prepared in glass scintillation vials, stored at 4oC, and just before use heated to 60oC to redissolve lipids, cooled to room temperature, and diluted to a concentration of 4 mg total lipid in 750 μL of Solvent #1 or #2 for microfluidics. Just prior to packaging, protein stocks were diluted to ~200 ug/2.4 mL in one of two buffers: A5.5 (pH 5.5 25 mM sodium acetate buffer with fresh 2 mM beta-mercaptoethanol) or PBS (Dulbecco’s Phosphate Buffered Saline, pH 7.0, Corning, DPBS #21-031-CV). The w:w ratio of protein to lipid was maintained at 1:20, except where noted.
Four other lipid mixtures were prepared in which the dominant anionic DMPG component was substituted with another lipid. The structures of these other lipids are shown in Supplementary Fig. 2. The SM-102 mix contained 50 mol % of the ionizable cationic amino phospholipid SM-102. This lipid mixture was identical in all lipid components and mol % ratios to the lipids used in Moderna’s Spike mRNA-LNP vaccine. A second lipid mixture, the DSPC mix, which was dominated by the cationic amino phospholipid DSPC (Supplementary Fig. 2D), with DSPC:Chl:DMG-PEG-2000 at mol percent ratios of 50:45:5. This is quite similar to lipid composition as that of preformed liposomes from FormuMax (# F20203A), which we have used to prepare pathogen receptor targeted liposomes96. In the two other anionic lipid mixtures, DMPG in our benchmark mix was replaced with 50 mol % of one of two phospholipids, DHP or DMPGA, respectively. These four lipid mixtures were dissolved in Solvent #2.
Conjugation of Rhodamine to TRZ and IgG
TRZ (1000 ug, 6.8 nmoles) and goat IgG (1000 ug, 6.8 nmoles) were dialyzed into freshly prepared 0.1 M sodium carbonate pH 8.3 and the volume adjusted to 200 uL. A five-molar excess of Rhodamine-NHS, 68 nmoles (Thermo Fisher #46406) dissolved in 2 uL of DMSO was slowly added to the antibody samples with continuous gentle stirring at 23oC over a 1 min period. After 1 h, the reactions were stopped by the addition of 1/10th volume of 1 M glycine (pH 8.0). After 10 min, the reactions were dialyzed overnight into 1000 volumes of ½ strength PBS to remove remaining traces of non-conjugated Rhodamine and stored at 4oC in the same buffer. The stability of TRZ’s immunological activity after conjugation with NHS reactive tags was reported previously97 and was confirmed experimentally herein.
Microfluidic assembly of protein lipid complexes and EP-LNPs
Protein-lipid complexes were prepared on medium volume scale microfluidic instrument Nanoparticle PG-SYN-F NanoGenerator Flex-M (PreciGenome, San Jose, CA). PreciGenome reported obtaining LNPs with diameters of 60 to 120 nm using their instruments, recommended protocols, lipid reagents, and chips. We followed the company’s general instructions for set up and operation of the instrument and used their microfluidic chips (CHP-MIX-4). The aqueous protein and organic lipid mix were pumped through the microfluidic chip at a 3:1 v:v ratio, respectively, at a combined rate of 2 mL/min. Protein lipid complexes in the product chamber were immediately transferred to a dialysis cassette (Thermo Sci. #A52971) and dialyzed for at least 3 h into 100 volumes of cold pH 7.5 TAS2 buffer (20 mM Tris base, 13 mM glacial acetic acid, 9% w/v sucrose) and stored at 4oC. The only exception to this assembly protocol was made to accommodate the potential acid instability of fluorescent proteins, wherein, we added enough 1 M pH 8.0 Tris buffer to the dialysis cassette to immediately neutralize the pH 5.5 packaging buffer, prior to initiating dialysis. After each run, the system was flushed with water and anhydrous ethanol, before shutting the instrument down or before the next microfluidic protein loading experiment.
Once the liposome assembly program is initiated, the FLEX-M instrument does not pump either aqueous or organic sample through the microfluidic chip until both channels are delivering reagents as programmed, in our case at a 3:1 ratio and a total flow rate of 2 mL/min (i.e., 1.5 mL/min for the aqueous phase and 0.5 mL/min for the organic phase). At the beginning and end of the run, when organic and aqueous channels do not meet these requirements, the excess reagents are diverted into a waste reservoir. These parameters (flow rate and psi for both channels, duration in seconds) can be confirmed in real time, because they are shown on the LED screen during and at the end of each run. This feature of the NanoGenerator ensures that packaging within the chip adheres to the selected parameters. We typically recovered 75–80% of protein reagents in the product reservoir. Because this excluded material was not included in the product (a mixture of EP-LNPs and unpackaged protein), we measured the precise output volume of product after each run and accounted for this mechanical loss of protein before making calculations of packaging efficiency.
Assays of protein packaging efficiency
Dialyzed EP-LNPs were concentrated and washed free of unbound protein by centrifugation at 6000 x g for ~60 min at 4oC through a 300,000 MWCO VIVASPIN 2 spin filter (Sartorius #VS0251). If even a trace of visibly denatured protein was present after dialysis, it was removed from the EP-LNP preparation prior to spin filter concentration by centrifugation for 2 min at 2000 x g. LNPs do not sediment unless significantly higher levels of centrifugal force and centrifuge times are used. This step prevented denatured protein from clogging the spin filter, which would have dramatically extended filtration times. It should be noted that we confirmed the spin filters did not retain significant amounts of free protein, including the largest proteins BSA and IgG in TAS2 buffer. The first flow through (filtrate) was saved to estimate un-encapsulated free protein and % packaging efficiency (Equation #1). Because LNPs cause light scattering, which compromises fluorescence and A280 absorbance measurements, samples of the various EP-LNPs were lysed by incubating for 30 min at 37oC in 0.5 % Triton X100 (BioRad #161-0407)11. Fluorescence was examined in a 2-fold dilution series in PBS in a 96 well plate. The fluorescence of EBFP2, Venus, and mCherry98 were recorded at Ex356/Em461, Ex512/Em552 and Ex 587/Em613, respectively, and both TRZ-Rhod-LNPs and IgG-Rhod at Ex540/Em580 on an Agilent BioTek Synergy H1 Multimode reader (Fisher Sci., Cat# 11129533). The percent packaging efficiency was estimated by taking the ratio of amount of fluorescent protein measured in the lysed EP-LNP fraction relative to that in the EP-LNP fraction plus the filtrate x 100 as shown in Equation #1. The values recorded for the first well in each 2-fold dilution series, which contained protein in 0.5% Triton, often fell slightly off the Log2 plot for amount of protein relative to the rest of the dilution series and were omitted from making estimates of encapsulation efficiencies.
The yield of fluorescent protein recovered from microfluidics was calculated using a standard curve generated from a dilution series of the unpackaged protein after lysis in 0.5% Triton-X100. The percent efficiency of protein recovered in EP-LNPs and filtrate together was estimated using Equation #2. The non-fluorescent IgG-LNPs and BSA-LNPs were lysed in 0.5% Triton X100. However, Triton interfered with the sensitive Qubit fluorescent protein assay (ThermoFisher #Q33211). Therefore, the amount of protein in IgG-LNPs and BSA-LNPs and filtrates were quantified using the Lowry assay99, which employs the Folin & Ciocalteu’s Phenol Reagent. The assay was performed as described in the original publication, except that the volumes of all reagents were proportionately reduced so that the protein sample volume was 30 uL and the final volume was 230 uL per well in a 96-well microtiter plate. A 2-fold dilution series was assayed. Absorbance of the developed reagent color was read at A600 in a BioTek Synergy H1 instrument. Percent encapsulation efficiency was estimated using Equation #1. Prior to the assay, both the IgG-LNPs and BSA-LNPs were concentrated to 200 uL on the Vivaspin 2 spin 300,000 MWCO filters and their filtrates were further concentrated to 200 uL on 10 kDa MWCO spin filters. Higher initial protein concentrations enabled more accurate Lowry assays. When mCherry protein was mixed with empty LNP and spun through a 300,000 MWCO filter, essentially all the protein was recovered in the FT fraction. Hence, mCherry did not appear to have any particular affinity for the exterior of the LNPs or for the filter membrane.
Particle size
The size distribution of EP-LNPs was determined on a NanoFCM Flow Nanoanalyzer (NanoFCM INC., China). NanoFCM Silica Nanospheres Cocktail #1 (S16M-Exo, diameter 68-155 nm) size standards (107-1012 particles/ml) were used to standardize the instrument and ensure the accuracy of our EP-LNP size estimates. Just prior to flow analysis the LNPs were diluted to 107/mL in DPBS, and then diluted further to single particles with a large excess of ultrapure diWater sheath fluid, as they were analyzed individually by light scattering on the NanoFCM instrument. TEM analysis of PTA-stained EP-LNP particles was performed on a JEOL JEM1011 instrument with images taken at 100 or 120 kV (Supplemental Fig. 6A). LNPs were also examined on a Malvern Zetasizer (Model ZEN3600), which uses dynamic light scattering (DLS) to characterize particle populations. This instrument requires very high particle concentrations (1012/mL). The DLS data for mCher-LNPs and Venus-LNPs are shown in Supplemental Fig. 6B. The average particle sizes were estimated at ~200 to 450 nm, respectively. Although, we occasionally saw a trace amount of the sample running in the 70 to 100 nm range. Replicate experiments with other EP-LNP preparations gave similar or even larger particle size estimates. We ascribe these larger size estimates by DLS as due to the aggregation of LNPs into multimers, resulting from the orders of magnitude higher particle concentrations used for DLS relative to the other two methods (flow and electron microscopy). Therefore, we continued to use the smaller size estimates from the flow instrument and TEM. The Zeta potential for our anionic LNPs was approximately -34 mV, as compared to +45 mV for typical cationic mRNA-LNPs11. A negative Zeta potential value for our EP-LNPs was to be expected, considering they are composed of 50 mol % phospholipid, DMPG.
Transfections with EP-LNPs and unencapsulated proteins
A549 HER2 negative lung cancer cells (American Type Culture Collection, ATCC CRM-CCL-185)100 and SKBR3 (SK-BR-3, ATCC HTB-30) HER2+ breast cancer cells were grown in RPMI-1640 media lacking phenol red dye (Sigma-Aldrich, Cat# R8755, St. Louis, MO, USA) supplemented with 10% fetal bovine serum at 37oC in a 5% CO2 atmosphere. A549 cells were grown in 24 well plates and treated with Venus-LNPs, mCher-LNPs, unpackaged Venus, and unpackaged mCherry delivering between 10 ug/mL (1:100 w/v, protein/media) and 1 ug/mL (1:1000 w/v) for 2 hrs or overnight. Cells were then washed and photographed. We chose these w/v protein to media ratios to mimic the concentrations commonly employed in antibody labeling experiments.
When high magnification images of mammalian cells or fungal cells were they were grown on home-made reusable glass chamber slides101. Breast and lung cancer cells grown in RPMI FBS media were used to confirm our rhodamine conjugated TRZ-Rhod antibody bound to cells. Cells were washed with PBS and fixed for 30 min with 4% fresh formalin in PBS, washed thrice with PBS, blocked with 0.5% BSA in PBS for 30 min, treated with TRZ-Rhod or lysed TRZ-Rhod-LNPs in PBS for 30 min, and washed twice. The fluorescence of TRZ-Rhod labeled cells was imaged top down through a coverslip. To examine the starvation phenotype, cells grown in chamber slides in RPMI FBS and then switched to Earl’s Balanced Salt Solution (EBSS) (Sigma-Aldrich E7510) minimal media containing TRZ-Rhod or TRZ-Rhod-LNP (1:200 w:v protein:media). Cells were incubated for 3 h, washed twice in minimal media, and photographed top down.
We chose to test EP-LNP delivery into the fungus Rhizopus delemar strain 99-880 (formerly R. oryzae or R. arrhizus, ATCC MYA-4621), because it has a cell wall as an additional barrier compared to mammalian cells and also because its cells are relatively large among fungal pathogens, which improved our microscopic analysis of fluorescent EP-LNP uptake96. Cells were stored as sporangiospores in di-water at 4oC and grown at 37oC in RPMI-1640 media lacking phenol red dye (Sigma-Aldrich, Cat# R8755) with the addition of 0.165 M MOPS (3-(N-morpholino) propanesulfonic acid) (Sigma-Aldrich, Cat# M1254) adjusted to pH 7.0102,103. Ninety-six-well microtiter plates were seeded with 1,000 sporangiospores in 100 uL of media per well. Cells were treated immediately with mCherry or mCherry-LNPs delivering protein at a 1:1,000 w/v ratio and incubated at 37oC. Phenotypes were observed after 5 or 9 h of growth before extensive hyphal growth interfered with imaging. Because R. delemar does not efficiently adhere to microtiter plates and does adhere to micropipette tips, we did not wash them free of reagents. The matrix of hyphal cells in small microtiter wells stabilized hyphal cells for microscopy.
Microscopy and photography
Photographic images of fluorescent EP-LNPs captured on spin filters and the corresponding flow through in the lower chamber were taken using the camera on an iPhone 13 using visible light or in a darken room, while illuminating at A302 with UV light (Entela, Upland, CA, UVM-57 handheld lamp, 95-0104-01).
Human and fungal cells were photographed on an ECHO REVOLVE R4 microscope (VWR, #RVSF1000) using a 10 × 0.3 NA or 20 × 0.45 NA lens bottom up through plastic microtiter plates using combinations of visible light and epifluorescence (TxRED Ex560/Em630 or FITC Ex470/Em525) or using chamber slides101 top down through a 0.17 mm thick coverslip with a 20 × 0.8 NA lens or with a 60 × 1.42 NA lens and oil immersion. To quantify fluorescent data, 10 images were taken for each treatment (N = 10). The area of TxRED (Rhodamine tagged liposomes or mCherry) or FITC (FITC tagged liposome or Venus) channel fluorescence captured from raw image data was quantified using our recently developed AreaPipe subroutine within CellProfiler (v 4.2.5)101. This program automates fluorescent image area data using ImageJ (v A5.3.a). We assigned a value of 5 pixels to those images wherein zero pixels were detected so that fold differences and P-values could be conservatively estimated and plotted on a log scale. When live mammalian cells were employed, Hoechst was incubated with the cells for 30 to 60 min in the first wash step with media and washed out once with media before imaging.
Statistics and graphics
The data from AreaPipe for estimating % efficiency of protein loading, the mole-to-mole ratio of DMPG to mCherry and the number of molecules of protein per LNP (Equations #1 through #5) were processed in Microsoft Excel (version 16.76) and in some cases moved into Graph Pad Prism Version 10.0.2, where Scatter bar plots and xy plots were prepared. P-values were estimated using the Student’s T-Test program, T-Test, in Excel. When a data set from one or both members of a comparison contained non-parametric data (i.e., not normally distributed), more conservative Mann–Whitney PMW values were estimated in Prism.
Responses