Anti-icing properties of nonionic/hydrophilic concentrated polymer brushes and mechanistic insights via their swollen-state analysis
Introduction
According to the Köppen climate classification1, ~40% of the world’s total area is classified as cold districts, corresponding to climate classification symbols (D) and (E) that are detailed in the reference. In these regions, snow and ice adhere to infrastructural equipment2, public transport systems3, and aircraft4, potentially leading to accidents and disasters. For example, the accumulation of snow and ice on traffic lights and road signs prevent them from being clearly interpreted by drivers, thereby increasing the risk of traffic accidents. Moreover, the presence of snow on solar panels significantly reduces the power generation efficiency5,6,7,8. To address these issues, a range of methods have been adopted, including the heating of snow-covered areas9, and the use of snow-melting or anti-freeze agents10 (e.g., propylene glycol or ethylene glycol). However, various hurdles exist in terms of the setup and costs associated with introducing heaters, and it is well-known that anti-freeze agents have a significant environmental impact. Consequently, research into the area of anti-snow/icing surfaces, materials, and technologies has grown in importance in recent years11,12,13,14,15,16. Furthermore, frost control technologies are also in high demand to prevent frost adhesion on the surfaces of heat exchangers, such as those incorporated into the outdoor units of air-conditioners. Because the heat exchange efficiency is significantly reduced when frost forms, a defrosting process is necessary; however, this requires additional energy, and the heat exchange operation must be stopped during this process17. Defrosting also significantly impacts the electric vehicle (EV) sector. More specifically, the defrosting of EV heat exchangers has become increasingly crucial owing to the transition from traditional internal combustion engines to electric power, in which waste heat can no longer be used for defrosting18,19.
Aizenberg et al. summarized the recent research trends in anti-icing surfaces by classifying them as dry- and wet-state surfaces20. Specifically, dry-state surfaces include monolayer films of fluorinated and hydrocarbon-based materials with low surface free energies21, polymer coatings22, and nanostructured surfaces23. Although these surfaces are characterized by environmentally friendly materials, their anti-icing performances tend to be low. In contrast, wet surfaces24,25,26, such as those obtained by infusing nanostructures or polymer cross-linked films with silicone oil, are known to exhibit excellent anti-icing performances. However, the performance degradation and environmental pollution caused by the leakage of infused oil over time are significant problems. To resolve these issues, strategies involving the use of water (as a solvent) obtained from ice or moisture in the air have been proposed27,28. However, the mechanisms of action associated with such strategies, including the properties of the water-lubricated layer, have yet to be fully clarified.
Wet hydrophilic concentrated polymer brushes (CPBs) consist of highly stretched polymer chains end-grafted on a substrate, and they are environmentally friendly systems that obtain their lubrication layer from water present in the air or other sources. When CPBs are used as anti-icing surfaces, high durability is expected under wet conditions owing to their excellent low-friction properties29,30. Furthermore, CPBs act as effective anti-icing surfaces owing to their clear size exclusion effects31,32, which potentially inhibit ice nucleation and crystal growth within the film. In addition, the amount and state of hydration water33 interacting with the polymer chains can be controlled by the selection of an appropriate hydrophilic group of monomers. However, at present, the ice adhesion strength34,35 (τice) has only been described for CPBs prepared using zwitterionic monomers36 and electrolyte monomers37. Notably, the τice values obtained under some conditions were found to exceed 100 kPa, which is considered the standard value for practical applications at temperatures ranging from −18 to −20 °C. It was therefore considered that these systems did not exhibit the full potential of CPBs. Thus, to obtain more effective systems, it appears necessary to develop a superior phenomenological understanding and consequently, mechanistic insights into the functional expression of CPBs.
In this study, the effects of the graft density and other structural factors on the anti-icing functionality of hydrophilic CPBs are investigated in detail, and the low-temperature properties of water present in the CPBs are analyzed to obtain a clear understanding of the anti-icing mechanism associated with hydrophilic CPBs. For this purpose, a nonionic monomer, namely, poly(ethylene glycol) methyl ether methacrylate (PEGMA), is employed because it is typically unaffected by factors such as the ionic strength. The water enclosed in the CPBs is analyzed under low-temperature conditions by means of microscopic Fourier-transform infrared (microscopic FT-IR) absorption spectroscopy and differential scanning calorimetry (DSC). It should be noted here that these techniques are extremely difficult to perform for conventional, thin polymer-brush films owing to their low sensitivities; however, it is expected that the CPB-thickening technology (from the nanometer to micrometer scale)38 will render it possible to perform such analyses.
Results and discussion
Effect of the polymer-brush structure on the anti-icing functionality
A series of polymer brushes with a wide range of brush densities (surface occupancy (σ*) = 0.004–0.46) and film thicknesses (dry film thickness = 10–831 nm)) were successfully prepared and evaluated (pale blue area in Fig. 1a). Notably, these brushes had not been previously synthesized with respect to their anti-icing functionality, although several reports do exist on the syntheses of PolyPEGMA polymer brushes (PPEGMA-PB)37,39. The current approach was facilitated by increasing the molecular weight during brush synthesis, which led to the thickening of the brush film under high-pressure conditions38.

a Relationship between the dry film thickness and the surface occupancy (σ*), which is defined as the normalized graft density per cross-sectional area of the polymer chain (maximum = 1) of the brush samples prepared in this study. b Effect of the brush density on the ice adhesion strength obtained by repeated tests. Only the first test was conducted with n = 2. c Estimated durability for each brush density in terms of the decreasing film thickness. d Dependence of the ice adhesion strength (at −18 °C) on the brush film thickness (n = 2). e Dependence of the ice adhesion strength on the temperature (n = 2). f Temporal change in the shear force applied to the ice pillar during the ice adhesion strength measurements of the CPBs (sample No. 4) and the Si wafer at different temperatures. The dotted line is drawn to guide the eye. The error bars represent the standard deviation (individual data are given in Table S2–S4).
The ice adhesion strengths of the polymer brushes with different densities and almost equal molecular weights (see Table S1 for sample details) were evaluated at −18 °C, and the results are summarized in Fig. 1b. At each brush density, it was found that the ice adhesion strength was significantly reduced by ~1/6 in relation to that of the untreated Si wafer. In addition, focusing on the initial test carried out on a pristine sample (n = 2), it was found that in the CPB region40 with σ* > 0.1, the ice adhesion strength was constantly <100 kPa, indicating an excellent anti-icing functionality. However, in the low-brush-density region of σ* < 0.1, the values were scattered (see error bars in the figure), and the average values were >100 kPa. The high performance of anti-icing in the CPB region, which will be discussed in detail later, was attributed to a certain amount of non-icing water remaining in the CPB, acting as a lubricating layer at low temperatures when the water outside (but in contact with) the CPB layer was iced. Repeated tests carried out at identical locations on the same samples showed significant increases in the ice adhesion strength in the low-density region of σ* ≤ 0.03. In this case (see Fig. 1c), a significant decrease in the dry film thickness (i.e., the grafted amount of the polymer-brush layer) was observed as the number of test cycles increased. In contrast, in the region where the brush density was sufficiently high (σ* ≥ 0.15), both high durability and excellent anti-icing functionality were achieved. Importantly, in the case where σ* = 0.38, the CPB functionality and film thickness were successfully maintained after 10 tests. These significant improvements in the anti-icing functionality and durability were attributed to the ability of the abundant polymer chains to distribute the stress applied during ice peeling at a high graft density. In particular, the high substrate bonding density strongly anchored the swollen layer to the substrate. Additionally, Figs. 1b and 1c compare the brush densities and ice adhesion strengths of the samples with almost equal molecular weights (number-average molecular weight (Mn) = 2–5 × 10⁶), wherein the difference in the graft density essentially represents a difference in the film thickness (dry film thickness = 10–831 nm). Hence, to discuss the effect of the film thickness on the performance durability, similar tests were performed on samples with different film thicknesses in the CPB region (Fig. 1d); no significant changes in the ice adhesion strength were identified at film thicknesses between 25 and 831 nm. In this context, Liang et al.36 reported that the ice adhesion strength depended on the brush film thickness and ascribed this trend to the material-dependent properties41. Other examples of thickness-dependent ice adhesion have been reported by Chaudhury et al.42 and Golovin et al.15 on elastic coatings, which are non-swelling and dominated by elasticity. This is in stark contrast to our CPB system, which is swollen by non-freezing water, indicating a different mechanism of ice adhesion; this will be discussed below a viscosity-dominant point of view. Subsequently, the temperature dependence of the ice adhesion strength was investigated in the CPB region (Fig. 1e). Indeed, an excellent ice adhesion strength (<100 kPa) was confirmed upon reducing the temperature to approximately −20 °C. At lower temperatures, the ice adhesion strength gradually increased to ~500 kPa at −30 °C, a value that has never been reported for the CPB system. Interestingly, temporal changes in the shear force recorded during the ice adhesion strength measurements (Fig. 1f) indicate the presence of a liquid-like interfacial layer, as discussed by Jellinek et al.43; this was apparent even in the low-temperature range between −18 and −30 °C. Notably, this behavior differed significantly from that of the Si wafer at −18 °C, which exhibited almost zero stress immediately after ice pillar rupture at a high ice adhesion strength. This behavioral difference can be explained by considering the swelling of the polymer-brush layer in the presence of non-icing water, which forms a quasi-liquid layer at the interface. Furthermore, the viscosity of this system ultimately governed the ice adhesion strength, resulting in the observed temperature dependence44. Further details regarding these quantitative characterizations were reported separately45.
Low-temperature characteristics of water in the CPBs, and icing-induced partial deswelling of the CPBs
To understand the mechanism associated with the superior anti-icing functionality of the current hydrophilic CPB system, it is necessary to understand the properties of CPB-retaining water. For an in-depth evaluation, the CPB layer was extracted and evaluated in an equivalent swollen state, rather than when it was submerged in water. Specifically, water droplets were dropped onto the CPB surface, and microscopic FT-IR spectroscopy was performed46 in the seepage wetting area using the setup shown in Fig. 2a. The inside of the chamber was expected to be of a certain humidity due to the supply of water droplets and other sources, although dry nitrogen gas (at room temperature, i.e., ~20 °C) originating from liquid nitrogen was introduced into the system. The results of the analysis carried out at room temperature are presented in Fig. 2b, and an image overlay is shown in Fig. S1. The state of the CPB at the outer boundary of the droplet and in its vicinity is assumed to reflect that of the CPB submerged in water, enabling the interfacial conditions between the water-swollen CPB layer and the bulk water to be discussed. As shown in Fig. 2b-(ii), a peak corresponding to the O–H stretching vibrations (~3400 cm−1), which is characteristic of water within the CPBs, was successfully observed in the seepage wetting area. Here, the spectra were normalized with reference to a peak at 2883 cm−1, which originates from the C–H stretching vibrations of the polymer structure. From the relative peak intensities of the O–H stretching vibrations, the swelling ratios (S = WW/WP; WP = polymer weight, WW = water weight) at various positions were calculated using a pre-obtained calibration curve (see the “Methods” section for details), and plotted against the distance from the water droplet boundary (Ddroplet) (Fig. 2b-(iii)). It was found that the S value decreased with an increasing distance from the water droplet, eventually reaching a constant value. It should be noted here that the CPB layer immediately below the droplet should be in the same equilibrium state as in the bulk water due to its direct contact with the water droplets. In addition, the supply of water from the water droplets promotes swelling of the CPB layer through water penetration in the droplet vicinity, where the water-swollen CPB surface is exposed to the air, causing the evaporation/condensation of water and reaching a steady state dependent on the distance from the droplet. At a sufficiently large distance from the water droplets, the degree of swelling should be defined by the relative humidity in the chamber, i.e., in terms of the quasi-equilibrium between the CPB-retaining water and the water vapor. Owing to the low relative humidity in the chamber environment at room temperature, the S value changed rapidly in the vicinity of the water droplets, rendering it difficult to accurately determine the S value at the water droplet boundary upon extrapolation to zero distance (see Fig. 2b-(iii)). However, the significant change in the order of the interference color in the reflected optical image obtained using a white light source (Fig. 2c-(i)) suggests that the S value increased significantly near the water droplets, expectedly reaching the degree of equilibrium swelling in water, which was separately measured by atomic force microscopy to be S = 1.7 (black dotted line in Fig. 2b-(iii)).

a Schematic illustration of the setup employed for FT-IR spectroscopy. b (i) Reflected optical images (overlapped using foreign objects as markers), (ii) microscopic FT-IR spectra, and (iii) swelling ratio (S) values (as a function of the distance from the water droplet) of the seepage wetting areas of the CPBs (sample No. 4) at room temperature. The colors of the spectra in (ii) and the data in (iii) correspond to those of the filled circles in (i), representing the measurement points. The solid black line in (ii) represents the FT-IR spectrum of the CPBs in the dry state, while the black dotted straight line in (iii) represents the saturated value of the swelling ratio (S) in water, as estimated by atomic force microscopy. c (Upper) reflected optical images recorded at (i) room temperature, (ii) − 18.6 °C, and (iii) − 40 °C (after holding for 15 min), and (lower) corresponding schematic cross-sectional diagrams (indicated by the white dotted line in the upper image) of the possible swollen state of the CPBs (sample No. 4). d Relationship between the swelling ratios (S) at different temperatures and the distance from the water droplet or ice. The black dotted line shows the equilibrium swelling of the CPBs in water. After icing of the water droplets, the legend is represented by a triangle rather than a circle. Dice represents the distance from the nearest ice particle. e (i) FT-IR spectra of the CPB-retaining water (sample No. 4) at different temperatures (normalized at 3400 cm−1). (ii) FT-IR spectra (normalized by the maximum value) of the bulk water at room temperature and the iced precursor film.
Subsequently, microscopic FT-IR spectroscopy of the seepage wetting area was performed at each temperature during substrate cooling (see Figs. S2 and S3 for the reflected optical images and spectra recorded at each temperature). In addition, Fig. 2d shows the dependence of the S values on the distance from the boundary of the water droplets or ice at different temperatures. Prior to icing of the water droplets due to supercooling elimination at approximately −20 °C, a decrease in the substrate temperature led to an increase in the relative humidity directly above the substrate. The results obtained at 0 °C showed that, while the overall S value was larger than that obtained at room temperature, it could be smoothly extrapolated to zero distance in the same manner. Moreover, these results provided a greater degree of credence to the aforementioned hypothesis that the water droplet boundary, when extrapolated to zero distance, could be regarded as the degree of equilibrium swelling in water. Upon lowering the temperature to −10.2 °C, a larger S value was detected in the vicinity of the droplets, compared to that observed at equilibrium swelling in water. This result implies the formation of a precursor film47 by supercooled water, wherein the area directly below the precursor film is considered to be in a state of equilibrium swelling in water. Upon further decreasing the temperature, this S value increased continuously, and the precursor film grew (Fig. 2c–(ii)). A thin layer of ice crystals was observed around the water droplets as the droplets underwent icing owing to supercooling elimination at approximately −20 °C. The width of this thin ice-crystal area generally matched the length of the precursor film, indicating that icing of the precursor film had taken place (Fig. S2). After the icing of the bulk water droplets and the precursor film, the boundary of the iced precursor film was set to be the origin of the distance shown in Fig. 2d. Upon icing of the water droplet, the S value close to the boundary decreased significantly from 2.8 to 0.9. In addition, the S value increased with an increasing distance from the ice boundary. These data suggest that some water present in the CPBs was extracted toward the ice, and the CPB layer underwent partial deswelling upon coming into direct contact with the ice (Fig. 2c-(iii)). As discussed below, the water remaining in the CPBs was present in the non-frozen state. It was therefore considered that at a sufficiently far distance from the ice, the degree of swelling is determined in an environment of constant humidity, which is controlled by a gas flow into the chamber, i.e., by the quasi-equilibrium between the externally supplied water vapor and the CPB-retaining water. The distance dependence of the S value was found to negligibly change after holding at −40 °C for 15 min, suggesting that the system rapidly reached a steady state formed by two quasi-equilibrium states of CPB swelling: one just below the ice droplet and the other in contact with the constant humidity vapor at a far distance from the ice boundary.
Among others, the spectra with similar S values (~0.8–1.2), i.e., similar degrees of swelling, at room temperature, 0.1 °C, and −40 °C (after 15 min holding) were selected and compared in Fig. 2e-(i). Almost no changes48 were seen in the O–H stretching vibration peak, which differs significantly from those in the bulk water (measured separately, see the “Methods” section) and ice components (i.e., ice derived from the precursor film), as shown in Fig. 2e-(ii). The interaction of water with a polymer is known to shift the O–H stretching vibration peak of water toward higher wavenumbers because such interactions can loosen the strong hydrogen bonds between water molecules49. The obtained results suggest that over this temperature range, the majority of water inside the CPBs consists of water molecules that interact with polymer chains and do not undergo icing, likely owing to limited ice nucleation growth inside the CPBs, even when iced water was found on the outside of the CPBs (Fig. 2c-(iii)).
The heating process was then evaluated using a protocol similar to that of ice adhesion strength measurements, to discuss the state of the CPB-retaining water. More specifically, following ice pillar formation at −40 °C, the specimens were heated to the desired temperatures. Figure 3a shows the distance dependence of the S value at each measured temperature (see Fig. S4 for the corresponding reflected optical images and FT-IR spectra). For further discussion, some of the S values, especially at locations closer to the ice, were estimated using the relationship50 between the hue in the optical images and the film thicknesses determined by the microscopic FT-IR data (see the “Methods” section for details). At locations sufficiently far from the ice, the S value decreased with temperature owing to the effect of the relative humidity, as also observed during the cooling process. Interestingly, the S value close to the ice increased with temperature, suggesting that re-swelling occurred. Figure 3b shows the temperature dependence of the S value closest to the ice in the acquired data during both the cooling and heating processes. No hysteresis was reasonably suggested, and the S value increased with an increase in temperature; the deviation of the data at −35.6 °C during the cooling process could be attributed to the fact that the observation position was relatively far from the ice, and the actual value should be shifted in the direction of the dotted arrow shown in the figure. These data reinforce the existence of quasi-equilibrium states of CPB swelling immediately below the ice droplet described above. These results demonstrate that a certain amount of non-icing water remained inside the CPBs even after the partial de-swelling occurring during the icing of bulk water, thereby contributing to the anti-icing functionality of this material (Fig. 2c-(iii)).

a Dependence of the swelling ratio (S) on the distance from the ice at different temperatures. The hollow triangles represent the values calculated from the relationship between the hue and the film thickness50. b Dependence of the swelling ratio (S) close to the ice on the temperature during cooling (blue symbols) and heating (red symbols). The filled triangles represent the values calculated from microscopic FT-IR measurements, while the hollow triangles represent the values calculated from the relationship between the hue and the film thickness. The dotted arrow indicates the direction of correction expected from the hue.
To elucidate the behavior of the residual water present in the CPBs, DSC was performed using varying proportions of CPBs and water (Fig. 4a). During cooling, exothermic peaks were observed in the DSC profiles at approximately −20 °C, while during heating, endothermic peaks were observed at approximately 0 °C; notably, the areas of these two peaks were roughly equivalent, incorporating both the bulk water peaks and those extracted from the CPB water immediately after the icing of bulk water. The icing temperature determined by DSC was approximately equal to the temperature at which the water droplets iced owing to supercooling elimination (i.e., as determined by microscopic FT-IR spectroscopy, described above). As shown in Eq. (1), based on the polymer weight (WP), the nonfreezing water content (WNFW/WP)51,52 was calculated using the peak area upon melting (ΔHm/WP), the latent heat of ice melting (LF), and the amount of enclosed water (WW/WP) (see Table S5):
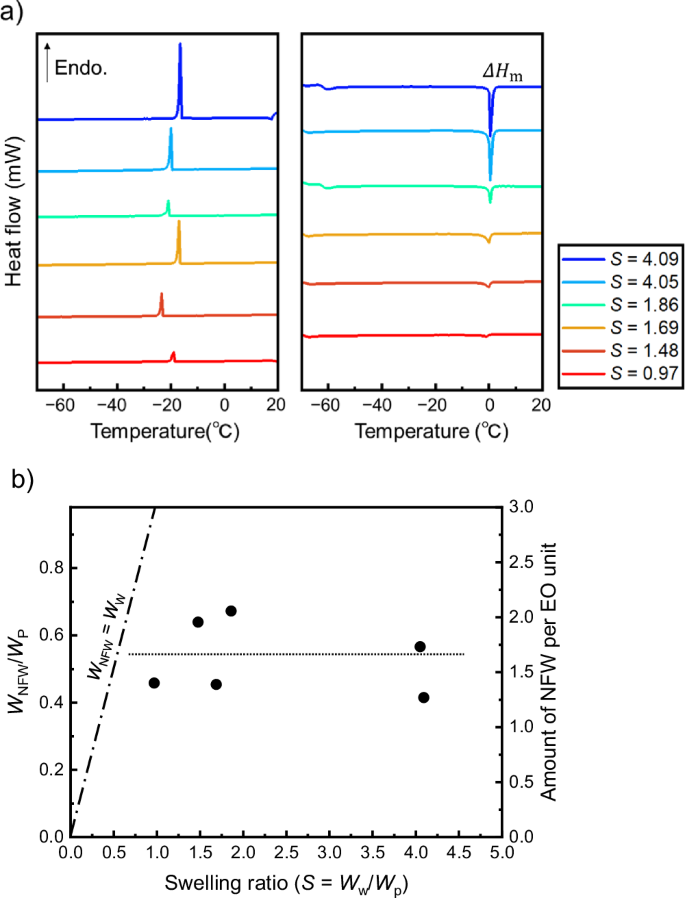
a DSC profiles of the CPBs (sample No. 4) containing different amounts of water during the cooling process (left) and the heating process (right). b Plots of WNFW/WP and the amount of nonfreezing water per ethylene oxide unit as a function of the swelling ratio (S). The auxiliary lines show the relationship WNFW = WW (dashed/dotted line) and the mean value in the vertical axis (dotted line).
Figure 4b shows a plot of the WNFW/WP value and the amount of NFW per ethylene oxide unit as a function of the S value, and the relationship between the amount of added water and nonfreezing water. As the nonfreezing water interacts with the CPB layer through the solvation of the polymer chains, it becomes more stable than the free water. Consequently, the amount of nonfreezing water is regarded as constant when the necessary and sufficient amount of water is enclosed within the polymer (WW > WNFW). The value was therefore estimated to be WNFW/WP ≈ 0.54 ± 0.1, which corresponds to ~1.6 water molecules per ethylene oxide unit in the polymer chain; this value is in good agreement with the results reported by Nishinari et al.53. The microscopic FT-IR spectroscopy results discussed above suggest that the quantity of water remaining in the vicinity of the ice after holding at −40 °C for 15 min was S = ~ 0.7 (Fig. 3b); this value is slightly higher than the quantity of nonfreezing water estimated using DSC. However, it should be noted that DSC facilitates evaluation of the amount of nonfreezing water at −70 °C. Thus, considering the temperature dependence shown in Fig. 3b, the water remaining in the brushes under the conditions used for the ice adhesion strength measurements is generally considered to be nonfreezing water, as defined by DSC.
Conclusions
In this study, the applicability of nonionic/hydrophilic CPBs in the development of anti-icing surfaces was verified, and the properties of the water present in the CPBs at low temperatures were evaluated. The effects of various structural factors, such as the brush density and the film thickness were also investigated in terms of the anti-icing functionality. The results demonstrated that in the CPB region, the functionality was excellent, with a sufficiently low ice adhesion strength and repeated durability, which is desirable for practical applications. Importantly, these results were independent of the film thickness over a range of 25–831 nm. Moreover, the in situ analysis of the water-in-CPB properties under conditions similar to those employed for the ice adhesion strength measurements was carried out using microscopic FT-IR spectroscopy. The obtained results confirmed that the CPB layer in contact with the water droplets (liquid) adopted a state of equilibrium swelling, wherein water penetrated the surrounding CPB area to form a partially swollen layer. In addition, when the supercooled state of the water droplets was released at low temperatures (approximately −20 °C) and the water droplets underwent icing, a certain degree of deswelling occurred in the CPB area that was in contact with these iced droplets. However, the remaining water present in the CPBs did not undergo icing, even at −40 °C. It was therefore demonstrated that these characteristics contribute to the excellent anti-icing functionality of the as-prepared material. Considering that the ice adhesion strength increased as the ice/substrate interface layer solidified, the system effectively acted via a self-coordinating/partial deswelling functionality, which inhibited icing inside the brushes during bulk water icing. No hysteresis was observed during the cooling and heating processes, which was reasonably attributed to the temperature-dependent degree of CPB swelling in contact with ice, indicating a quasi-equilibrium between ice and CPB-retaining water. In addition, the DSC results suggested that the water remaining in the CPBs after freezing of the bulk water could be classified as nonfreezing water. Notably, both the FR-IR spectroscopy and DSC experiments were performed at an ultra-large film thickness, and the results provided new insights. The importance of non-freezing water in the anti-icing function has been noted for some time27,28,36. This study supports this point and is characterized by quasi-equilibrium partial deswelling as a key anti-icing mechanism, allowing only non-freezing water to remain in the film. This concept could be generalized to extremely homogeneous cross-linked films. In this context, these findings are expected to inspire future design strategies that facilitate the development of new anti-icing/snow materials. In the near future, we will build on this research to fabricate highly functional anti-icing surfaces and develop a method for efficiently introducing this functional surface over a large area via an industry/academia collaboration.
Methods
Preparation and characterization of the polymer-brush samples
PEGMA (Mn ≈ 500, 99%) was purchased from Sigma-Aldrich Co., USA. The copper bromide (CuBr, 95%) and copper dibromide (CuBr2, 99.9%) polymerization catalysts were purchased from Wako Pure Chemicals, Japan, as was the 4,4′-dinonyl-2,2′-bipyridine (dn-bipy, >96%) ligand. The ethyl 2-bromoisobutyrate (EBiB, >98%) and 3-(trimethoxysilyl)propyl-2-bromo-2-methylpropanoate (BPM, >96%) polymerization initiators were obtained from the Tokyo Chemical Industry Co., Ltd., Japan. 3-(Trimethoxysilyl)propyl acetate (APTMS, >95%) and poly(methyl methacrylate) (PMMA, analytical standard, Mw = ~98500, Ð = 1.08) were purchased from Sigma-Aldrich Co., USA. Anisole (99%) was obtained from Wako Pure Chemicals, Japan. Reagent grade acetone, chloroform, 2-propanol, tetrahydrofuran (THF), ethanol, and an aqueous ammonia solution (28 wt%) were purchased from Wako Pure Chemicals, Japan. Tetraethyl orthosilicate (TEOS, >98%) was purchased from Tokyo Chemical Industry Co., Ltd., Japan. Chloroform-d (99.8 atom % D containing 0.03 vol% tetramethylsilane) was purchased from Kanto Chemical Co., Inc., Japan. All chemicals were used as received without further purification.
The various polymer brushes were newly prepared via surface-initiated atom transfer radical polymerization (SI-ATRP) according to a previously reported method38. More specifically, a Si wafer (Matsuzaki Seisakusyo Co., Ltd., 525 μm thickness; cut to 8 mm × 12 mm) was subjected to sonication in acetone, chloroform, and 2-propanol, followed by UV-O3 treatment. It was then dipped in an ethanol solution containing BPM (71.2 g ethanol, 0.8 g BPM, 8.0 g NH3 aq. (28 wt%)) overnight to immobilize the ATRP initiator54. When preparing polymer brushes of different densities, the density of the immobilized initiator was adjusted by mixing APTMS with the treatment solution in the appropriate amount55. The relationship between the BPM:APTMS molar ratio and graft density of the produced polymer brush is shown in Figure S5. The polymerization-initiator-impregnated substrates were immersed in a deoxygenated 50 wt% anisole solution containing EBiB (5.2 × 10⁻⁴ mM), PEGMA (1.0 × 10³ mM), CuBr (5.3 mM), CuBr2 (1.5 × 10⁻¹ mM), and dn-bipy (1.1 × 101 mM) in an Ar glove box. After sealing the vial, polymerization was carried out at 400 MPa and 60 °C for the set time (see Table S1 for conditions). Subsequently, the polymer-brush-grafted substrate was sonicated in acetone for 30 min to remove the polymerization residues, and the substrate was dried by blowing argon gas. The thickness of the resulting dried film was measured using an ellipsometer (M-2000U, J. A. Woollam Co., Inc., USA.) to quantify the degree of grafting. For this purpose, the optical constants were determined using the Cauchy model56. As an indicator of the molecular weight and the molecular weight distribution of the grafted polymer, the free polymer formed from the free initiator (EBiB) in the polymerization solution was analyzed by GPC-MALS (Shodex GPC101, Resonac, Japan; DAWN HELEOS II, Wyatt Technology, USA) under the following conditions: column system = Shodex LF-G (guard column) + LF-804 × 2; eluent = DMF/LiBr (10 mM); flow rate = 0.8 mL/min; oven temperature = 40 °C. The properties of the prepared polymer brushes are summarized in Table S1. The surface occupancy was calculated using Eqs. (2) and (3):
where ρ is the bulk polymer density, d is the dry thickness of the polymer brush, NA is Avogadro’s constant, Mn is the number-average molecular weight, and ({a}^{2}) is the cross-sectional area of the monomer.
Ice adhesion strength measurements
The ice adhesion strength measurements were performed using a Linkam stage (10073 L, Linkam Scientific Instruments Ltd., UK), as shown in Figure S6. More specifically, the desired sample was fixed to the central cooling stage, an aluminum cylinder (inner diameter = 6 mm) with silicon grease on the end face was placed on top of the sample, and pure water (60 μL) was dropped into the cylinder. After cooling to −40 °C at a rate of 5 °C/min and holding for 30 min, the stage temperature was raised to the desired measurement temperature at a rate of 5 °C/min and held for 30 min. Upon moving the stage, an L-shaped jig attached to the stage via a load cell (maximum load = 200 N) pushed the ice pillar (along with the aluminum cylinder) horizontally with respect to the substrate surface. The maximum load (per cross-sectional area of the ice pillar) applied to the load cell when the ice pillar moved along the surface was defined as the ice adhesion strength. The stage movement speed was set at 0.167 mm/s, and dry nitrogen was flowed into the chamber during the measurements to prevent water condensation.
Fourier-transform infrared spectroscopy
Microscopic FT-IR spectroscopy was performed using an FT-IR microscope (LUMOS II, Bruker, USA) in combination with a Linkam stage (10002 L, Linkam Scientific Instruments Ltd., UK), as shown in Fig. 2a. More specifically, pure water (5 μL) was dropped onto the CPB surface, which was fixed to the cooling stage. The reflected optical image obtained using a white light source was acquired along with the transmitted FT-IR spectrum at a given position in the vicinity of the water droplet. This was achieved by switching the optical system with the microscopic FT-IR system. The analysis was carried out at various times during cooling from room temperature to −40 °C (1 °C/min cooling rate) followed by holding at −40 °C for 15 min. Subsequently, for the heating process, the temperature was raised stepwise to each set temperature at a rate of 5 °C/min and held for 10 min prior to analysis. For the microscopic FT-IR experiments, the aperture size was set to 114 × 114 µm2 (for measurements in the vicinity of ice, the size was adjusted to avoid the inclusion of ice) and the number of integrations was 32. When the microscopic FT-IR measurements were performed over a wide area beyond the observation range of the reflected optical image, the sample position was moved and corrected using foreign objects as markers in the reflected optical image. The reflected optical images were then merged, as shown in Fig. S1. Furthermore, during measurement, a flow of nitrogen was introduced to prevent the condensation of water on the stage and outside the CaF2 measurement window.
To determine the relative amount of water and CPBs (corresponding to the PEGMA unit) from the measured FT-IR spectra, solutions of the PEGMA monomer were prepared in water at various concentrations, and their FT-IR transmission spectra were recorded (Nicolet 8700 FT-IR spectrometer, Thermo Fisher Scientific, USA) after sandwiching the solutions between Si wafers. The FT-IR spectrum of bulk water was also measured according to this method at room temperature. The calibration curve shown in Fig. S7 was obtained to estimate the water/monomer weight ratio (WW/WP) from the ratio between the water-derived O–H stretching vibration peak (~3400 cm−1) and the monomer/polymer-derived C–H stretching vibration peak (~2883 cm−1).
In addition, the hue of the reflected optical image acquired by the microscopic FT-IR system provided information regarding the film thickness50. This information was used to quantify the thickness of the swollen CPBs, especially in the vicinity of the ice crystals. As shown in Fig. S8, the red-green-blue (RGB) data of the reflected optical images were converted to the hue, saturation, and value (HSV) equivalents using ImageJ processing software (Fiji) with reference to the known film thickness obtained from the above-mentioned microscopic FT-IR data (i.e., samples with the same stripe order and equivalent hue were processed at the same degree of swelling).
Differential scanning calorimetry
The procedure used to carry out the DSC measurements is presented in Fig. S9. An aluminum DSC pan (NGB810419/NGB810420, NETZSCH, Germany) was coated with PMMA using a 10 wt% solution in THF; to ensure accurate DSC measurements, this coating was not applied on the interior of the pan, ensuring that only the polymer brushes were present on the inside of the pan. The partially PMMA-covered DSC pan was dipped in an ethanolic solution of TEOS (71.2 g ethanol, 0.24 g TEOS, 0.6 g NH3 aq. (28 wt%)) overnight to introduce a silica coating. The pan was then cleaned using ethanol, and subsequently dipped in an ethanolic solution of BPM overnight. Finally, the precoated PMMA was dissolved and cleaned using THF, giving the DSC pan with the ATRP initiator immobilized only on the inside. High-pressure ATRP and subsequent cleaning were performed using the same methods as those used for the Si wafer to load the inside of the DSC pan with the CPBs. Subsequently, the obtained CPB-loaded pan was filled with water to sufficiently swell the CPBs, after which most of the water was removed using a wipe, leaving only a small amount of water. The pan containing a small amount of water was then sealed using the corresponding aluminum lid. The amount of loaded water was calculated as the difference in weight before and after water loading. Finally, the DSC measurements were conducted (DSC 3500 Sirius, NETZSCH, Germany) between 20 and −70 °C at heating/cooling rates of 3 °C/min. Upon reaching a temperature of −70 °C, the sample was held for 15 min.
Other analyses and characterizations
The degree of CPB equilibrium swelling in water was evaluated through atomic force microscopy (AFM; Nano Wizard 3, JPK Instruments AG, Germany). A portion of the CPB layer was scratched, and its boundary region was measured by AFM using a cantilever (OMCL-AC240TS-C3, OMCL-RC800PSA, Olympus Corp., Japan) with an attached colloid probe (N3N, Ube Exsymo Co., Ltd., Japan) to obtain the height profiles (tapping mode) and the force-distance curves in the dry and water-swollen states. The force-distance data were used to accurately estimate the swollen thickness of the CPB by correcting the height profile against a non-negligible push-in (in the swelling state) when measuring the step at a constant load. Consequently, the degree of CPB equilibrium swelling in water was determined to be S = 1.74 for sample No. 4, as listed in Table S1.
To confirm that the wettability properties of the various samples, including the reference sample, did not differ significantly, the contact angles were measured using water droplets (2 µL) and air bubbles (8 µL) with the aid of a contact angle meter (DMo-601, Kyowa Surfaces Science Co., Ltd., Japan) (Table S6).

Responses