Identifying neurobiological heterogeneity in clinical high-risk psychosis: a data-driven biotyping approach using resting-state functional connectivity

Introduction
Psychiatric disorders, particularly schizophrenia, demonstrate considerable heterogeneity across various dimensions, including symptomatology, illness duration, and treatment response1,2. This heterogeneity poses a significant challenge in understanding and treating psychiatric disorders effectively, for example, existing pharmaceutical treatments for schizophrenia achieve effectiveness in only around fifty percent of patients3,4. The wide range of outcomes—from complete recovery to persistent disability—underscores the urgent need to resolve this heterogeneity. For instance, Zhang et al. (2020) employed canonical correlation analysis to identify three subtypes within the CHR population, with one subtype defined by pervasive negative symptoms and marked cognitive deficits carried a significantly elevated risk (nearly 40%) of progressing to schizophrenia. Such a stark difference in conversion rates reveals that not all CHR individuals follow the same trajectory, and that specific subgroups may benefit from intensified clinical monitoring and earlier interventions. Therefore, by dissecting the psychosis into more homogeneous subgroups, clinicians and researchers can better predict outcomes, allocate resources, and formulate targeted treatment approaches.
Historically, the categorization of schizophrenia into subgroups based on cognitive functions or symptomatic similarities has been an attempt to address this heterogeneity5. Notable categories include Type I and Type II schizophrenia, with Type I is associated with positive symptoms like hallucinations and delusions, and Type II is characterized by negative symptoms such as emotional flatness and diminished motivation6. Additional categories, such as deficit and non-deficit schizophrenia, aim to establish more clinically homogeneous subgroups, often linked to severe negative symptoms and poor functional outcomes7,8. These categories emphasize the fact that schizophrenia’s heterogeneity can be defined by both its etiology and symptomatology.
The advent of neuroimaging technology and machine learning has revolutionized the identification of psychiatric subgroups. These developments have made it possible for high-dimensional brain imaging biomarkers to be used for data-driven research, therefore allowing the segmentation of patient populations into more physiologically homogenous groups. For example, Planchuelo-Gomez et al.9 identified two MRI-based psychosis subtypes varying in structural abnormalities, while Sun et al.10 discovered a subgroup of first-episode schizophrenia patients with significant white matter damage and persistent negative symptoms. Moreover, studies by Dwyer et al.11 and Chand et al.12 have further validated these findings by confirming the presence of these subgroups at the onset of psychosis and highlighting their clinical relevance in terms of symptom profiles and treatment responses. Jiang et al.13,14 employed the SuStaIn algorithm on a large, multi-cohort dataset to identify two reproducible neurostructural subtypes in schizophrenia, one with early cortical loss and another with early subcortical changes. Furthermore, Clementz et al.15 used cognitive and electrophysiological data to identify three biotypes with different degrees of neurocognitive impairment. Later researches have validated these findings; for example, compared to healthy controls, individuals from Biotype 1 exhibited the most severe impairment, whereas Biotype 3 showed no significant differences16,17. This converging body of evidence demonstrates the feasibility of data-driven subtyping in psychiatry, highlighting diverse biological pathways within ostensibly unitary diagnoses.
Nevertheless, some identified subtypes may reflect graded impairments (e.g., volume loss or symptom severity) influenced by factors like illness duration and antipsychotic exposure, especially in chronic samples18,19. This has prompted a shift toward studying Clinical High-Risk (CHR) psychosis20, where milder symptoms and preserved reality testing enable the identification of early neurobiological changes before chronicity and treatment effects confound results. Despite minimal effects from medications or disease progression, the CHR group exhibits considerable variability in clinical outcomes, ranging from full recovery to the development of severe psychiatric conditions21,22,23,24. To better understand this variability, data-driven approaches have been used to find possible clinical categories within the CHR population depending on symptoms and cognitive function. For example, Valmaggia et al. identified four clinical subtypes within a high-risk cohort, with one subtype showing severe negative symptoms and high rates of psychosis conversion (41.2%)25. Healey et al. expanded on this by incorporating cognitive variables, further validating the link between cognitive impairments and negative symptom subtypes26. Notwithstanding this understanding, the complexity of psychiatric disorders continues to pose challenges. Grouping patients based just on clinical symptoms usually fails to capture the underlying neurobiological processes, as evidenced by conflicting findings regarding clinical conversion rates in subtype of CHR2,27. Moreover, the model proposed by Cornblatt et al.28 for predicting clinical conversion rates cannot be strictly applied to similar samples in the CHR population with attenuated positive symptoms29.
Existing subtyping studies of CHR and schizophrenia often rely on clinical symptoms or structural MRI, which may not fully capture the dynamic functional interactions within the brain. The resting-state functional networks captures spontaneous brain activity patterns, reflecting the functional organization of brain networks30,31,32, which is crucial for understanding complex psychiatric conditions like psychosis33,34,35. To so separate the neurobiological variability of the psychosis spectrum, we present a data-driven method employing machine learning and high-dimensional biomarkers from resting-state functional networks. The Single-cell Interpretation via Multi-kernel LeaRning (SIMLR) algorithm, specifically designed for single-cell data analysis (which shares similar high-dimensionality challenges), integrates multiple data representations, capturing both local and global similarities between individuals, leading to more accurate and stable subtype identification36,37. We hypothesize that this approach will identify and validate distinct neurobiological biotypes of CHR, suggesting that biological heterogeneity precedes the onset of psychiatric disorders. Unlike schizophrenia biotypes that differ along a singular dimension, CHR biotypes are expected to exhibit distinct neurobiological patterns, providing deeper insights into the pathophysiology of psychiatric disorders.
Methods and materials
The study received approval from the Institutional Review Board of the Shanghai Mental Health Center, which also serves as the recruitment site for the Shanghai At Risk for Psychosis (SHARP) program (Ethical No.2020-100). Written informed consent was obtained from all participants or their legal guardians.
Participants
This study recruited 239 participants from the SHARP program, comprising 151 CHR subjects and 88 age, sex, and education-matched healthy controls (HCs)38. Initial screening involved the self-report Prodromal Questionnaire-Brief version (PQ-B)39. Prospective participants qualified if they met at least one criterion of the prodromal syndrome during the Structured Interview for Prodromal Symptoms/Scale of Prodromal Syndromes (SIPS/SOPS) in a face-to-face interview40. Additional inclusion criteria were an age range of 13–45 years and a minimum of 6 years of education. Exclusion criteria included severe somatic diseases and substance dependence. Over 95% of the CHR subjects were drug-naive at the time of enrollment.
Neurocognitive assessments for both CHR and HC subjects were conducted using the Chinese version of the Measurement and Treatment Research to Improve Cognition in Schizophrenia (MATRICS) Consensus Cognitive Battery (MCCB)41. This battery included the Trail Making Test: Part A (TMT), Brief Assessment of Cognition in Schizophrenia: Symbol Coding (BACS_SC), Hopkins Verbal Learning Test-Revised (HVLT-R), Wechsler Memory Scale-Third Edition (WMS-III): Spatial Span, Neuropsychological Assessment Battery (NAB): Mazes, Brief Visuospatial Memory Test-Revised (BVMT-R), Category Fluency Test: Animal naming (Fluency) and Continuous Performance Test-Identical Pairs version (CPT_IP). Overall functioning was assessed using the global assessment of functioning (GAF). The other inclusion criteria included an age range of 13–45 years and ≥6 years of education, while the exclusion criteria included severe somatic diseases and substance dependence.
Image acquisition and preprocessing
Neuroimaging data were acquired using a 3 T Siemens MR B17 (Verio) system equipped with a 32-channel head coil. For the T1-weighted images, a magnetization-prepared rapid gradient echo (MP-RAGE) sequence was used with the following parameters: TR, 2500 ms; TE, 2.96 ms; FA, 9°; 256 × 240 matrix; voxel size, 1 mm3, and 192 slices. For resting-state functional MRI (rs-fMRI) scans, a gradient echo planar imaging sequence was used with the following parameters: TR, 2500 ms; TE, 30 ms; FA, 90°; field of view (FOV), 224 mm × 224 mm, 64 × 64 matrix; slice thickness, 3.5 mm; and 37 interleaved axial slices. A total of 149 volumes of 2.5-s TR each (total duration ~6 min) were collected during the eyes-open and awake resting states. Participants were instructed to maintain fixation on a white cross displayed at the center of a black screen during the scan. If any excessive head movement or signs of sleep were observed, the scan would be repeated.
Functional connectome reconstruction was performed using Conn (v21b)42 and SPM1243 software, using a flexible preprocessing pipeline including realignment, slice-timing correction, outlier detection, segmentation of gray matter, WM, and cerebral spinal fluid (CSF), normalization to the Montreal Neurological Institute space, and smoothing using an 8 mm full width at half maximum Gaussian filter44. Potential outlier scans were identified using ART45 as acquisitions with framewise displacement above 0.9 mm or global BOLD signal changes above 5 standard deviations46, and a reference BOLD image was computed for each subject by averaging all scans excluding outliers.
Additionally, functional data were denoised using a standard denoising pipeline44, which included regression of potential confounding effects characterized by white matter timeseries (5 CompCor noise components), CSF timeseries (5 CompCor noise components), motion parameters and their first order derivatives (12 factors)47, outlier scans (below 41 factors) session effects and their first order derivatives (2 factors), and linear trends (2 factors) within each functional run. Following the regression of motion covariates, WM, and CSF signals, the residual time signals were band-pass filtered with a 0.008–0.09 Hz range. To account for possible transient magnetization effects at the beginning of each run, individual scans were weighted by a step function convolved with an SPM canonical hemodynamic response function and rectified. ROI-to-ROI functional connectivity was computed between each region of the Chinese Brain Atlas48 at the individual level, resulting in a 246 × 246 correlation matrix with Fisher-transformed bivariate correlation coefficients.
Biotype construction and validation
To identify the latent homogeneous subgroup of CHR subjects, the single-cell interpretation through multikernel learning (SIMLR) algorithm was performed based on FC features correlated with symptom severity. SIMLR represents a novel unsupervised clustering method that utilizes multiple kernels to uncover the inherent low-dimensional statistical representations of high-order data37. Unlike hierarchical clustering methods and the self-organizing map (SOM) approach, SIMLR employs a data-driven heuristic to estimate the optimal number of clusters, thus reducing the subjectivity and arbitrariness in user-defined methods.
The primary steps in biotype construction involve optimizing hyperparameters and conducting final cluster analysis. These steps encompass feature selection, clustering via SIMLR, and cluster quality evaluation. Hyperparameter optimization is repeatedly conducted to determine the most robust number of clusters through a loop operation involving a random subset of 90% of the subjects. During each of the 500 iterations, clinical symptom scores are analyzed in conjunction with FC strengths to identify features significantly associated with at least three symptoms (p < 0.005). These selected connectivity features are then processed through SIMLR’s internal heuristic cost function to estimate the optimal number of clusters and corresponding cluster labels. The results, including the number of features selected, are logged for subsequent validation. To assess the reproducibility of the clusters across iterations, a multiclass support vector machine (SVM) model, specifically using the “fitcecoc” function in Matlab, is trained on the selected connectivity features49. This model uses tenfold stratified cross-validation to differentiate between biotypes.
Throughout the process of random subsampling, the estimated optimal number of clusters was consistently three in 390 out of the 500 iterations. Given this strong evidence, the final clustering analysis was conducted on all CHR samples using three clusters as the predetermined number of categories. The stability of this final clustering solution was evaluated using the Normalized Mutual Information (NMI) index50, a measure that quantifies the similarity between two sets of cluster assignments and assesses the stability of our final clustering relative to the iterative process. Furthermore, a multiclass Support Vector Machine (SVM) was employed to learn and predict the cluster labels. This process involved tenfold cross-validation and was repeated 500 times with random sampling to ensure the robustness and accuracy of the predictions.
Statistical validation
The comparative analysis of biotype profiles in terms of cognitive function and clinical symptoms was conducted using SPSS (version 16.0, SPSS Inc., Chicago, IL, USA). Demographic and clinical characteristics were evaluated using suitable statistical methods, including independent t-tests or one-way analysis of variance (ANOVA) for continuous variables, and chi-square tests for categorical variables. Differences in FC between the three identified biotypes and the healthy control (HC) group were assessed using cluster-based parametric multivariate statistical analysis, with adjustments for gender, age, and education level. A connection threshold was set at an uncorrected p-value of less than 0.005, and cluster-level significance was corrected for false discovery rate (FDR) at a p-value of less than 0.05.
To elucidate the neurochemical underpinnings of observed FC differences, we implemented a series of correlation analyses between the connectivity patterns and neurotransmitter distribution. Specifically, the differential connectivity patterns between each biotype and HC were binarized at a significance threshold of p < 0.005. The resulting binary matrices were summed along the ROI dimension, separately for positive and negative difference relative to HCs for each biotype. This process yielded a representation of node abnormality across the Brain Atlas with 246 ROIs. Next, the neuromaps.parcellate.Parcellater class was employed to transform and parcellate neurotransmitter image files, extracting the mean value within each region of the 246 ROIs51. Finally, we computed correlations between these connectivity patterns and mean neurotransmitter distribution for the 39 mean receptor distribution maps52 https://github.com/netneurolab/hansen_receptors/tree/main/data/PET_nifti_images, producing a correlation matrix and corresponding p-values. To mitigate the risk of false positives due to multiple comparisons, the p-values were adjusted using the mafdr function in Matlab with BHFDR parameter.
Results
Demographic, clinical, and cognitive profiles of CHR biotypes
The demographic, clinical, and neurocognitive characteristics of the participants are detailed in Table 1. The CHR group was comparable to the HC group in terms of demographic characteristics such as sex, age, and education. While the CHR group exhibited more pronounced symptoms than the HC group, there were no significant differences among the three CHR biotypes in this regard. It is important to note that negative symptoms were marginally significant (p = 0.091), but post-hoc comparisons indicated that Biotype 3 exhibited greater symptom severity compared to Biotype 1 (p = 0.040, Fig. 2A). Performance on MCCB tests was significantly poorer in the CHR group compared to controls (p < 0.002, Fig. 2C), with the exception of the CPT-IP, which had a p-value of 0.090. Among the three biotypes, only the WMS-III_SS test showed statistical significance (p = 0.023), and post hoc comparisons revealed that Biotype 2 was significantly worse than Biotypes 1 and 3 (p = 0.017 and 0.045, respectively) in spatial working memory performance (Fig. 2B).
Identification and stability evaluation of CHR biotypes
Among 30,135 pairs of ROI-ROI features, 646 pairs exhibited a significant correlation with SIPS symptoms (p < 0.005) among 151 CHR subjects who underwent subsequent clustering (Fig. 1A, B). These connectivity features were distributed among the subcortical, somatomotor, ventral attention, and visual networks (Fig. 1C). Three clusters were identified based on the search procedure implemented in the SIMLR algorithm, and the optimal number of three clusters was consistent with previous biotype studies, particularly the B-SNIP project. The identified biotypes comprised 29.8%, 19.2%, and 51.0% of the CHR samples, respectively.

A Selection process of FC features. Correlations were calculated between 19 SIPS items, two GAF scores, and FC measures. Features significantly correlated (p < 0.005) with at least two clinical symptoms were selected. Red indicates significant positive correlations, blue indicates significant negative correlations, and white indicates non-significant correlations. B Bar graph summarizing the sum of significant correlations between connectivity and SIPS/GAF items. The horizontal axis shows the total number of correlations, and the vertical axis lists the items. C Visualization of the significantly correlated functional connections, displaying only those with correlations in more than 12 items. Node colors represent different resting-state brain networks, and node sizes, as well as line thicknesses, are proportional to the number and proportion of functional connections. D Biotype prediction accuracy with 3 biotypes in 390 out of the 500 iterations. The green bars represent training accuracy, while the pink bars represent test accuracy. E Histogram of Normalized Mutual Information (NMI) distribution with 3 biotypes in 390 out of the 500 iterations in blue and randomly shuffling the sample labels in red.
To assess cluster stability, a multiclass model of the Support Vector Machine (SVM) classifier was trained to recognize the distinctive patterns of FC in the training subset using tenfold cross-validation. The optimized classifier achieved overall accuracy rates of 98.45% and 84.54% for the training and testing sets, respectively. For individual biotypes, the predicted accuracies were 97.86%, 98.29%, and 98.68% for training, and 82.18%, 85.60%, and 85.56% for testing across Biotypes 1, 2, and 3 respectively (Fig. 1D). As illustrated in Fig. 1E, the SIMLR clustering consistently shows higher NMI values, with the majority falling between 0.3 and 0.6, indicating stable and reliable cluster assignments. In contrast, the random shuffling of labels results in significantly lower NMI values, predominantly below 0.1, demonstrating poor clustering stability. The NMI results thus suggests that the clustering solution produced by SIMLR is robust and not due to random chance.
Functional connectivity patterns across biotype
As depicted in Fig. 2, each biotype exhibited distinct patterns of FC (FC) abnormalities when compared with HC (Supplementary Table B123 vs HCs Stats Table). For Biotype 1, there were enhanced connections within the bilateral somatomotor networks (Fig. 2D) and reduced connections between the visual and subcortical networks (Fig. 2E). Biotype 2 showed pronounced increases in connectivity among bilateral subcortical networks, including the nodes of the thalamus (45%), striatum (44%), amygdala (6%), and hippocampus (3%). This biotype also demonstrated increased connectivity between the visual, dorsal attention, and somatomotor networks. Notably, there were clear reductions in connectivity observed between bilateral visual networks and between the somatomotor and subcortical networks. In Biotype 3, the pattern was primarily characterized by increased connectivity between limbic and subcortical networks, as well as between limbic and somatomotor networks. There was a broad distribution of reduced connectivity across various networks, with the exception of the visual and dorsal attention networks. The most significant reductions in connectivity were noted cross-hemispherically, involving bilateral subcortical and somatomotor networks. The biotype-specific abnormalities followed a progressive pattern, where Biotype 1 exhibited the mildest abnormalities and Biotype 3 the most severe. Furthermore, contrasting patterns of connectivity were observed between the bilateral somatomotor networks (Biotype 1 vs. Biotype 2, Biotype 3) and within subcortical areas, including the thalamus and striatum (Biotype 2 vs. Biotype 3, Fig. 2F).
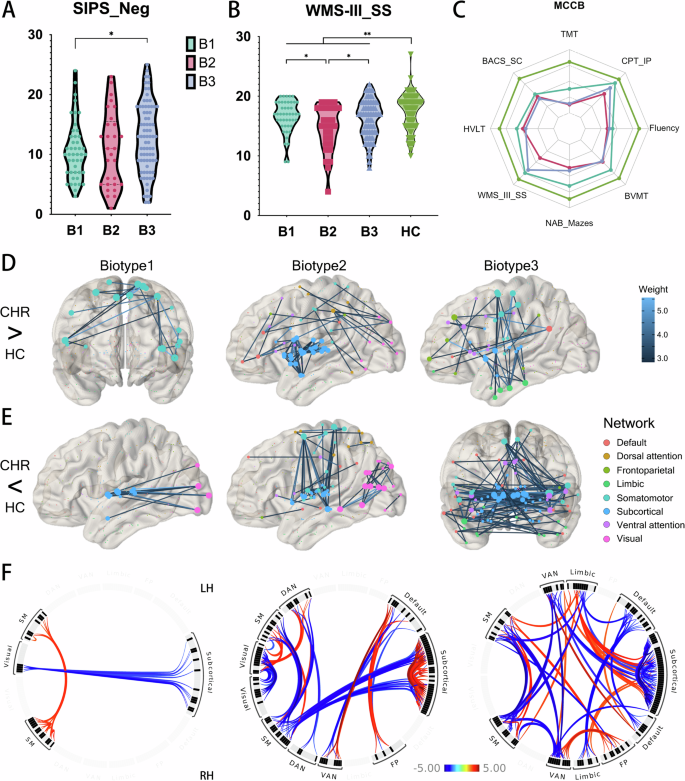
A Post-hoc comparison of SIPS negative symptom scores across biotypes, showing that Biotype 3 has significantly higher negative symptom scores than Biotype 1 (p = 0.040). B Comparison of WMS-III_SS (Working Memory) scores across biotypes and HC. HC group demonstrates significantly better working memory performance than CHR groups (p = 0.001). Among CHR biotypes, Biotypes 1 and 3 show superior performance compared to Biotype 2 (p = 0.017 and 0.045, respectively). C Performance in various cognitive function tests of the MCCB, demonstrating that the CHR group exhibits significant functional impairment, with no significant differences among subtypes except for the WMS-II_SS mentioned in (B). D Enhanced FC in each biotype compared to HC, with line color corresponding to the magnitude of statistical differences. Node colors represent resting-state brain networks. E Reduced FC in biotypes compared to HC, similar to (D) but showing decreased connectivity. F The circos plot visualizes abnormal FC between different resting-state brain networks among biotypes. Red indicates enhanced connectivity in biotypes than in HC, while blue indicates reduced connectivity in biotypes compared to HC. CHR Clinical High Risks for Psychosis, HC health control, SIPS Structured Interview for Prodromal Symptoms, WMS-III_SS Wechsler Memory Scale-Third Edition: Spatial Span, SM Somatomotor, DAN Dorsal attention, VAN ventral attention, FP Frontoparietal.
Neurotransmitter correlates of abnormal functional connectivity
The results of correlation analyses offer an exploratory examination of the relationship between aberrant across CHR biotypes and various neurotransmitter systems, including serotonin, acetylcholine, norepinephrine, dopamine, and opioid systems (Fig. 3). Regarding the increased functional connectivity relative to HC, B2 demonstrated the most extensive correlations with neurotransmitter systems, including serotonin transporters (5-HTT; r ≈ 0.62–0.74), dopamine D1 and D2 receptors (r ≈ 0.54–0.70), dopamine transporter (DAT; r ≈ 0.62–0.66), and vesicular acetylcholine transporter (VAChT; r ≈ 0.72–0.74). B1 had limited associations, with only a positive correlation of norepinephrine transporter (NET; r = 0.246), while B3 showed no significant correlations after Bonferroni correction. Regarding the decreased functional connectivity, B3 exhibited moderate to strong correlations with serotonin transporters (r ≈ 0.49–0.53), dopamine systems (D1, D2, DAT; r ≈ 0.13–0.32), norepinephrine transporter (r ≈ 0.29–0.43) and other receptor systems such as M1, CB1, and MOR (r ≈ 0.20–0.52). Moreover, the pattern of associations between enhanced functional connectivity in B2 and neurotransmitter concentration distributions follows an overall opposite tendency to the pattern identified in regions with lower functional connectivity in B3. Further details of the correlation results can be found in the supplementary materials.
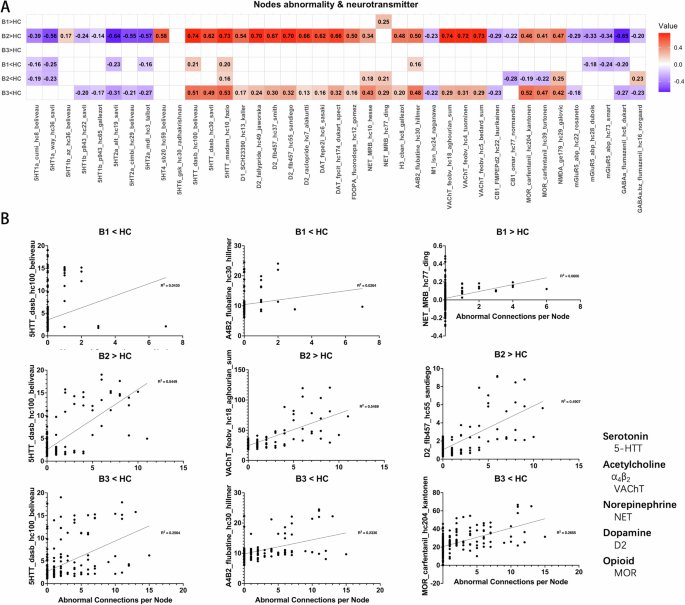
A Correlation matrix between FC abnormalities and neurotransmitter templates under different comparison conditions. Red indicates that as neurotransmitter concentration increases, FC abnormalities become more severe. Blue indicates the opposite relationship. B Scatter plots showing the correlation between neurotransmitter concentrations and FC abnormalities for each subtype. The title of each scatter plot denotes the comparison with HC. The horizontal axis represents the number of abnormal functional connections, and the vertical axis lists the corresponding neurotransmitter and its source. All neurotransmitter concentration templates are derived from the built-in data of the Neuromap toolbox (https://github.com/netneurolab/neuromaps). α4β2, a subtype of Nicotinic Acetylcholine Receptor. VAChT Vesicular Acetylcholine Transporter, NET Norepinephrine Transporter, D2 Dopamine Transporter, MOR Mu Opioid Receptor.
Discussion
The present study aimed to establish distinct biotypes based on FC patterns and evaluate their correlations with clinical symptoms, cognitive performance, and neurotransmitter systems, thereby clarifying the neurobiological heterogeneity with clinical high-risk (CHR) states for psychosis. Our findings provide compelling evidence for the existence of three distinct CHR biotypes, which vary not only in their FC profiles but also in their degrees of symptom severity and cognitive deficits, particularly the pronounced negative symptoms in Biotype 3 and the impaired working memory in Biotype 2. Biotype 1 showed enhanced somatomotor connectivity, Biotype 2 displayed increased subcortical and cross-network connectivity, and Biotype 3 had widespread connectivity reductions except for increased limbic-subcortical connections. These differences are not merely statistical artifacts but potentially reflect different pathophysiological pathways leading to psychosis.
Although the CHR group was demographically similar to the healthy control (HC) group, it exhibited severe symptoms and inferior performance on neurocognitive assessments, including the MCCB tests, with exceptions like the CPT-IP. The overall poorer performance on MCCB tests underscores the presence of cognitive deficits as a core feature of psychosis risk53,54,55,56. Among the three identified biotypes, the analysis of cognitive profiles revealed significant differences only in working memory tasks, in that Biotype 2 showed poorer performance in the WMS-III_SS test compared to both Biotype 1 and 3. The CHR group’s cognitive heterogeneity may be subtle, as evidenced by the relative lack of significant differences in other cognitive domains. This emphasizes the need for more sensitive cognitive measures and longitudinal assessments to fully characterize the cognitive trajectories of different CHR biotypes.
Identification of CHR biotypes
While there are notable cognitive function differences and symptom presentation between the CHR and HC groups, the resting-state FC does not show significant differences when these groups are compared. However, when examining each CHR biotype separately, distinct patterns of FC alterations emerged in comparison to HC, and the relationships between FC and neurotransmitter concentrations also varied between biotypes. This apparent discrepancy highlights the importance of considering the neurobiological heterogeneity within the CHR population. It also underscores the value of subtyping approaches in uncovering neurobiological differences, which may be masked when treating CHR as a homogeneous group57.
Previous research has highlighted the presence of clinical subtypes in CHR57,58,59 and biological biotypes in schizophrenia60,61,62,63. However, these studies were often conducted on individuals who had been exposed to long-term medication or were in more advanced stages of the illness. By highlighting the advantages of CHR being free from the effects of medicine and disease course, our findings extend previous research in that heterogeneity in psychosis can occur as early as when individuals are in the prodromal phase of schizophrenia and other psychotic disorders. The SIMLR clustering algorithm’s revelation of the stability of three CHR biotypes was verified through rigorous cross-validation and normalized mutual information (NMI) analyses, indicating that the clustering solution is robust and not the result of coincidence. These finding challenges previous notions that heterogeneity might primarily arise from factors related to long-term illness or medication exposure.
Distinct functional connectivity patterns across biotypes
When the CHR group is stratified into distinct biotypes, the picture becomes much clearer. Each biotype exhibits unique patterns of FC alterations that were not apparent in the overall CHR versus HC comparison. Biotype 1, which shows the mildest cognitive impairments and the least severe connectivity disruptions, exhibited only subtle FC abnormalities. The enhanced connectivity within the somatomotor network might reflect compensatory mechanisms or heightened sensorimotor integration, which has been observed in early stages of psychosis64,65. The reduced visual-subcortical connection may indicate early disruptions in sensory processing pathways, which are recognized as essential in the pathophysiology of psychosis66,67,68. Despite these abnormalities, Biotype 1 had the slightest correlations with neurotransmitter systems, indicating that neurochemical alterations are not as pronounced in this subgroup.
Biotype 2 demonstrated significant enhancements in connection among bilateral subcortical networks, especially concerning the thalamus and striatum, as well as increased connectivity between visual, dorsal attention, and somatomotor networks. These rsFC alterations are likely connected to the marked working memory deficits observed in this subgroup. The thalamus, a key relay station in the brain, plays a critical role in filtering and gating information flow to the cortex69,70,71 The hyperconnectivity observed in Biotype 2 could be indicative of heightened thalamocortical dysregulation, potentially impairing the neural synchronization required for working memory maintenance. This aligns with other studies associating thalamo-cortical dysconnectivity with working memory deficits in schizophrenia72,73. Furthermore, the observed increased connectivity between visual, attentional, and somatomotor networks in Biotype 2 may indicate compensatory mechanisms or heightened sensitivity to external stimuli, aligned with previous findings linking aberrant salience to psychosis risk33,74.
Conversely, Biotype 3 had the most severe connectivity abnormalities, characterized by widespread decreases in connectivity across several networks, particularly in cross-hemispheric connections involving the subcortical and somatomotor networks. This biotype also demonstrated increased connectivity between limbic and subcortical networks, as well as between limbic and somatomotor networks. These abnormalities likely contribute to the profound negative symptoms and cognitive impairments characteristic of this biotype. On the one hand, the extensive connectivity reductions in Biotype 3 suggest a breakdown in the integrative functions of these networks, which are critical for maintaining coherent cognitive and emotional processes. On the other hand, the limbic system’s involvement is particularly noteworthy, as it plays a crucial role in emotion regulation and has been repeatedly implicated in the development of psychosis75.
Neurotransmitter correlates and mechanistic insights
The correlation analyses between FC abnormalities and neurotransmitter systems provide crucial insights into the potential neurochemical underpinnings of the identified biotypes. The distinct patterns of correlations across biotypes indicate that the pathophysiology of each subgroup may be influenced by distinct neurotransmitter systems. Biotype 1, which exhibited the weakest correlations overall, showed significant but subtle associations with the serotonin transporter (5-HTT) and norepinephrine transporter (NET). The serotonin system has been implicated in the modulation of mood and cognition, and its disruption is a well-known feature in a variety of psychiatric disorders, including psychosis76,77. In Biotype 2, the strongest correlations were observed across neurotransmitter systems, including the serotonin transporter (5-HTT), dopamine (D2 receptors), and acetylcholine (VAChT). These results suggest that a pervasive disruption of enhance FC as a compensatory response to increased neurotransmitter activity. This aligns with findings that heightened neurotransmitter activity may lead to enhanced neural synchronization and thus result in overloading of cognitive systems32,78,79. In contrast, Biotype 3’s negative correlations with neurotransmitter systems indicate an alternative process, maybe involving neurochemical deficiency or receptor desensitization. The opioid system’s involvement, especially the significant correlations of MOR, suggests a potential role in regulating the intense negative symptoms seen in this biotype. This corresponds with findings from several studies that have associated MOR activity with anhedonia and social disengagement in psychosis80,81.
Furthermore, one of the most notable differences is the opposing trends in neurotransmitter-connectivity relationships between Biotype 2 and Biotype 3, highlighting the heterogeneity in neurochemical underpinnings of the CHR population. The opposing pattern might explain some of the inconsistencies reported in previous studies regarding neurotransmitter changes in psychosis. For example, some studies report increased dopamine activity linked to hyperconnectivity82, but others find the opposite, particularly in schizophrenia that responds to first-line antipsychotic drugs83.
While our study provides valuable insights into the neurobiological heterogeneity of CHR states, several methodological considerations and limitations should be acknowledged. Firstly, the cross-sectional nature of the data restricts our capacity to ascertain the temporal stability of these biotypes over time and their prognostic significance for clinical outcomes. Longitudinal studies are needed to address these questions and to examine how biotype membership may change with disease progression or intervention. Secondly, the sample size, although sufficient for the clustering analyses performed, may limit the generalizability of our findings. Larger multi-site studies would be beneficial to corroborate these findings and explore potential sub-biotypes or rare neurobiological profiles. Thirdly, future research should examine direct indicators of neurotransmitter activity, such as magnetic resonance spectroscopy (MRS) or positron emission tomography (PET) imaging, as the correlation analyses between FC and neurotransmitter systems were exploratory in nature. Finally, just as Siddiqi et al. demonstrated the convergence of lesion, TMS, and DBS effects on a common circuit for depression84, future research could identify specific circuits associated with distinct CHR biotypes and develop targeted neuromodulation strategies for each.
In conclusion, this study emphasizes the importance of recognizing and addressing the heterogeneity within the CHR population. The distinct cognitive, symptomatic, and FC profiles of the biotypes underscore the complexity of psychosis risk states and suggest that different pathophysiological mechanisms may contribute to the risk of psychosis. The identification of these biotypes represents a significant step towards a more precise understanding of psychosis risk and may inform the development of personalized prevention and intervention strategies.


Responses