Machine learning-based prediction of antipsychotic efficacy from brain gray matter structure in drug-naive first-episode schizophrenia

Introduction
Schizophrenia is a severe mental disorder of unknown etiology, dramatically impacting multiple domains of patients’ daily living, such as sustaining social relationships, holding employment, and living independently1. The current approach to treating schizophrenia with medication involves choosing drugs based on a patient’s symptoms and adjusting them as needed depending on how well the patient responds. Since there are no reliable ways to predict how a person will react to a specific drug, it often takes several attempts to find the most effective treatment. Meanwhile, the effectiveness of initial treatment is critical to long-term compliance and therapeutic outcomes2, and initial treatment response serves as a prognostic indicator of clinical outcomes and is a prerequisite for symptomatic remission and functional recovery3. However, a suboptimal initial medication selection can significantly compromise treatment efficacy4. Given the importance of early treatment response, recent research has increasingly aimed to identify biomarkers that can predict treatment outcomes in patients with schizophrenia. Such advancements would enhance the precision of medication selection and optimize treatment strategies.
Suffering from schizophrenia can lead to changes in the brain’s structure similar to those caused by neurotoxicity5, implicating the brain’s gray matter configuration as a potential indicator of antipsychotic therapy efficacy. Traditional univariate analyses have identified and validated brain structure anomalies in individuals with schizophrenia6. However, these analyses often reflect inter-group differences and are not readily applicable to individualized treatment decisions. Machine learning approaches offer substantial potential for individual-level feature integration and have shown promise in improving treatment and prognostic predictions for schizophrenia7.
Using a machine learning approach, researchers classified remission and non-remission groups using the gray matter volume (GMV) of the parahippocampal gyrus, achieving an accuracy rate of 79%8. Besides, Koutsouleris et al. (2018) accurately predicted the treatment response of schizophrenia patients to rTMS based on gray matter structural characteristics, including changes in GMV across various brain regions, with an accuracy of 84.8%9. A relatively small sample study combined GMV and schizophrenia polygenic risk score features to predict the efficacy of a 6-week treatment, achieving an accuracy of 86%10. However, another study indicated that using baseline GMV from the dorsolateral prefrontal cortex, temporal lobe, and hippocampus to predict antipsychotic treatment outcomes showed limited predictive utility11, highlighting the limitations of relying solely on single brain structure markers for forecasting treatment response.
Beyond GMV, both cortical thickness (Ct) and the gyrification index (GI) are pivotal in reflecting the brain’s morphological properties and have been proven to predict treatment outcomes in schizophrenia patients effectively12,13. Ct refers to the shortest distance between the pial surface and the gray-white matter boundary at each vertex on the cortical surface, reflecting the size, density, and arrangement of neurons, glial cells, and neural fibers14. GI refers to the ratio between the cortex embedded within the sulci and the cortical surface exposed to the brain surface, which measures the degree of cortical folding15. A recent meta-analysis found reduced Ct in three regions of the default mode and salience networks in first-episode schizophrenia patients, including the right middle and superior temporal gyri, right insula, and right anterior cingulate gyrus16. Additionally, increased GI was observed in the right parahippocampal and lingual gyri17, while reduced GI was noted in the prefrontal cortex and insula18,19. Incorporating metrics such as GMV, Ct, and GI can gain a more comprehensive understanding of brain gray matter morphology, enhancing the precision of detecting morphological changes20, This approach allows for better identification of minor and often overlooked brain structures associated with disease pathophysiology and the efficacy of acute pharmacological interventions. Unfortunately, there has been limited research using these comprehensive indicators. Furthermore, antipsychotic treatment can contribute to progressive brain changes in patients with schizophrenia21. Therefore, research on patients with first-episode schizophrenia (FES), especially drug-naive patients, can eliminate potential confounding effects of antipsychotic drugs and secondary impacts that might alter the brain’s longitudinal changes, such as social isolation, substance misuse, and weight gain, offering a better opportunity to study early-stage brain structural characteristics that relate to treatment efficacy22,23,24.
Hence, this study proposed using machine learning techniques to combine various indicators, including GMV, Ct, and GI, to predict the treatment efficacy at the acute stage (3 months post-treatment initiation) and the maintenance phase (1-year follow-up) for drug-naive patients with FES. These findings could pave the way for establishing objective biological markers to better guide clinical treatment decisions, assist in selecting treatment plans, identify therapeutic targets, and offer insights into precise, personalized treatment strategies.
Materials and methods
Sample
This study was approved by the Ethics Committee of the Sixth Hospital of Peking University (2008-2). Based on a historical prospective cohort25, 130 drug-naive patients with FES were recruited at baseline from the Peking University Sixth Hospital, the Beijing Huilongguan Hospital, and Capital Medical University Beijing Anding Hospital. Inclusion criteria for patients were as follows: (1) diagnosed with schizophrenia according to Diagnostic and Statistical Manual of Mental Disorders (DSM-IV; American Psychiatric Association, 2000)26; (2) aged 18–45 years; (3) experiencing their first episode of schizophrenia with a disease duration of <3 years; (4) not receiving any systemic treatment (continuous medication use for >4 weeks or intermittent medication use for >12 weeks)27,28; (5) meeting the magnetic resonance imaging (MRI) scanning requirements. Patients with a history of serious somatic disease, other mental or neurological disorders, or brain injury were excluded from participating.
Twenty-six patients’ data were excluded due to the low-quality T1-weighted anatomical images. Subsequently, the remaining 104 patients participated in our 3-month follow-up assessments, with only 72 patients available for analysis at the 1-year follow-up.
Clinical assessments
The Positive and Negative Syndrome Scale (PANSS) assessed patients’ positive, negative, and general symptoms29,30. The Personal and Social Performance Scale (PSP) assessed patients’ social functions31,32.
Research procedure
All participants underwent MRI scanning, and informed consent was obtained at the baseline. Clinical symptoms and social functioning were assessed using the PANSS and PSP at baseline, as well as the 3-month and 1-year follow-up measures, as outlined in Fig. 1.

All participants underwent MRI scanning at the baseline, clinical symptoms and social functioning were assessed using the PANSS (the Positive and Negative Syndrome Scale) and PSP (the Personal and Social Performance Scale) at baseline, as well as the 3-month and 1-year follow-up measures. Machine learning algorithms were applied to predict 3-month and 1-year treatment outcomes based on gray matter volume (GMV), cortical thickness (Ct), and gyrification index (GI).
MRI scanning and preprocessing
MRI data was collected on a GE Signa 3.0 T scanner equipped with an 8-channel head coil at the Peking University People’s Hospital, Beijing, China. T1-weighted anatomical images were obtained with the following parameters: matrix size = 288 × 256 mm, field of view (FOV) = 240 × 240 mm, slice thickness = 1 mm, voxel size = 1 × 1 × 1 mm, repetition time (TR) = 9.6 ms, echo time (TE) = 3.9 ms, and flip angle = 13°.
Using the CAT toolbox (http://dbm.neuro.unijena.de/cat12/) based on SPM 12 (Statistical Parametric Mapping, http://www.fil.ion.ucl.ac.uk/spm/software/spm12/), the T1-weighted images underwent processing as follows: (1) quality assessment and exclusion of low-quality images; (2) segmentation and spatial normalization to the Montreal Neurological Institute (MNI) template using the Diffeomorphic Anatomical Registration Through Exponentiated Lie Algebra (DARTEL); (3) modulation of volume using the Jacobian determinant to ensure GMV remained unchanged after registration; (4) smoothing of GMV images using an 8 mm full-width at half-maximum (FWHM) Gaussian kernel, Ct images using a 15 mm FWHM Gaussian kernel, and GI images using a 20 mm FWHM Gaussian kernel.
Pre-processed gray matter images were used for subsequent analyses, including calculation of GMV, Ct, and GI for each participant for subsequent analyses.
Therapeutic effect evaluation and analyses
The therapeutic efficacy for patients with FES at the 3-month acute phase was assessed using the “clinical symptom remission” criteria set forth by the Remission in Schizophrenia Working Group33. According to this criterion, remission is defined as scores of ≤3 on each of the eight specific symptom items of the PANSS: P1 “Delusions,” P2 “Conceptual disorganization,” P3 “Hallucinatory behavior,” N1 “Blunted affect,” N4 “Passive/apathetic social withdrawal,” N6 “Lack of spontaneity and flow of conversation,” G5 “Mannerisms and posturing,” and G9 “Unusual thought content.” Patients meeting this criterion were classified into the remission group, whereas others were categorized as non-remission.
After 1 year of treatment, patients were categorized into rehabilitation and non-rehabilitation groups based on whether they met the criteria for “clinical remission with good social functioning.” The definition of clinical symptom remission remained consistent with the requirements set at the 3-month mark. Patients with a score >70 on the PSP scale, indicating only minor functional issues, were considered to have good social functioning. Conversely, those with a PSP score of ≤70, reflecting varying degrees of functional impairment, were classified as having poor social functioning.
For scores of PANSS and PSP, a series of repeated-measure analyses of variance (ANOVAs) were performed with a 2 (Treatment: Baseline vs. 3-month follow-up) × 2 (Group: Remission vs. Non-remission) design to examine the main effects of the 3-month Treatment and Group. Likewise, for the 1-year follow-up, a series of repeated-measure ANOVAs were performed with a 2 (Treatment: Baseline vs. one-year follow-up) × 2 (Group: Rehabilitation n vs. Non-rehabilitation) design to assess the main effects of the 1-year Treatment and Group. Subsequently, a set of post-hoc simple effects analysis with Bonferroni correction were used to compare group differences (remission vs. non-remission or rehabilitation vs. non-rehabilitation) at each time point (baseline & 3-month/12-month follow-up).
Machine learning algorithm modeling
In this phase, we explored the predictive value of brain MRI gray matter structural features in indicating the efficacy of second-generation antipsychotic drugs using machine learning. The main steps were as follows:
1) Data cleaning and feature extraction: GMV of 90 ROIs based on the AAL template34, and Ct and GI of 68 cortical ROIs based on the DK-40 atlas were extracted as feature values35.
2) Feature selection: Recursive Feature Elimination was employed to a feature set most strongly correlated with the efficacy of antipsychotics, optimizing the predictive performance model based on the prediction accuracy of the Radial Basis Function Kernel (RBF) in the Support Vector Machine (SVM).
3) Machine learning modeling: MRI structural datasets were first normalized using the min-max method to eliminate dimensional influences on the model. The NearMiss method was applied for under-sampling to balance positive and negative class samples. Subsequently, classification prediction of the dataset was performed using various models, including SVM with linear function kernel and RBF, Decision Tree (DT), eXtreme Gradient Boosting (XGBoost), and Logistic Regression (LR), to predict the efficacy of second-generation antipsychotics. The final results were obtained through Leave-one-out Cross Validation (LOOCV).
4) Model predictive power evaluation: Models were assessed using Accuracy, Sensitivity, Specificity, and AUC.
5) Feature contribution quantification: The contribution of feature values to successful prediction efficacy was quantified by the absolute value of the brain MRI gray matter structural feature weights. Brain regions that significantly contributed to the short-term effectiveness of the antipsychotics were identified. The significance of predictive power indicators (Accuracy, Sensitivity, Specificity, and AUC) was assessed using permutation testing with 10,000 permutations.
All SVM, LR, DT, and XGBoost models in this study were built and trained in a Python 3.10.8 environment on a Windows 11 platform. The significance threshold was set to p < 0.05 for all previously mentioned analyses.
Results
Demographic and descriptive information at baseline
In this study, 45 male and 59 female patients with schizophrenia were included, with an average age of 20.87 (SD = 3.27) years and an average education level equivalent to 13.02 (SD = 2.49) years. The mean intracranial volume (ICV) of the patients was 1398.11 (SD = 138.23) cm3, average gray matter volume (GMV) was 652.20 (SD = 59.04) cm3, mean white matter volume (WMV) was 488.83 (SD = 54.57) cm3, and average cerebrospinal fluid volume (CFV) was 256.29 (SD = 49.97) cm3.
Results of ANOVAs
The results of ANOVAs and post-hoc tests indicated that 3 months of treatment significantly improved all clinical symptoms and social functions (main effects of Trentment: Fs > 62.02, ps < 0.001), with the remission group exhibiting even less severe symptoms and better social functions (main effects of Group: Fs > 10.37, ps < 0.002) (see Table S1). Notably, at baseline, the remission group exhibited significantly lower PANSS total scores than the non-remission group (p < 0.001), driven primarily by negative (p < 0.001) and general symptoms (p = 0.008). Conversely, no significant difference was observed in positive symptoms between the remission and non-remission groups (p = 0.268). However, the remission group exhibited significantly lower scores at the 3-month follow-up than the non-remission group (ps < 0.001). Regarding social functions, the remission group exhibited comparable scores on PSP at the baseline (p = 0.301) but lower scores at the 3-month follow-up (p < 0.001) compared with the non-remission group. The results are shown in Fig. 2A and Table 1. More details can be found in Supplementary materials.
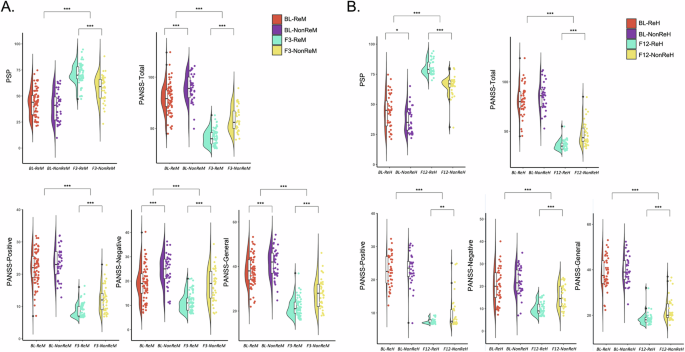
The violin scatter plot illustrates the group differences at baseline as well as the time point after 3-month (A) or 1-year efficacy (B). PSP: the Personal and Social Performance Scale; PANSS: the Positive and Negative Syndrome Scale; BL: Baseline; F3: three-month follow-up; ReM: the Remission group; NonReM: the Non-Remission group; F12: one-year follow-up; ReH: the Rehabilitation group; NonReH: the Non-Rehabilitation group. *p < 0.05; **p < 0.01; ***p < 0.001.
After 1 year of treatment, all clinical symptoms and social functions were improved (main effects of Trentment: Fs > 78.50, ps < 0.001), with the rehabilitation group, exhibiting less severe symptoms and better social functions (main effects of Group: Fs > 4.49, ps < 0.038) (see Table S2). Specifically, the rehabilitation group exhibited less severe clinical symptoms across all subscales of PANSS at 1-year follow-up than the non-rehabilitation group (ps < 0.001), whereas no significant symptom difference was observed between the two groups at the baseline (ps > 0.3). The rehabilitation group exhibited higher scores of PSP at baseline than the non-rehabilitation group (p = 0.030, Cohen’s d = 0.533), and this group difference was further increased after 1 year of treatment (p < 0.001, Cohen’s d = 2.050). The results are shown in the Fig. 2B and Table 2. More details can be found in Supplementary materials.
The prediction of gray matter structural features on the 3-month efficacy of antipsychotics
In assessing the predictive capabilities of different models for the 3-month treatment efficacy, the LR classifier demonstrated optimal performance with an accuracy of 74.32% (p = 0.0001), sensitivity of 81.08% (p < 0.0001), specificity of 67.57% (p = 0.0097), and an AUC of 0.7845 (p < 0.0001). According to the regression coefficients, the 24 features that make the most significant contribution to the predictive value of the LR classifier, such as GI of the right superior temporal gyrus (r = 0.891), Ct of the right rostral middle frontal gyrus (r = 0.769), Ct of the left supramarginal gyrus (r = −0.716), GI of the left post-central gyrus (r = 0.671), as outlined in Table 3 and Fig. 3A. The results of other classifiers can be found in Table S3.
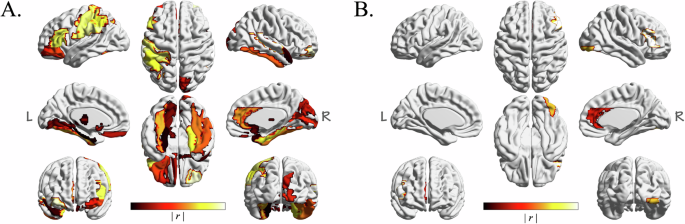
Widespread regions, such as the superior temporal gyrus, middle frontal gyrus, supramarginal gyrus, post-central gyrus, anterior cingulate gyrus, and parahippocampal gyrus, were significant predictors of 3-month treatment efficacy (A). The inferior frontal gyrus, anterior cingulate gyrus, and inferior occipital gyrus demonstrated substantial predictive power for 1-year outcomes (B).
The prediction of gray matter structural features on the 1-year efficacy of antipsychotics
Upon evaluating the predictive capabilities of various models, the LR classifier emerged as the most effective model for predicting 1-year treatment efficacy. This model achieved a classification accuracy of 70.31% (p = 0.0004), a sensitivity of 71.88% (p = 0.0011), a specificity of 68.75% (p = 0.0028), and an AUC of 0.7617 (p < 0.0001). Based on the regression coefficients, the features contributing to the efficacy prediction, ranked from the most to the least significant, were: GI of the right pars triangularis (r = 1.181), GMV of the right inferior occipital gyrus (r = −1.159), Ct of the right caudal anterior cingulate (r = −1.113), and GI of the left inferior frontal gyrus (r = 1.004), as detailed in Table 4 and Fig. 3B. The results of other classifiers can be found in Table S4.
Discussion
In our study, we categorized drug-naive patients with FES into different groups based on their responses to antipsychotics at the end of acute-phase (3-month) treatment, and the 1-year maintenance phase. We compared the baseline characteristics and follow-up data. The results indicated that patients with less severe negative and general symptoms at baseline were more likely to achieve remission after 3 months of acute-phase treatment, whereas patients with better social functions at the baseline were more likely to rehabilitate following 1 year of maintenance therapy. Importantly, our use of machine learning to predict drug efficacy revealed that widespread regions, such as the superior temporal gyrus, middle frontal gyrus, supramarginal gyrus, post-central gyrus, anterior cingulate gyrus, and parahippocampal gyrus, were significant predictors of 3-month treatment efficacy. For 1-year outcomes, the inferior frontal gyrus, anterior cingulate gyrus, and inferior occipital gyrus demonstrated substantial predictive power.
There is significant variability in individual responses to antipsychotic treatments, a long-standing concern for clinical psychiatrists and researchers. This study leveraged machine learning models to explore predictors of an individual’s response to antipsychotics. By merging conventional statistical analysis with machine learning algorithms, our study revealed intricate correlations between brain structure features and treatment outcomes, a feat that previous research often found challenging36. We utilized various machine learning algorithms and validated their predictive accuracy through cross-validation techniques, ensuring the findings’ robustness and reliability. Furthermore, by quantifying the predictive contribution of each feature, we highlighted the potential role of machine learning to elucidate the underlying pathophysiological mechanisms of schizophrenia.
Patients who had less severe negative and general symptoms at baseline were more likely to achieve remission after 3 months of acute-phase treatment, whereas the severity of positive symptoms at baseline had no predictive effect on the 3-month efficacy. It’s probably because second-generation antipsychotic drugs were most effective in managing positive symptoms37, therefore more severe positive symptoms at baseline can hardly affect patients’ remission. Furthermore, our results suggested that responses to antipsychotics could potentially be predicted by examining brain structures before medication. The critical predictive brain regions included the superior temporal gyrus, middle frontal gyrus, supramarginal gyrus, post-central gyrus, anterior cingulate gyrus, and parahippocampal gyrus, which have been consistently found to associate with negative symptoms38,39,40,41,42,43. Moreover, compared with assessing symptoms directly, using gray matter indicators not only provides a more stable, objective measure of brain structure but also enables us to investigate the neurobiological mechanisms of negative symptoms in a way that complements clinical assessment. Given most antipsychotics are poorly effective against negative symptoms44, it’s reasonable that the abnormalities in these brain regions associated with negative symptoms will have a significant impact on the treatment outcomes of patients.
Interestingly, the 24 regions that could predict 3-month efficacy predominantly linked to the sensorimotor network (SMN) and the salience network (SN). As early as the 1990s, Gray et al. proposed that patients with schizophrenia cannot merge previously stored memories of perceptual input patterns with current motor programs that govern perception45, a core function of SMN. Studies using dynamic causal modeling showed that the SN regulates the activity of the default mode network and central-executive networks, a function that is impaired in patients with schizophrenia46. The structural abnormalities in the SN were also related to positive schizophrenia symptoms, such as reality distortion47. Therefore, our findings highlighted that brain structures related to perceptual and mediating abnormalities could predict the efficacy of acute treatment. Abnormalities in the SN in schizophrenia may lead patients to assign inappropriate significance to irrelevant stimuli, contributing to positive symptoms such as delusions and hallucinations. The predictive value of brain regions associated with the SMN and SN for 3-month treatment outcomes likely stems from the fact that treatments during the acute phase target aberrant sensory processing. Both networks play a key role in sensory perception and attention, which are central to the treatment of early-stage symptoms. Thus, improvements in these networks may reflect the reduction of perceptual disturbances, explaining their relevance for short-term treatment efficacy.
Traditionally, the emphasis has been on the short-term response to antipsychotic treatment, with limited focus on long-term efficacy predictions. The current research indicated that it was social functioning, rather than symptom severity prior to medication, could predict rehabilitation outcomes after one year of treatment. More importantly, specific brain structural changes in regions such as the inferior frontal gyrus, anterior cingulate gyrus, and inferior occipital gyrus were reliable indicators of long-term treatment response. Consistently, previous research has documented a decrease in the GMV of the inferior frontal gyrus among treatment-naive schizophrenia patients, a structural abnormality correlated with positive symptoms48. The cingulate gyrus, a critical pathological area in schizophrenia, plays a vital role in conflict monitoring, motivation adjustment, emotion regulation49, executive, and cognitive functions50. Autopsy studies revealed a reduction in non-pyramidal neuron density in the anterior cingulate of patients with schizophrenia, potentially leading to cortical thinning51. Glutamatergic neurotransmitter dysfunction was associated with both positive and negative symptoms of schizophrenia52. Magnetic resonance spectroscopy studies suggested increased glutamate concentration in the anterior cingulate in patients with treatment-resistant schizophrenia (TRS) compared to responders53. Because high glutamate concentration could cause excitotoxicity related to brain structural changes, the elevated glutamate levels in TRS patients might contribute to their abnormal anterior cingulate gray matter structure. Additionally, Anderson et al. have noted reduced occipital GMV in patients with TRS compared to responders54. These findings collectively suggest that abnormalities in certain regions of the frontal cortex, anterior cingulate, and occipital cortex are significant in the pathophysiology of schizophrenia and its various biological subtypes.
The brain gray matter abnormalities identified in this study may provide crucial insights into the pathophysiology of schizophrenia, offering a potential pathophysiological basis for the disorder and its biological subtypes. For instance, a previous study55 we contributed to identified two distinct subtypes of schizophrenia, with differing patterns of brain atrophy in the Broca’s area and hippocampus. These subtypes were associated with different symptom profiles and treatment responses, highlighting the potential for more personalized treatment approaches. By predicting both short- and long-term treatment outcomes, our findings clarify the relationship between brain structure and the efficacy of second-generation antipsychotics during the early stages of first-episode schizophrenia. These insights have the potential to refine patient classification, inform clinical decision-making, and identify biomarkers for treatment response, ultimately paving the way for more personalized treatment strategies and novel therapeutic targets.
This study faced several limitations. First, a significant dropout rate was observed during the 1-year follow-up, and the relatively small sample size hindered our ability to validate our findings with an independent sample set. Consequently, the results should be interpreted cautiously, and a clear need exists for more extensive future studies to confirm these findings. Moreover, although widely used in neuroimaging, our reliance on AAL90 and DK-40 templates for feature extraction in machine learning analysis might have led to the omission of crucial information, as full-brain voxel-level analysis was not performed.
Conclusion
The study employed machine learning methods and discovered that widespread brain regions, such as the post-central gyrus, anterior cingulate gyrus, and parahippocampal gyrus, significantly predicted 3-month treatment efficacy during the acute phase of the illness, with an accuracy of 74.32%. Furthermore, specific brain areas such as the inferior frontal gyrus, anterior cingulate gyrus, and inferior occipital gyrus displayed significant predictive power for long-term (1-year) treatment outcomes, with an accuracy of 70.31%. Overall, our study offers valuable insights into the neurobiological underpinnings of schizophrenia, particularly in treatment-naive patients, and highlights potential targets for future therapeutic interventions.


Responses