Inner Ear Multiple Primary Cell Type Detection System

Background & Summary
In 2023, the World Health Organization (WHO) emphasized that approximately 5% of the global population will suffer from hearing loss with an equivalent number of balance disorders1,2. These sensory mechanisms are located within the inner ear and are influenced by aging, genetics, infections, exposure to noise, and certain medications. The term “inner ear organoid” is a potential multicellular human in-vitro assembly that offers a promising test for hearing loss-related regenerative medicine, drug development, and medical device design3,4. Activating progenitor cells in the inner ear sensory epithelium or replacing lost hair cells with those derived from induced pluripotent stem cells (iPSCs) has provided proof-of-concept (POC) studies in drug development5,6. However, controlling cell differentiation remains a challenge.
Figure 1 (left) illustrates the inner ear structure, highlighting the primary cells extracted from the cochlea. Some studies have focused on counting hair cells in the cochlea, which are well organized and easily observed7; however, mature hair cells cannot interact with other cells. The primary cells depicted in Fig. 1 (right), which include progenitor cells, neural-related cells, F&E (Fibricytes and Ephithekuak) cells, offer insight into cellular interactions and reveal the potential for cell regeneration in medical research. The progenitor cells can differentiate into neural progenitor cells to neural-related cells or hair progenitor cells into hair cells, depending on the specific conditions of the cell culture. Hair cells prefer a low sodium and high potassium environment, whereas neural-related cells prefer a high sodium and low potassium environment, as illustrated in Fig. 1, where they are cultured separately. However, attempts to obtain 100% hair cells or 100% neural-related cells with progenitor cells are unreliable and often require antibody-specific marking with cell sorting technology, such as flow cytometry and microfluidics8,9.

Inner ear primary cell (IEP). The left side demonstrates the structure of the cochlea in the auditory system, which comprises an outer hair cell (OHC) region with a low sodium and high potassium environment that receives audio signals and the nerve fiber containing the neural-related cell region with a high sodium and low potassium environment that transfers these signals. The right side shows IEP cells that include fibrocytes and epithelial cells (F&E cells) labeled in purple, neural-related cells labeled in pink, attached progenitor cells labeled in orange, and suspended progenitor cells that remain unlabeled because they are not attached. (Created with BioRender.com).
These methods separate cells in the fluid that cause significant damage to these fragile cells and cannot provide information on cell interactions10. A reliable cell detection method to analyze the type and distribution of cells is essential to study cell interactions. Therefore, precise image analysis methods for categorizing and quantifying the primary cells in each batch and studying the interactions between these cells are essential. The primary cells of the inner ear with progenitor cells, neuro-related cells, and F&E (Fibricytes and Ephithekuak) cells in this study are shown in Fig. 1.
Understanding the ratio of cell types is essential for creating cell culture references that help identify suitable primary cells for culturing hair cells or neuro-related cells, reducing unnecessary sacrifices of mice. The current commercial cell counting software is widely used in the bio-engineering cell culturing field. It requires specific radius hyperparameter settings for the minimum, average, and maximum radius to count only one cell type at a time. This method works well when detecting a single cell type. However, when multiple types of cells are present, it tends to misclassify and causes significant errors in the cell-aggregate region. It incorrectly merges several cells into one or cuts a large cell into multiple smaller ones, causing substantial errors in the cell-aggregate region.
You Only Look Once (YOLO)s are widely used in cell counting detection9,11,12,13. However, they are imprecise in the cell-aggregated region. To address the challenge of cell-aggregated regions, Wang et al.14 utilized ensemble YOLO models training on 315 iPSC images. Yajie Chen et al.15 predicted the direction field map to facilitate cell counting and training with 100 VGG-cell images. However, these methods require more than 100 images; none of these studies has released related datasets. In this paper, we propose an Inner Ear Multiple Primary Cell Type Detection System (IEP-CDS) with an IEP augmentation process to overcome the data insufficient and image preprocessing methods to overcome detection error in the cell-aggregated region for YOLO models training. In addition, we provide expert-labeled confocal microscope data, which comes from complex cell extraction procedures and is exceptionally rare in cell detection studies. IEP-CDS is the first to address the problem of model errors in cell-aggregated regions for inner ear primary cell (IEP) counting. It can also replace current commercial cell counting softwares, providing a fast and efficient solution for cell counting.
The main contributions of this paper are:
-
The rare IEP cell data with a complex process and professional labeling, which is effective in model training, is released in this study.
-
IEP-CDS utilizes IEP augmentation and preprocessing to address data scarcity, correct detection errors in cell-aggregated regions, and improve the overall performance of the IEP-CDS model.
-
The proposed method surpasses the current commercial cell counting software by more than 50% in F1-score, with a detection time of less than one second.
Methodology
As depicted in Fig. 2, the overview of the IEP-CDS system includes four steps. First, the IEP cells are extracted from mice using a confocal microscope to obtain the cell nucleus image and labeled by experts. Second, the cell extraction process is complex, and only 2-3 high-quality images are available for model training during each extraction procedure. This limited data is insufficient for practical model training. To address this, IEP-CDS employs extraction and image augmentation techniques to expand the training dataset to 700 cells per class and continuously enlarge the dataset during model training. Third, an image preprocessing method is designed to overcome the detection error in the cell-aggregated region. Finally, YOLO models are utilized to detect cell types. The IEP-CDS code can be accessed on GitHub: https://github.com/278100598/cell_yolo_detect. The details of these processes are described below.
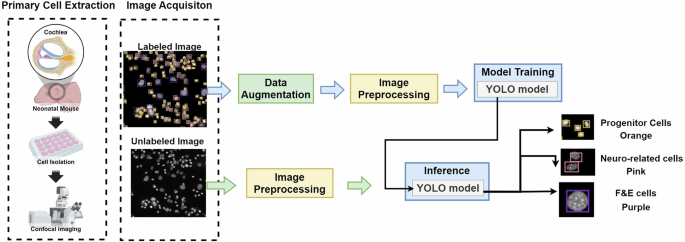
The overview of the IEP-CDS system.
Data collection
Innear Ear Primary Cell Extraction
FVB/N-Tg (GFP) transgenic mice overexpressing green fluorescent protein, aged 0-2 days after birth and commonly used in biomedical research, are used. The mice are euthanized, the skin and mandible are removed, and the skull is bisected along the midsagittal plane. After removing the brain, the temporal bones are isolated and placed in sterile 60-mm petri dishes filled with Hanks Balanced Salt Solution (HBSS) maintained at pH 7.4. Under the precise observation of a surgical microscope, the cochlear capsule is accessed and carefully extracted, digested with 0.05% trypsin-EDTA solution, passed through a 70-μm mesh filter to remove undigested tissue, purified cells, and subjected to differential adherence processing with the culture process. These cells are extracted, and cell fluorescent staining is performed 3–7 days after the cell culture process. For the cell fluorescent staining process, the cochlear samples are washed twice in Phosphate Buffered Saline (PBS) and then stained with CellMask™ Deep Red Actin Tracking Stain (Thermo Fisher Scientific, Waltham, USA) at a 1:1000 dilution ratio. Finally, each sample is counterstained with the Hoechst 33342 solution (Thermo Fisher Scientific) at a dilution ratio 1:2000. This staining process does not sacrifice cells, allowing them to be maintained in the culture process for the next generation.
Confocal Image Acquisition
For image acquisition, we use a Zeiss LSM900 confocal microscope with a GaAsP detector and three solid-state lasers at a wavelength of (405/488/633 nm) to excite the fluorescence. The images involve a 10x air objective with a numerical aperture of 0.45 with different signals in grayscale images, as shown in Fig. 3. The different signals (405/488/633 nm) highlight various parts of the cell: the nucleus, excited by a 405 nm laser and emitting in blue; the cell body, excited by a 488 nm laser and emitting in green; and the cell membrane, excited by a 633 nm laser and emitting in yellow. We use yellow instead of red because yellow is more sensitive to the human eye than deep red, making it easier for experts to identify cell types. The cell nucleus is the key to classifying most cell types, but some cells may not be easily identified using only the nucleus (blue signal). Therefore, we combine these signals into a color composite image to assist experts in achieving more precise labeling for specific cell types that could not be reliably classified using nucleus signals alone. Figure 4 shows three typical examples of labeling errors. In this study, an expert uses a software tool to annotate 1024 × 1024 images of a cell nucleus for model training. Hair cells are also a type of inner ear cell that is too fragile to survive the primary cell extraction process. Therefore, cell nucleus (blue signal) images can be categorized into three key types.
-
Progenitor cells, which have differentiation potential, are characterized by their small and bright nucleus, often found within F&E cells, labeled in orange bounding boxes.
-
Neuro-related cells, which play an important role in auditory signal transmission, have medium-sized nucleus and tend to cluster to enhance signal transmission. These are labeled with pink bounding boxes.
-
F&E cells, essential for the stability of neuro-related cells, have the largest nucleus with many bright points and serve as scaffolds for neuro-related cells. These are labeled with purple bounding boxes.
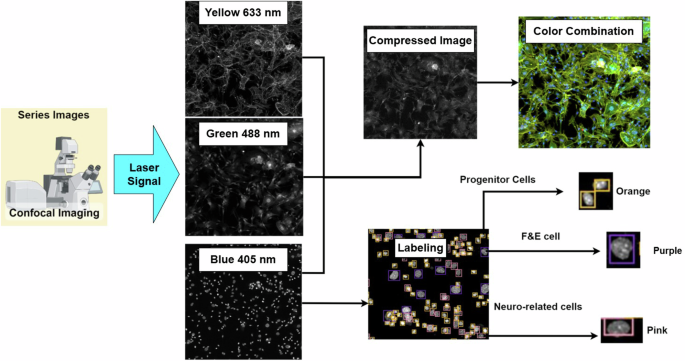
Confocal Image Acquisition Process.
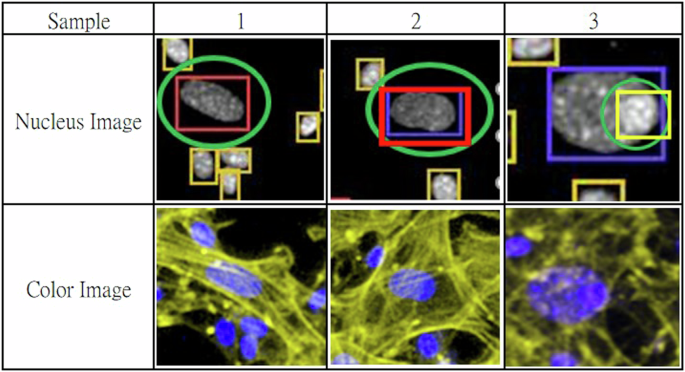
Sample 1 and sample 2, the large cell nuclei marked with green circles can be easily classified as F&E cells because of their big radius. However, they are actually neuro-related cells, as indicated by the yellow fibrous structures in the color image, representing the neuro-transmission fibers. Sample 3 is often misclassified as an F&E cell, but it is a progenitor cell located on an F&E cell, as shown in the color image.
Image Augmentation
Due to the challenge of collecting and labeling data, we use the “extraction & augmentation method (E&A)” to increase the training dataset. Figure 5 shows that the cells are extracted from images and execute transformation processes such as horizontal flips, vertical flips, and rotations. These cells are pasted on new background images to simulate various environment images and increase to 700 cells for each class. The “mosaic” and “mix-up” techniques from YOLOv416 are adopted. The “mosaic” merges four different images into a single composite image, while the “mix-up” merges pairs of images into a single image. In this study, we refer to the combination of E&A, mosaic, and mix-up methods as the “IEP augmentation method”.
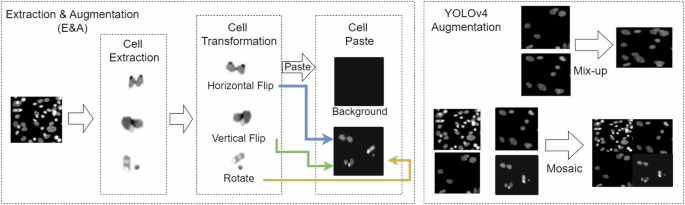
Cell Image Augmentation Method.
Image Preprocessing
To overcome the detection errors of the cell-aggregated region, Gaussian blur and normalization enhancement are utilized to create more seamless boundaries and maintain the essential features.
Gaussian blur17 effectively reduces edge discontinuities, creating more seamless boundaries between objects and the background, as shown in (1). Here, x and y represent the coordinates in the image, and the corresponding filter is generated using (1).
Normalization enhancement is utilized to avoid gaussian blur17 overly smoothing out essential features. The normalization enhancement equation18 is described in (2) where “value” is the original intensity, “minvalue” and “maxvalue” are the intensity range of the original image. “newmin” and “newmax” are the desired range of the enhanced image, usually set to 0 and 255 for an 8-bit image. this dual approach maintains essential cellular details to enhance the model’s capability for cell classification; it is a balance between feature smoothing and preservation.
Finally, canny edge detection, used to extract cell features, employs Sobel 3 × 3 kernels to approximate the derivatives of horizontal and vertical changes, as shown in (3). The kernels detect changes in brightness in the horizontal direction Gx and in the vertical direction Gy to highlight the vertical and horizontal oriented edges. After applying these kernels, the resulting gradient is combined to give the overall gradient at each pixel as in (4). The gradient result at each pixel is filtered with a high and a low threshold to reduce false positives. Pixels with gradients higher than the high threshold are marked as strong edge pixels, and pixels with gradients lower than the low threshold are suppressed. Pixels with gradients between the two thresholds are marked as weak edge pixels. The weak edge pixels connected to firm edges are identified as part of an edge, while the others are suppressed.
Detection Model Training
YOLO (You Only Look Once) is a deep learning-based object detection model that performs localization and classification in a single step. Dividing images into grids efficiently predicts bounding boxes and class probabilities. Unlike multi-stage methods, YOLO completes detection in one pass, offering real-time speed and capturing object context, making it ideal for surveillance, autonomous driving, and cell detection applications. In this study, we develop YOLOv4, YOLOv7, and YOLOv8 within IEP-CDS. YOLOv4 introduces mosaic and mix-up augmentation methods, significantly increasing mAP in public datasets. YOLOv7 and YOLOv8 also incorporate these augmentation techniques. The model architectures and hyperparameter settings of YOLO models are in Table 1.
Data Records
A bio-engineering expert labeled the data we collected. The IEP nucleus image data is stored in 8-bit grayscale 1024 × 1024 in Jpeg format (jpg), the most suitable size to distinguish and detect these cells. Since obtaining well-trained model data is rare, we provide primary cell E & A augmented data to enhance model accuracy during training. These data are saved in Figshare19: https://doi.org/10.6084/m9.figshare.27059614. The inner ear primary cell (IEP) confocal images folder includes two main folders: “original_images_and_labels” and “datasets”. The “original_images_and_labels” folder contains confocal images of inner ear primary cells with professional labeling and is suitable for augmented to train the deep learning models. The “datasets” folder is divided into two subfolders: “train_dataset”, “validation_dataset”, and “test_dataset”. The “train_dataset” is augmented from the original dataset, which includes two folders: “1_IEP Aug” including IEP augmented data and “2_Aug + Preprocessing” including IEP augmented data with preprocessing. The “test_dataset” and “validation_dataset” contain: “1_Origina” with the original test dataset and “2_Preprocessing” with the preprocessed test dataset.
Data Separation
The separation of training and testing data is shown in Table 2. We deploy the above-mentioned E & A process to create 700 cells of each cell type for the model training dataset. The data distribution of the test set differs from the training and validation datasets due to different collection batches.
Technical Validation
We compare our results with current commercial cell counting software, known for its efficacy in cell detection. We set the best radius hyperparameter setting performance for F&E cells, neuro-related cells, and progenitor cells separately and combine these results to compare with our proposed method. We use mAP (mean average precision) and the F1-score to measure accuracy and effectiveness.
Evaluation metrics
The evaluation metrics are precision, recall, mAP, and F1-score, as detailed in (5) to (9), respectively. The predicted bounding box and the ground truth box with IoU larger than 0.5 are judged to be correctly identified. The model detection evaluation metrics are defined as follows: False positive (FP) denotes the number of additional cells that do not match the ground truth. False negative (FN) denotes the number of cells that have not been detected. True positive (TP) denotes the number of right-detecting cells. N is the number of cell types, p(r) refers to the precision-recall curve, and AP refers to the area under the precision-recall curve as in (7). The F1-score is the harmonic average of precision and recall. Since current commercial cell counting software lacks a confidence score to generate the precision-recall curve, we compare IEP-CDS with current commercial cell counting software using the F1-score in this study.
IEP-CDS result
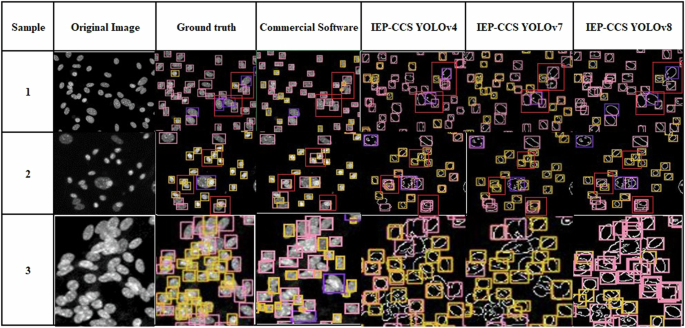
We compare the YOLO models of the IEP-CDS with current commercial cell counting software (commercial software) in the validation and test set, as shown in Table 3 and Fig. 6. “Pink” represents neuro-related cells. “Purple” represents F&E cells, and “Orange” represents progenitor cells. “The average” is the macro-average of the F1 score.
IEP-CDS compare with SOTA.
As shown in Fig. 6, samples 1 and 2 represent the cell-aggregate regions, and YOLOv8 performs best. The regions marked with red bounding boxes indicate areas where commercial software incorrectly merges two cells into one or cuts one cell into multiple cells, leading to incorrect detection results. In contrast, our method, IEP-CDS combined with YOLO models, can correctly detect these cells, with classification results that are more accurate than those produced by commercial software. This demonstrates that IEP-CDS effectively addresses detection errors in cell aggregation regions in commercial software, improving cell detection accuracy. Sample 3 is the densest cell-aggregate region among all these samples. Although YOLOv4 and YOLOv7 fail to detect a significant number of cells, YOLOv8 manages to detect the cells, but misclassified them. As shown in Table 3, the detection results of all YOLO models outperform the commercial software. IEP-CDS with YOLOv4 achieves the highest macro-average F1-score of 0.488 in the test set. The IEP-CDS with YOLOv7 tends to misclassify cell types, resulting in a macro-average F1-score of 0.724 in the validation set but 0.458 in the test set. The commercial software tends to count multiple cells as a single cell and misclassify them in all the samples, resulting in the lowest macro-average F1-score of 0.438 in the validation set and 0.371 in the test set. These results demonstrate that although IEP-CDS with YOLOv4 and YOLOv7 shows improvement, IEP-CDS with YOLOv8 provides the most stable and significant improvement in the cell-aggregate region. These methods outperform commercial software and take less than 1 second for each confocal image.
Ablation Study of Image Augmentation
We validate the effect of the image augmentation process in Table 4. The results show that the IEP augmentation method, which is the combination of the E&A with the mosiac and mix-up methods, yields the best mAP performance for YOLOv4, YOLOv7, and YOLOv8 ranging from 0.62 to 0.73 compared to the use of each augmentation method separately, ranging from 0.3 to 0.72. Even E&A method with YOLOv7 shows 0.017 more minor than the IEP augmentation method, it is not a significant difference. Therefore, this study adopts the combination of the E&A, mosiac, and mix-up methods as the IEP augmentation method.
Ablation Study of Image Preprocessing
We design image preprocessing such as Gaussian blur and normalization enhancement to improve detection in regions aggregated with cells. We evaluate the effect of different combinations of image preprocessing methods as shown in Table 5. “Aug” represents models trained with IEP augmentation data. “Aug + Gaussian” indicates the models are trained with IEP augmentation data with Gaussian enhancement. “Aug + Normalize” refers to the IEP augmentation data with the normalized method. IEP-CDS represents the IEP augmentation data with Gaussian enhancement and normalization preprocessing used for model training. All these combination methods are incorporated and compared with YOLOv4, YOLOv7, and YOLOv8. Gaussian blur improves edge detection, raising mAP to 0.69-0.74 but may reduce critical signals in the nucleus. The normalization enhancement highlights these features, increasing mAP to 0.76-0.77. Thus, IEP-CDS that combines IEP augmentation, Gaussian blur, and normalization enhancement shows an improvement in 5–10% YOLO models in this study. IEP-CDS increased the mAP for the YOLO models from 0.02-0.40 to 0.44-0.5 in the test set, showing a 10–50% improvement in the YOLO models, similar to the validation set results. The results of the test set show a lower mAP than the validation set. This is because the primary cells in the test set come from a different batch of mice, resulting in a varied morphology of the cell nucleus and a decrease in mAP. However, the IEP-CDS preprocessing methods have mitigated the impact of these variations on accuracy.
A comparative analysis of the most significant cell-aggregated region is shown in Fig. 7. The training result with only the augmentation method shows many undetected cells. The augmented dataset with Gaussian blur improves false positive detection but results in many undetected cells. The augmented dataset with the normalization enhancement method detects more cells but misclassifies some. The IEP-CDS effectively detects and classifies cells by integrating Gaussian blur and normalization enhancement. These observations suggest that while Gaussian blur helps to outline the cell edges, it may also ignore some essential DNA signals, which appear as bright points in the nucleus. The combined approach, including augmentation, Gaussian blur, and normalization enhancement, appears to keep these vital DNA signals that increase the overall accuracy of cell detection and classification results. Therefore, the combined approach “Aug + Gaussian Blur + Normalization” is adopted in IEP-CDS.
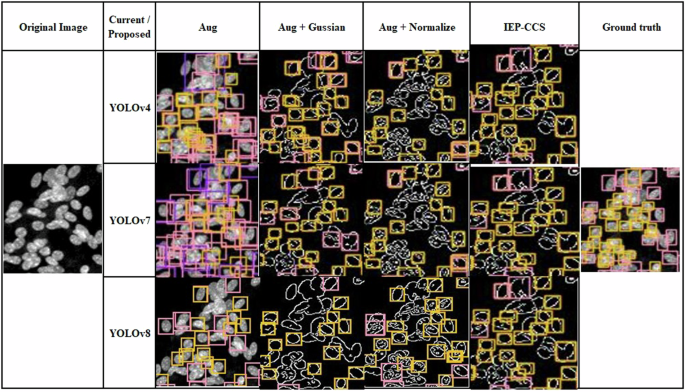
The cell-aggregated region of the test set.
Training and Inference Time
We compare these models’ training and inference time, as shown in Table 6. We utilize the RTX 3090 to train on three models for 6000 epochs. The training times are 161 minutes for YOLOv4, 130 minutes for YOLOv7, and 89 minutes for YOLOv8. All these YOLO models achieve an acceptable accuracy in this study. Regarding inference speed, YOLOv4 processes images in 9.4 milliseconds, YOLOv7 in 77.5 milliseconds, and YOLOv8 in 2.6 milliseconds per image. The inference time of three YOLO models is less than one second, which is very suitable for bioengineering applications.
Usage Notes
Cell therapy involves transplanting specific cell types into an individual to treat or prevent disease. Precise detection and classification of cell types can facilitate the monitoring of cell transformations, thereby improving the efficiency of inner ear organoid construction. In this study, we proposed an IEP-CDS framework for efficient detection and calculation of the distribution of primary cells of the inner ear. The IEP-CDS consisted of an image augmentation module, an image preprocessing module, and three detection models. Despite the limited data, IEP-CDS demonstrated strong cell detection and counting performance, achieving a mean average precision (mAP) greater than 0.5 for each model. This performance surpasses commercial software, which has an mAP of 0.35. IEP-CDS demonstrated high accuracy and versatility, making it a valuable tool for labeling 3D confocal data from primary inner ear cells.
The released data includes training, validation, and test sets. The training set consists of two images labeled by experts and 15 augmented images, each containing 700 cells of various types, verified as suitable for model training. The validation and test sets contain four confocal images labeled by experts to assess the model’s performance. Users can use these data to train a robust IEP cell detection model. In summary, this research offered not only expertly labeled data and a preprocessing approach to address detection errors in cell aggregate areas but also represents a significant advance in the field of cell therapy for inner ear organoids.
Responses