Improving lithium-sulfur battery performance using a polysaccharide binder derived from red algae
Introduction
Lithium-sulfur (Li–S) batteries are promising candidates to replace the current generation Li-ion batteries, as they offer better storage capabilities, longer cycle life and the potential for higher energy density. However, despite their immense potential, Li–S batteries are not yet on the market due to persistent challenges. The main issue is the formation of the soluble polysulfide intermediates (Li2Sx, where 4 ≤ x ≤ 8) that can migrate between the sulfur cathode and Li metal anode1,2,3,4. This so-called shuttle effect leads to the loss of active sulfur, the corrosion of the Li metal, the rapid capacity drop, and low Coulombic efficiency5. Additional limiting factors are the low sulfur recovery due to the low electrical conductivity of sulfur and the significant volume expansion of the electrode during the operation6.
Efforts to improve the performance of Li–S battery have primarily focused on cathode improvements, particularly in the realm of carbon matrix design7. Other components (electrolyte, negative electrode, working mechanism, binder materials) have received much less attention8,9. Embedding sulfur within a carbon matrix has proven to be an effective strategy for mitigating the shuttle effect. The development direction turned to various hierarchical sulfur composites, which opened up a new field based on the concept of sulfur confinement in a porous structure10,11,12,13,14,15. For this reason, a myriad of carbon-based architectures like hollow carbon spheres16,17, double-shell carbon spheres18,19, nanofibers20,21,22, 3D branched hollow nanolayers23, hollow carbon nanotubes and nanofibers24,25,26,27, tube-in-tube structures28, double-shelled carbon spheres29 have been developed and investigated. In the recent years, the incorporation of graphene30,31,32,33,34 and graphene oxide35,36 into positive electrodes resulted in remarkable improvements such as extended cycling lifetimes and sustained capacities even after hundreds of cycles. The disadvantage of such designs is that in most cases the manufacturing process is too complex, often very expensive precursors are used, along with high temperatures and pressures that make industrial level scale-up impossible.
Considering these challenges, it is increasingly recognized that binder materials play a critical role in the performance of Li–S battery. Binders not only facilitate electrode assembly but are also actively involved in the electrochemical reactions37,38. Traditional binders like polyvinylidene fluoride (PVDF) suffer from limitations such as poor binding ability, low conductivity, and the need for toxic solvents such as N-methyl pyrrolidone (NMP)39,40,41. In contrast, the recently explored and applied binders such as carboxymethylcellulose (CMC) or polysaccharides (biopolymers) like alginates42,43,44, chitosan45,46 carrageenan (CARR)47,48, gelatin (GEL)49, gum arabic (GA)50, guar gum (GG)51, tragacanth gum (TG)52 are eco-friendly materials, do not require any toxic solvent and can be applied in the frame of a water-based synthesis route53. These biomass-based binders also meet the criteria of sustainability, cost-effectiveness, abundance, and easy availability54. They also have several physical and chemical properties that are beneficial in controlling Li-S battery chemistry. In addition to providing good physical and chemical adsorption, they have numerous functionalities that significantly influence the properties of the sulfur electrode and the mechanism of the reactions that take place in the battery. The majority of naturally occurring binders belong to the family of polysaccharides rich in –OH−, ({-{{rm{SO}}}}_{4}^{2-}) and –COOH groups55. They are therefore water soluble and the large number of –OH− groups provide interaction with the surrounding polar environments and can easily strengthen the binding interactions with the polysulfides55. A promising material of this group is carrageenan from red seaweed (Chondrus crispus), which is a sulfated polygalactan containing 15 to 40 % ester-sulfate56.
However, the role of carrageenan in the processes taking place in the electrolyte and in the cathode is not well understood. In one of the studies using Raman spectroscopy57 no evidence was found that carrageenan is involved in nucleophilic substitution between the sulfate-ester group and the polysulfides. In contrast, based on UV-VIS spectrophotometry and operando X-ray absorption spectroscopy (XAS) studies Ling et al.58 found that the nucleophilic substitution reaction between the polysulfide and carrageenan polymer effectively immobilizes the polysulfides within the cathode. However, in this study the authors measured operando XAS only from the sulfur-cathode side of the separator where the penetration depth of the tender X-rays is in the range of 2-20 μm. The further problem is that the operando S K-edge XAS spectra were always measured in fluorescence mode and were thus strongly influenced by self-absorption (SA)58,59,60,61,62. Dominko et al. pointed out that the SA correction of the spectra is a significant source of systematic error even at low sulfur-concentrations59.
Despite the promising potential of biomaterial binders such as carrageenan, there are still gaps in our understanding of their role in battery processes. Comprehensive analyses comparing different biomass-derived binders with each other and with PVDF are lacking, hindering progress in binder optimization. Furthermore, inconsistencies in experimental conditions and testing methodologies hinder a holistic understanding of the impact of binders on battery performance.
This study therefore attempts to investigate the effect of carrageenan by systematically exploring the binder ratios and its effects on battery performance. We made sure that each electrode is produced and tested under the same conditions and that only the ratio of the binder and the type of binder changes. We also focused on using a simple production method (only grinding and mixing) and thus not using any production steps for the cathode that could complicate scalability. By keeping the production of the cathode as simple as possible, we did not use complicated carbon architecture, which again would make it impossible to clarify the role of the binder. Hopefully, with this approach we can provide more information and provide a basis for designing electrodes using the trends observed here for other binders.
To accurately quantify the polysulfides, we also performed XAS measurements in transmission, so that we can see the total volume of the separator (and electrolyte). To our knowledge, no XAS measurements in transmission mode have been performed on operating Li-S batteries to date.
Results and discussion
SEM and EDS
The SEM images show in general that the lower the carrageenan ratio is the more fractured the structure becomes. The binder also influences the structure of the electrode: in the case of the same concentration of carrageenan and PVDF (10 wt.%) the PVDF – containing electrode is more cracked. The elemental maps pointed out that the 10 wt.% PVDF containing electrode has as much uneven sulfur distribution as the 5 wt.% carrageenan containing sample. The most porous sample is the 7 wt.% carrageenan – containing cathode which has a sponge-like structure. Regarding sulfur distribution both the 7 wt.% and the 10 wt.% carrageenan – containing electrodes are well-balanced, while the higher amount of sulfur loading and the increase of the amount of the carrageenan causes the dominant presence of the sulfur in the electrode. The elemental maps showed Na – and K – accumulation near to the sulfur deposits indicating that the carrageenan covers the sulfur particles or makes a real chemical contact with them (Fig. S2).
FIB cross-sections have been made on the as-prepared CARR10 electrode and after 250 discharge-charge cycles (SI, Fig. S3). The FIB analysis revealed that the electrode has a porous structure, and these pores became larger after the cyclization showing the volume expansion of the electrode. The formation of a more porous structure can provide better percolation for the electrons and ions. It can also be seen that although the pores are dilated, the electrode material is not detached but remains on the Al substrate, so the flexible structure of the carrageenan can adapt to volume changes and its stronger bonding strength can maintain the mechanical integrity of the electrode. On the contrary, the PVDF10 sample contained no pores in the 1-50 micrometer range, neither before nor after cyclization (Fig. S4). However, cracks were already observed on the fresh electrode. The post-mortem images, the elemental map and FIB incisions show that after cyclization, electrode material can easily start to detach from the substrate along these cracks. It can be observed on the element map that there is a huge area of electrode detachment, where only pure Al can be observed. The photos taken with a digital camera confirm this. The rigid structure of PVDF cannot adapt to volume changes and the electrode material peels off due to the induced mechanical stress (Fig. S5). This is a very important explanation for why the PVDF10 sample performed poorly in long-term testing (e.g. shorted after a few hundred cycles).
X-ray photoelectron spectroscopy investigations
In Fig. 1A, C 1s spectra of the CARR10 and PVDF10 samples in the initial state are shown. In Table S1, the surface composition of the CARR10 and the PVDF10 cathodes is shown, along with reference data on a Carbon Black sample63. Further data (composition in at. %, identification of the observed chemical states) can be found in Tables S2–S5. Fig. S6 shows the survey spectra of (A) CARR10 and (B) PVDF10 samples before and after cycling. The spectra of the CARR10 contain the expected elements C, O, S and—as charge compensating cations in carrageenan—Na and K.
Carrageenan seems to contain no or only a low amount of carbon exclusively bound to H or C (these carbon atoms have a C 1 s binding energy around 285 eV). The lowest binding energy peak at ~284.4 eV is consistent with its predominantly graphitic origin. The low binding energy part of the C 1 s spectrum can be modeled by a line shape derived from that of graphitic carbon (curve (a) in Fig. 1A), it accounts for some 60 % of the total C 1 s intensity and the remaining 40 % can be assigned to carrageenan. The peak at 287.3 eV belongs to the ether and alcohol-like C-O connections in the saccharide while the small peak at 289 eV arises from C atoms in O-C-O connections and in C-OSO3 groups, however, their binding energy is higher than that expected from the literature64. In an alternative approach, the graphitic peak is modeled by a symmetric line at 284.4 eV (curve (b) in Fig. 1A); then the peak at 285.4 eV accounts for aliphatic C-C/C-H species, carbon singly bound to O is described by the large peak at 287.2 eV while the peak at 288.5 eV can be assigned to more highly oxidized carbon atoms. In this case, the estimated carrageenan-related C intensity is ~50% of the total carbon signal. The C 1 s spectrum of the carrageenan-containing sample before and after cycling is compared on Fig. 2D (a) and (b). The O content can be almost exclusively attributed to the carrageenan. The relatively symmetric line shape can be deconvoluted into contributions from oxygen atoms in single C-O bonds (532.9 eV, C-OH or C-O-C groups) as well as from oxygens in O-C-O-like environments64 and in sulfate groups (533.9 eV). Assuming that all oxygen arises from carrageenan, the 32% oxygen content corresponds to 26% carrageenan-related C content (C:O ratio=12:15), in tentative agreement with the value estimated from the analysis of the C 1 s spectra (40-50% of the 59% total C content). The C 1 s peak of the Carbon Black reference (displayed in Fig. 2A curve c) with blue line exhibited the slightly asymmetric line shape of graphitic carbon materials with a distinct energy loss feature due to excitation of the π-electron system; the binding energy of the main peak was 284.4 eV65.
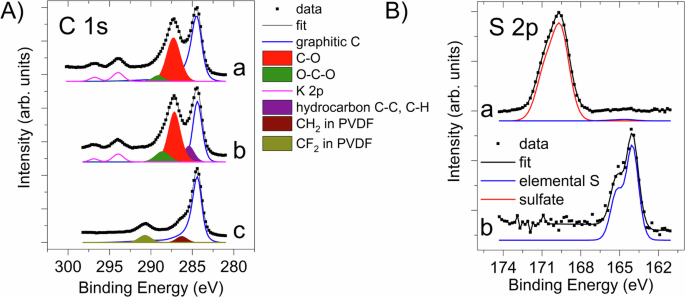
A C 1 s (and K 2p) XPS spectra of (a, b): CARR10, fitted with different models for the graphitic contribution and (c): PVDF10. Colors represent different carbon species as described in the text. B S 2p spectra of (a): CARR10 and (b): PVDF10. The S 2p spectra were modeled by the S 2p3/2-S 2p1/2 spin-orbit doublet with 2:1 intensity ratio, 1.2 eV doublet separation and identical width. Colors represent different species as described in the text.

A PVDF10 in initial state (a) and after 250 cycles (b) and spectrum of the carbon black sample (c), (B): S 2p spectra of the PVDF10 (a) before and (b) after cycling, (C) F 1 s spectra of the PVDF10 (a) before and (b) after cycling; (D) C 1 s spectra of the CARR10 (a) and after 250 cycles (b) and spectrum of the carbon black sample (c), (E): S 2p spectra of the CARR10 (a) before and (b) after cycling, (F) F 1 s spectra of the CARR10 (a) before and (b) after cycling; (G) N 1 s spectra of the CARR10 (a) before and (b) after cycling.
S 2p spectrum of the initial carrageenan-containing sample is compared with that of the PVDF-containing sample in Fig. 1B, while Fig. 2E shows the S spectra of the initial (a) and used states of the carrageenan-containing cathode (b). In the initial state (Fig. 1B, curve (a), or Fig. 2E, curve(a)) sulfur is essentially in a single chemical state, which is characterized by a S 2p3/2 binding energy of 169.6 eV. This high binding value indicates the almost exclusive presence of sulfate groups65. The formula of ι-carrageenan suggests a S:O ratio around 0.13:1 (2:15). The S:O ratio deduced from the XPS data is 0.14:1, in almost perfect agreement with the nominal value. Accordingly, the sulfur content of the surface is predominantly due to the binder material. Only a weak, almost negligible S 2p contribution somewhat above 164 eV may arise from elemental sulfur in the initial sample. In addition, the sample contains a small amount of Na and K, both in ionic forms. The K 2p spectrum appears at the high binding energy region of the C 1 s spectrum and is shown in Fig. 1 (a, b) and 2D (a). The preferential deposition of carrageenan on the sulfur particles was also indicated by EDS analysis: Na and K accumulation was observed in the vicinity of the sulfur patches. Since carrageenan naturally contains these two elements, the EDS results confirmed that the sulfur deposits are preferred binding sites for the saccharide.
As is demonstrated by the survey spectrum (Fig. S6A), significant composition changes were observed on the surface of the used electrode. In particular, appearance of F, N or Li signals evidenced the accumulation of electrolyte-related species on the electrode. As a result of a drastic line shape change of the C 1 s peak, alignment of the energy scale with the graphitic contribution was no longer possible; instead, the binding energy of the clearly observable K 2p1/2 peak was set to 296.7 eV, the same value as in case of the initial sample.
The C 1 s spectrum, which in the initial state was a combination of graphitic carbon and carrageenan-related signals, transformed into a complicated multi-peaked envelope evidencing the appearance of new carbon chemical states. It is depicted in Fig. 2D, spectrum (b). Instead of the well-defined peaks of graphitic carbon and oxidized carbon from carrageenan, a broad feature was observed in the low binding energy part of the spectrum, which was decomposed into a weak graphitic (284.4 eV binding energy) and a stronger hydrocarbon-like (285.3 eV) contribution, along with a broad peak at 287.0 eV and a small peak at 288.7 eV; the latter two can be assigned to oxidized carbonaceous species of carrageenan. An equally good fit of this spectral region can be achieved without graphitic contribution, that’s why a range is given for the amount of graphitic carbon in the Table S3. If the 287.0 eV and 288.7 eV peaks are entirely attributed to carrageenan, then the binder is responsible for 20% of the total carbon intensity. A new, strong peak of the C 1 s spectrum of the used sample arose at 290.3 eV; it can certainly be assigned to carbonate species, such as Li2CO3 or Li-alkyl-carbonates66. The peak around 293-294 eV binding energy contains mixed contributions from potassium and fluorinated carbon. The highest binding energy peak at 296.7 eV was identified as K 2p1/2; assuming 1:2 intensity ratio and 2.8 eV doublet separation for K 2p, the K 2p3/2 contribution to the 293-294 eV peak was estimated and the remainder was modeled by a peak at 293.2 eV. The binding energy of the latter coincided with data available for C in TFSI (bis(trifluoromethane)sulfonimide)67 or for the CF3 group in decomposition products of TFSI66.
Accumulation of TFSI-related molecules at the electrode surface was confirmed by the appearance of a strong F 1 s peak (Fig. 2F, curve (b)), note that in the initial state no F was detected in this sample (Fig. 2F, curve (a)). It can be fitted with a strong and weak contribution. The strong one at 689.2 eV binding energy is due to fluorine in CF3 groups65,66,67; the surface concentration of these groups calculated from the F 1 s intensity is close to that estimated from the corresponding C peak (4% and 3%, respectively). The minor F 1 s contribution at 685.3 eV can be attributed to LiF formed as a decomposition product of TFSI66,68.
Another component related to TFSI was N. The N 1 s region of the initial and used sample is shown in Fig. 2G; in the initial state the sample contained no nitrogen. While N in TFSI is in a single chemical state characterized by an N 1 s binding energy close to 400.0 eV66,67, a small high (at 403.4 eV) and low (at 397.6 eV) binding energy contribution was also detected on the surface of the used electrode (Fig. 2G, curve (b)). As far as the low binding energy peak is concerned, literature tends to assign N species in this binding energy range to nitrides65, although Li3N seems to have an even lower binding energy. On this basis, a similar low binding energy peak observed during decomposition of TFSI upon Li exposure was attributed to LiCN66. The assignment of the high binding energy N peak is even less clear, it may indicate the presence of an oxidized N species65 or quaternary N compounds69. In any case, the appearance of these peaks evidences that TFSI at the surface of the electrode is at least partly decomposed during the cycling. Quantitative data showed that the F:N ratio (15.2:2.8 = 5.4:1) is not far from the value expected for TFSI (6:1).
Analysis of the sulfur spectra revealed that similarly to the initial sample, the S 2p spectrum of the CARR10 after cycling (Fig. 2E, curve (b)) is dominated by the peaks from highly oxidized sulfur. The 169.8 eV binding energy of the S 2p3/2 component of the most intense contribution coincides with that of the initial sample and can be assigned to sulfate groups. At the same time, the SO2 groups of the TFSI also appear at this binding energy67. A quantitative estimation indicates that the roughly 3% carrageenan-related carbon content of the surface (20% of the 12.6% total C content) should correspond to 0.5% carrageenan-related sulfur (S:C ratio = 2:12 in ι-carrageenan), which is almost negligible in comparison with the 5% total sulfate content (75% of the 6.8% total sulfur content). On the other hand, the remaining S content (4–5%) is slightly higher than the value expected from the formula of TFSI (its S content is the same as its C content, which is around 3% at the surface, see above). Apart from the sulfate content discussed so far, a relatively strong sulfur contribution was found at 167.4 eV binding energy. A peak around this binding energy was also observed among the decomposition products of TFSI66. According to the literature, this binding energy can correspond to sulfite species (-SO3)65, although, based on computations and experiments, it was assigned to Li-bound SO2-containing decomposition products of TFSI66 or to the central S atom of thiosulfate70. The latter interpretation is less probable here as the low binding energy S 2p peak corresponding to the peripheral S atom was not detected in this sample. In addition to the oxidized sulfur species, two small low binding energy S 2p peaks were observed at the beginning of the measurement of the sample (Fig. 2E, curve (b)), which became almost completely invisible at the end of the cca. 30 min experiment. Both of them had lower binding energies than that of elemental S (around 164 eV, see Fig. 1B or the discussion below) which indicated that they were sulfide species65. Indeed, the lower binding energy contribution (S 2p3/2 peak at 160.1 eV) was most probably due to Li2S and the higher binding energy one (around 162.0 eV) indicated a polysulfide species70,71. Interestingly, simultaneously with the disappearance of these signals by the end of the measurement, the intensity of the 167.4 eV peak significantly increased; it may mean that the sulfide species spontaneously transformed into an oxidized product, perhaps due to the heating effect of the (non-monochromatic) X-ray source. It may be noted that on the surface of air-exposed Li2S a quite significant amount of sulfite as oxidation product was reported, in addition to a small amount of polysulfides72, therefore such oxidation of Li-sulfides seems to be entirely reasonable.
The Li 1 s spectrum gave little information for better understanding of the surface chemistry of the sample. Only a single, relatively narrow peak was observed at 55.6 eV binding energy, which did not change during the measurement (spectrum is not shown). In fact, binding energies around 55-57 eV are reported for a range of Li-containing compounds, involving carbonates, hydroxides, fluorides and more complicated compounds68,73,74. This insensitivity of the Li 1 s binding energy for the chemical environment is reflected also by the findings of ref. 66, where no change of the Li 1 s binding energy was observed upon reaction of Li with TFSI, in spite of the formation of a range of decomposition products evidenced by changes of the spectra of the other components.
Finally, although the O 1 s spectrum of the used electrode consisted of a broad and relatively structureless envelope, its deconvolution into two strong and a weak component is in qualitative agreement with the above results. A major peak around 532 eV binding energy can be assigned to a range of Li-related species: mainly carbonates, hydroxides68,74 or certain complicated decomposition products of TFSI66, although in the latter work a higher O 1 s binding energy around 533 eV was associated with Li2CO3. A smaller component around 533 eV corresponded more or less to the position of the O 1 s peak of the initial sample, which was attributed to carrageenan, so it can contain contributions from C-O, C-O-C, O-C-O-like environments. Nevertheless, because of the relatively low amount of carrageenan on the used surface, other sources such as sulfate groups, TFSI or its decomposition products with the NSO2 fragment66 should also contribute to this peak. The weak high binding energy tail of the spectrum may be due to adsorbed moisture65.
In addition, the sample contains a small amount of Na and K, both in ionic forms. The amount of Na decreased, more or less in parallel with the decrease of the carrageenan-related carbon contribution, but a clear enrichment in K was evident.
The C 1 s spectrum of the PVDF10 (shown in Fig. 1A as curve (c)) was much more carbon black-like than that of the CARR10. In fact, in addition to the graphite-type main contribution (accounting for 85% of the total C intensity), it contained two small but almost equal peaks. Although there is some scatter in the literature data75,76, the one at 290.7 eV binding energy (8% of the total C signal) can certainly be assigned to fluorinated carbon species (CF2 groups), while the peak at 286.3 eV (7%) arose from both CH2 groups of PVDF and from C atoms bound to O.
The chemical state of sulfur was very different at the surface of the two cathodes. According to the S 2p spectra shown in Fig. 1B, in CARR10 most of the sulfur was in a highly oxidized chemical state, which was characterized by an S 2p3/2 binding energy of 169.6 eV, indicating the almost exclusive presence of sulfate groups65. Similarly to the results of the quantitative analysis, this observation suggests that the sulfur content of the surface of CARR10 predominantly belonged to the binder material; only a weak, almost negligible S 2p contribution somewhat above 164 eV may arise from elemental sulfur. On the contrary, the peak position and line shape of sulfur in the PVDF10 cathode (Fig. 1B, curve (b)) corresponded well to that of elemental S. The surprisingly small sulfur content of the sample suggested the covering of the sulfur particles by PVDF. The assignment of the O 1 s and F 1 s contributions was entirely consistent with the described features (Tables S1 and S2).
According to the above discussion, in the initial state the outer surface of both cathodes is dominated by the SuperP carbon black and the binder. In CARR10 roughly half of the carbon signal arose from the carbon black, thus a tentative estimation indicated 25 wt.% Super P and 75 wt.% carrageenan at the surface, in contrast with the nominal 75:25 weight ratio. In PVDF10 a similar estimation suggested 65 wt.% SuperP and 35 wt.% PVDF content, much closer to the nominal composition. Therefore, XPS analysis revealed that carrageenan not only covers the sulfur particles, but it tends to spread on the surface of the cathode, partially covering also the carbon particles, while PVDF appears to be much more localized on the sulfur patches.
In Figure S6B survey spectra of the PVDF containing sample are shown in the initial and used state. While in the initial state the surface appears to be highly fluorinated with low oxygen contact, a much more oxidized surface evidence significant changes in the used state.
The C 1 s spectrum of this sample in the initial state shown in Fig. 1A, curve (c) is rather carbon black-like. In fact, in addition to the graphite-type main contribution (accounting for 85% of the total C intensity), it contains two small but almost equal peaks. Although there is some scatter in the literature data75,76,77 the one at 290.7 eV binding energy (8% of the total C signal) can certainly be assigned to fluorinated carbon species (CF2 groups), while the one at 286.3 eV (7%) arises from both CH2 groups of PVDF and from C atoms bound to O. Since the oxygen content of the sample is small, for surface composition estimations it is assumed that the latter contribution is entirely due to PVDF. With this assumption the atomic ratio of PVDF-related C and F (15% of the 83.3% total C content vs. 15.3%) is around 0.83, suggesting some F excess, but is still in tolerable agreement with the formula of PVDF.
The F 1 s peak in the initial sample (Fig. 2C, curve (a)) is located at 687.9 eV binding energy; this line position is consistent with that of the CF2 groups in PVDF75,76,77. A slight asymmetry at the high binding energy side of the F 1 s peak suggests the appearance of a weak component at 689.8 eV; it can perhaps be attributed to –CF2-CF2– like arrangements or -CF3 groups but its origin is unclear.
The peak position and line shape of sulfur (Fig. 1B, curve (b) or Fig. 2B, curve (a)) corresponds well to that of elemental S. The very low sulfur content can be explained by two reasons: (i) if S forms large agglomerates, the apparent S content deduced from XPS data will be much lower than the nominal value and (ii) preferential covering of S by PVDF may occur.
Following a similar reasoning than in case of the carrageenan-containing system, 85% of the 76 wt% C content, i.e. 65 wt% is due to the carbon black. As S represents only 1 wt%, PVDF is responsible for 34 wt% of the material at the surface. It still means surface enrichment of the binder, although to a lesser extent than in case of the carrageenan-containing system.
On the other hand, very significant changes were observed in the PVDF10 electrode after cycling, as already suggested by the survey spectrum (Fig. S6B, curve (b)). First of all, no sulfur (or nitrogen) was found on the surface. The lack of sulfur (see Fig. 2B, curve (b)), along with the lack of nitrogen, confirmed that neither the TFSI nor the LiNO3 component of the electrolyte accumulated on the used electrode. Moreover, the lack of sulfur suggested that the surface became covered by a relatively thick overlayer, completely covering sulfur particles in the system. In contrast, lithium-containing species were detected in relatively high amounts.
Since the fluorine content was still considerable (Fig. 2C), alignment of the binding energy scale was attempted by setting the binding energy of the sharp F 1 s peak to the same value as in the initial state; this choice implies the assumption that the surface remained rich in PVDF but was confirmed by the reasonable binding energy values for all other components.
One sign of the drastic changes occurring during the charge/discharge cycling was the very different appearance of the C 1 s spectrum in the used state (Fig. 2A). Although the spectrum contained well defined peaks and modeling with four peaks gave a very satisfactory fit, fitting attempts using the carbon black line shape were unsuccessful. Instead, the observed C 1 s binding energies suggested the appearance of differently oxidized and/or fluorinated carbonaceous species. In fact, the major peak positions coincided with those found in used lithium-ion batteries with graphite negative electrode and PVDF binder73. Based on this and similar results, the observed sharp peak at 291.1 eV must contain a contribution from the PVDF; and another PVDF-related carbon peak is expected to be around 286 eV. If it is accepted that the F 1 s signal arises exclusively from PVDF then carbon atoms in the CF2 (signal around 291 eV) and CH2 (signal around 286 eV) segments should represent roughly 3–3 at% in the total surface composition, which means that roughly 40% of the 291 eV peak and 25% of the 285.9 eV peak is due to PVDF but the remainder has to be assigned to other species. In fact, C 1 s peaks around 291 eV binding energy were reported for polymers with carbonate-like features65, but organometallic or inorganic carbonates such as R-O-Li-CO2 or Li2CO3 were also reported in this range68,73. Thus, carbonate-like features must certainly have formed during the cycling of the cell or at least after the subsequent air exposure. As far as the lowest binding energy peak is concerned, in addition to PVDF, it evidences the presence of carbon singly bound to O like in C-OH or ether- or epoxy-like configurations65,69,78; molecules with such features were already present in the electrolyte. The strongest contribution to the C 1 s spectrum of the used electrode occurred at 287.5 eV binding energy. It is usually attributed to carbonyl groups65,69,78 but many compounds reported at carbon-electrolyte interfaces in Li-ion batteries can give a contribution here, like Li-alkoxides68,73. Finally, curve fitting indicated the presence of a small C 1 s peak around 289.6 eV binding energy, which indicates the presence of carboxyl or ester-like bonding environments65.
Similarly to the situation described in ref. 73, the O 1 s spectrum exhibited two relatively broad but structureless components. The lower binding energy one at 532.9 eV accounts for the majority of the contributions from oxidized carbon species like alkoxide, carboxylic, lactone or ether groups65,68,69. Carbonates may contribute to the higher binding energy peak at 534.4 eV68. Interestingly, the surface concentration of carbonates based on the contribution of this peak is around 3%, close to the value estimated from the intensity of the highest binding energy C 1 s peak (4–5%). Nevertheless, the carbonyl content of the surface cannot be too high as no discernible O 1 s signal can be found around 530-531 eV.
Deduction of the Li chemical states from the Li 1 s binding energy is not an easy task because of the large scatter of the values reported in the literature and the relatively little variation of the binding energy with the chemical environment. Nevertheless, it appears from the measured spectrum (not shown), that Li occurs in this system at least in two states. The 56.4 eV binding energy of the main Li peak suggests the presence of Li-alkoxides, carbonates or maybe oxyfluoride compounds68. The weak low binding energy signal can be attributed to a small amount of Li-oxide or hydroxide, although the O 1 s contribution characteristic for Li2O (below 530 eV68) was missing from the oxygen spectrum. No F 1 s intensity was found around 686 eV, characteristic for LiF68, so one can conclude that lithium fluoride was not present at this surface.
As the small P 2p peak was found at an unusually high binding energy (137.9 eV), fluorinated nature of the surface P species cannot be ruled out (literature suggests a similar value for PF6 or LiPF668). In such a case, this compound would be responsible for the entire fluorine content of the sample. Such a situation would not interfere with the binding energies reported here as PVDF or LiPF6 has the same F 1 s binding energy68, but would mean that there is no PVDF on the surface, instead, it is entirely composed of oxidized carbonaceous material and Li embedded into it.
Cyclic voltammetry and electrochemical impedance spectroscopy
Figure 3a shows the comparison of the PVDF10 and the CARR10 electrodes. In both cases the formation of the long-chain (({{mbox{L}}}{{mbox{i}}}_{2}{{mbox{S}}}_{8}to {{mbox{L}}} {{mbox{i}}}_{2}{{mbox{S}}}_{6}to {{mbox{L}}} {{mbox{i}}}_{2}{{mbox{S}}}_{4})) from 2.4–2.2 V (Epc1)) and the short-chain polysulfides (({{mbox{Li}}}_{2}{{mbox{S}}}_{4}to {mbox{L}}{{mbox{i}}}_{2}{{mbox{S}}}_{2}to {mbox{L}}{{mbox{i}}}_{2}{mbox{S}})) at 1.8–19 V (Epc2) were observable. However, in the case of the PVDF10 electrode the peaks are associated with lower current, and the peaks are wider, while in the case of carrageenan there are higher peak currents and smaller overpotentials. This indicates efficient sulfur utilization during the redox process and significant increase in the kinetics. As the binder itself does not necessarily contribute to the electrochemical capacity52, this phenomenon is most likely related to the synergetic effect of the binder and the active material. Based on the cyclic voltammetry results the binder content of the cell (Fig. 3b) affects mostly the formation of longer chain polysulfides (shift in position of Epc1 and Epa1). The characteristic anodic peaks of the short-chain polysulfides are very close to each other in the case of the CARR10 and CARR7 samples, which indicates the quick conversion of the short-chain polysulfides to the long-chain polysulfides. The long-chain polysulfide oxidation is shifted toward higher potentials, E = 2.56 V in case of the 15 wt.% carrageenan sample, while for the other samples this peak rises around 2.39-2.42 V. This ~0.1 V shift in both directions (on the cathodic and anodic sweep) indicates lower Li-ion diffusion coefficient in the case of CARR15 – containing sample79. The shift of the peaks also suggests that the carrageenan binder promotes the disproportionation reaction of weakly soluble short-chain polysulfides to long-chain polysulfides. This tendency was confirmed by the EIS measurements as well.

a Cyclic voltammograms of PVDF10 and CARR10 samples recorded between 1.7 and 2.8 V (vs Li/Li+) at a scan rate of 0.1 mV·s−1,, (b) cyclic voltammograms of the different carrageenan-containing samples recorded between 1.7 and 2.8 V (vs Li/Li+) at a scan rate of 0.1 mV·s–1,, (c) complex-plane impedance diagrams with the corresponding CNLS fitting of PVDF10 and CARR10 samples measured between 100kHz and 10 mHz, (d) complex-plane impedance diagrams with the corresponding CNLS fitting (solid lines) of the different carrageenan-containing samples measured between 100 kHz-10 mHz. The inlays show the magnified high-frequency regions in both cases.
Comparison of voltammograms obtained at different sweep rates confirmed that carrageenan-containing electrodes peak currents increased with the sweep rates (see Fig. S7). Though peak currents of PVDF10 electrode also increase with the sweep rate, the anodic and cathodic peaks are very asymmetric indicating the polarization of the redox peaks. The PVDF10 electrode produces the lowest anodic peak currents at all sweep rates (Fig. S7). The difference in the diffusion behavior was also confirmed by the EIS measurements. The description of the applied methodology for the measurements and the evaluation of the impedance spectra can be found in the SI material. The PVDF10 sample possesses the highest resistance (R = 280.9 Ohm), meanwhile the CARR10 has only R = 20.3 Ohm. The diffusion time constants are 3.89 s for PVDF10 and 1.7 s for CARR10 (The estimated parameters with the standard errors can be found in Tables S6 and S7). The CARR7 and CARR10b samples also had lower electrode resistance. Interestingly, both too low and too high amounts of binders (CARR5 and CARR15) led to increased electrode resistance. This shows that besides the quality of the binder, its quantity is very important, too. As we have seen, a shift in the sulfur-binder ratio also has a major effect on morphology. The formation of cracks and porosity determines the penetration time of the electrolyte into the electrode, the permeability of the electrode to the electrolyte and its diffusion behavior.
Rate capability and long – term cyclization tests
As is known from the literature, the rate capability tests are strongly influenced by the discharge cutoff voltages, the number of cycles at each rate, if increasing or decreasing cycling rates applied solely in discharge, or solely in charge or for the entire cycle, electrode thicknesses, electrolyte, and different degrees of sulfur utilization80. As has been pointed out earlier, if the rate capability test is started with the slow charge rates the whole rate-capability performance will be negatively affected – unless an electrolyte additive is used80. The electrolyte additive, like LiNO3 can decrease the polysulfide shuttle in Li-S cells by passivating the surface of the negative metallic lithium electrode80,81. In the present study 0.25 M LiNO3 was used in the electrolyte in all cases to obtain relevant information from the rate capability tests that were started at low C rates in all cases.
Based on the rate tests (Fig. 4a and Figure S8), the effect of the binder appears to be significant. The PVDF-containing electrodes showed a rapid decrease in capacity, especially at higher C rates (1 C, 2 C), due to the inelastic, non-functional nature of PVDF and lower sulfur utilization (Figure S10). For the carrageenan-containing electrodes, the 7 and 10 wt% carrageenan contents (CARR7 and CARR10) provided the best sulfur utilization. The 10 wt% carrageenan electrodes showed 30% capacity retention at 2 C compared to the 0.1 C capacity values, while the same wt% PVDF electrode showed only 8.6%. Although the XAS results confirmed (Figure S13) that the CARR15 sample also suppressed polysulfide formation and provided good stability in electrochemical tests, the low amount of conductive additive was associated with lower overall capacity values.
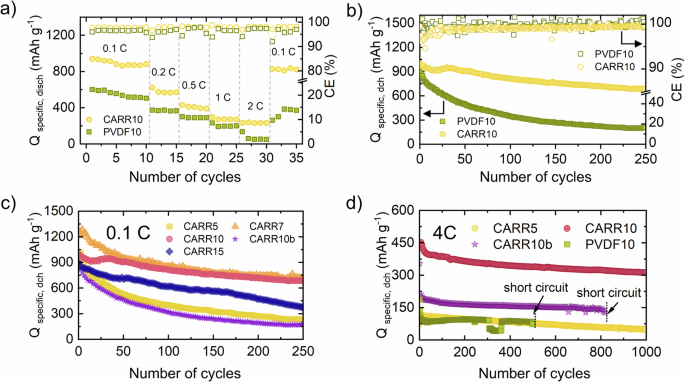
a Changes in specific discharge capacity of PVDF10 and CARR10 at different C rates, (b) specific discharge capacities of PVDF10 and CARR10 at 0.1 C rates for 250 cycles with the corresponding CE values, (c) cyclic performance of the different carrageenan-containing cells obtained at 0.1 C rate, (d) cyclic performance of the different carrageenan-containing cells obtained at 4 C rate.
Long-term cyclization tests (Fig. 4b–d) show that the best results in terms of stability and capacity retention were obtained for the sample containing 10 wt% carrageenan (CARR10), where a capacity retention of 68.9% was observed after 250 cycles at 0.1 C (Table S5). This value was 69.1% at 4 C after 1000 cycles, while the PVDF10 sample shorted out after 500 cycles and had only 39.3% capacity retention at 4 C (Table S9). The sample containing 7 wt% carrageenan (CARR7) gave the highest capacity values with an initial capacity of 1260 mAh g–1 after 250 cycles but could not provide the same capacity retention as CARR10 in long-term stability.
Regarding sulfur utilization at 0.1 C rate, Figure S10 shows that the sample containing 7 and 10 wt.% carrageenan gave the best sulfur utilization and the sample containing 10 wt.% PVDF gave the worst. In terms of initial capacity values, the sulfur recovery of the CARR10 sample was 22 % higher than that of PVDF10, but more significantly, after 250 cycles, 30 % higher sulfur utilization was observed. The increase of binder material in the 15 wt.% sample caused very good stability and capacity retention as well, but the capacity values were smaller due to the less amount of the conductive component. Similarly, the 5 wt.% carrageenan-containing sample showed very low-capacity values and poor stability as compared to the other samples with this binder material. These results are in good agreement with the rate capability results. In the 4 C rate test, the increased sulfur content (sample CARR10b) also deteriorated the stability. This indicates that there is an optimal ratio of carrageenan to sulfur, and if this is shifted in any way, the carrageenan cannot bind enough polysulfide species. It should be noted here that the highly reversible and stable capacity of the CARR10 and CARR7 electrodes are related to the lower resistance of the electrode. To confirm that assumption, the voltage polarization (ΔV) was taken to estimate the resistance (see Fig. 5A, C for the results of galvanostatic cycling with potential limitation (GCPL)). Higher polarizations were observable in the case of PVDF10 (0.23 V) and CARR5 samples (0.22 V). CARR10 sample has the lowest polarization (0.13 V). The highest polarization in the case of CARR10b and CARR7 samples can be due to the higher sulfur content of the electrodes. Figure 5A, B show the changes of the width of the plateau region in the case of the 2nd, 25th, 50th, 100th, 150th, 200th, and 250th cycles as well. The analysis of the changes of plateau width (ΔP) was evaluated at 2.2 V to determine the irreversible capacity loss in the function of the voltage. Based on this parameter the extent of the shuttle effect can be revealed52. The observed capacity losses for the discharges ranging from 50 to 200 cycles were within 35 mAh·g−1 for CARR10, comparing PVDF of 55 mAh·g−1, 34 mAh·g−1 for CARR7, 23 mAh·g−1 for CARR10b, 88 for CARR15 and 105 mAh·g−1 for CARR5. The analysis of the ΔP confirmed that an optimum has been reached at the 7 and 10 wt.% carrageenan ratios, where the ratio of carrageenan functional groups (-OH−, ({-{mbox{SO}}}_{4}^{2-}) and -COOH) to the electrode sulfur content is appropriate and the trapping of polysulfides is most efficient. If the amount of carrageenan is too low, it is not able to effectively suppress the shuttle effect because the concentration of polysulfides exceeds the limit of what the functional groups can trap. In the case of 10 wt.% carrageenan but with increased sulfur content in parallel (CARR10b), better results can be achieved in the term of the polysulfide trapping, but at the cost of lower capacity (due to less conductive additives), a poor utilization of sulfur, higher polarization, and an overall large capacity fading.

A Onset potential at different cycles extracted from (C, B) corresponding capacity observed at 2.2 V, (C) discharge-charge profiles at a current rate of 0.1 C (0.168 Ah g–1).
It also implies that, although the shuttle effect is considered the primary reason why lithium-sulfur batteries are not stable enough, it is not solely responsible for electrochemical stability or for the achievable capacity. The ability of the polymer to suppress volume changes and maintain the mechanical integrity of the electrode may also play a role. In addition, the adhesion capability of the slurry to the Al surface is not negligible.
A summary of our results along with some literature data is given in Table S9. It is indeed challenging to compare the battery performances directly due to the different preparation and cycling conditions. The samples are prepared using various methods such as mild milling, stirring for extended periods, and high-temperature processes. These methods can significantly affect the structural integrity and electrochemical properties of the materials, leading to different performance outcomes. The samples were also tested under different cycling rates (e.g., 0.1 C, 0.2 C, 4 C), which influences how quickly the batteries are charged and discharged. Higher rates typically stress the materials more, potentially leading to faster degradation and lower capacity retention. The number of cycles each sample underwent varies; some tested over as few as 50 cycles and others up to 1000 cycles. Longer cycle tests provide a better understanding of long-term stability and durability but make it hard to compare samples with fewer cycles. The type of the used electrolyte, electrolyte/sulfur ratio, and the sulfur loading can also differ. Therefore, Table S9 is just an attempt to present a comparative analysis of capacity retention metrics alongside extant literature values. The results of PVDF are consistent with those documented in the literature. It should be noted that bioderived, polysaccharide-based binders such as gum arabic (GA) and tragacanth gum (TG) exhibit comparable capacity retention enhancements to carrageenan when subjected to slow C rates. Conversely, under conditions of elevated C rates (e.g., 4 C) and prolonged cycling (1000 cycles), tragacanth gum (TG) exhibits a capacity retention of only 40%, while fenugreek gum (FG) retains 45.6% of its capacity. In contrast, the carrageenan sample (CARR10) retains 69.1% of its capacity, which significantly exceeds the retention rates of other bioderived binders by nearly 30%. It is pertinent to note that the electrodes using TG and FG were prepared using the melt diffusion technique for the preparation of the sulfur-carbon composite, coupled with high energy milling and prolonged stirring for more than 10 h (a multi-step process). In comparison, the CARR10 sample was synthesized in a single step involving 2 h of mild milling at 150 rpm.
X-ray absorption spectroscopy
In the literature, XAS measurements have been performed in fluorescence mode only58,61,62,82. The main problem of this approach is that due to the small penetration depth of X-rays, information can be obtained only from a small illuminated volume. As polysulfide concentrations strongly differ on the two sides of the separator, the above limitation means that fluorescence measurements cannot see the whole picture. To overcome this problem, both sides of the separator were measured in fluorescence mode and in transmission mode.
Figure 6 shows a full series of the measured operando XANES spectra of the 10 wt.% carrageenan containing Li-S battery in fluorescence and in transmission mode. The formation of the polysulfides during the discharge of the battery is manifest in the pre-edge regions of the XANES spectra at 2470 eV. At the beginning of the discharge and at the end of the charge pure sulfur can also be observed at 2472 eV. The large peak at 2479 eV corresponds to the sulfate containing LiTFSI compound, the Li-conducting salt in the electrolyte.

A 2D (energy vs time vs electrochemical potential) representation of the measured XAS spectra on CARR10 sample: upper panel is the fluorescence measurements from the sulfur-side; (B) shows the transmission measurements. PS means polysulfides. The vertical dashed lines serve as a guideline for the reader to follow the structural evolution of sulfur as a function of the potential/time. Panel (C) shows the result of the LCF in the case of fluorescence (left) and transmission (right) measurements. The fluorescence signal was SA corrected based on the transmission data.
The contribution of sulfur compounds (elemental S, Li-polysulfides, Li2S) to the XANES spectrum was determined by fitting each spectrum with the linear combination of standard spectra (Fig. S10). Before performing linear combination fitting all spectra had to be normalized and fluorescence spectra had to be corrected for self-absorption. Self-absorption (or over-absorption) is the distortion of the XAS spectrum, due to the variation in the depth of the penetration into the sample as the energy is scanned through the edge. The consequence of self-absorption is the incorrect XANES peak intensities as can be seen in Fig. 6A.
It is important to highlight the necessity of transmission measurements. Data measured in transmission is always free of self-absorption. Therefore, we were able to use the transmission data for them as a reference for the self-absorption correction. Depending on the angle in and out parameters in Athena, the numerical self-absorption correction can under or overestimate the peak intensities. Since we performed the fluorescence and transmission measurements at the same time, it was possible to use the self-absorption-free transmission date for finding the correct angle parameters (Fig. 7C). In that case the corrected fluorescence spectrum will have realistic peak-intensities (Fig. 7D) dashed blue line. Since these angle parameters will be identical for the given setup and sample thickness, it can be used also for the other samples which have been measured at the same conditions.

A Schematic of the fluorescence measurement setup. B Under or overestimated the peak intensities calculated with different angle parameters in Athena. C The parallelly measured self-absorption-free transmission spectrum and the fluorescence spectrum. The transmission (self-absorption-free) spectrum can be used to find the correct angle parameters for the SA correction. D With the help of the transmission data (blue solid line) it was possible to find the correct parameters for the SA correction (dashed blue line). The dotted line shows the original fluorescence spectrum, where the peak intensity was strongly influenced by SA.
Another important aspect is that fluorescence data only give information about a given volume of the sample (about 2-20 μm), whereas spectra measured in transmission give information about the whole volume. With the help of these data, we can make precise quantitative calculations with linear combination analysis.
In the case of the PVDF binder (industrial standard) the observed mechanism of reduction agreed with most of the reports in the literature, according to which soluble polysulfides are migrating towards lithium metal when there is no barrier. At the end of discharge, we observed precipitation of Li2S (Fig. 8A, C). In the case of the carrageenan binder the precipitation of Li2S was not observable, only the formation of the higher order polysulfides.

A 2D (energy vs time vs electrochemical potential) representation of the measured XAS spectra: upper panel is the fluorescence measurements from the sulfur-side on 10 wt.% PVDF sample; the white area in the contour plot and panel (C) for the 33–34 spectra indicates the interval when the X-ray beam was off due to technical reasons. PS means polysulfides. The vertical dashed lines serve as a guideline for the reader to follow the structural evolution of sulfur as a function of the potential/time. Panel (B) shows the 10 wt.% carrageenan sample. Panel (C) shows the relative amount of the sulfur compounds from the linear combination fitting of the 10 wt.% PVDF (left) and the 10 wt.% carrageenan sample (right).
Proposed mechanism based on the results
The sulfate ester groups of the carrageenan can react with the Li2Sx species in a nucleophilic substitution reaction, forming various alkyl thiolate and polythiolate species. Another possible reactive center is the glycosidic bond, which could be cleaved with sulfides in the presence of a Lewis acidic catalyst83,84, resulting in the formation of thioglycosides. In addition, DFT calculations showed that galactose, a component of carrageenan, exhibits good chemisorption to lithium polysulfides52. The adsorption energy of Li2S4 was found to be higher than –0.83 eV for galactose, which is stronger than the interaction between carbon atoms and polysulfides (–0.39 eV). In addition, the low order Li2S (-0.61 eV) adsorbs well on the saccharide units based on the literature52.
This can also explain the post-mortem XAS spectrum, where in the case of carrageenan a new peak appeared at 2477 eV after 250 cycles of charge-discharge. The spectrum shifted to higher energies probably due to the asymmetric organic groups connected to S and that the electronic structure of sulfur is close to sulfur of higher oxidation state +4 (Fig. S16). The XPS revealed that +4 oxidation state sulfur containing SO3-, Li2SO3 formation takes place. This is consistent with the chemical reaction scheme shown in Scheme 1. In Scheme 1 the RS- means any type of lithium-polysulfides, Li2S or mono sulfide species.

Physical and chemical effect of the PVDF and carrageenan binder materials on the sulfur electrode.
In addition, the carrageenan also seems to better cover the carbon surface based on the EDS and XPS results, which can prevent the whole electrode from being pulverized and buffer the volume changes during cyclization. This effect was further investigated by NMR (Fig. S14). The NMR measurements showed that the carrageenan cannot dissolve into the electrolyte, explaining how the binder material prevents the dissolution of the active components into the electrolyte.
These effects may all contribute to the observed electrochemical performance. Based on the quantitative analysis of the XAS spectra, we can assume that the carrageenan can effectively anchor the Li2S2 and Li2S species to the electrode surface, since these short chain polysulfides were not present in the total volume of the separator and electrolyte. The higher porosity induced by carrageenan can further improve the electrochemically active surface area. In contrast, PVDF lacks the chemical and physical confinement effect due to the absence of sulfate functional groups. During the operando measurements, Li2S was also observed in the electrolyte, indicating the dissolution of the active material (sulfur) into the electrolyte. A further distinction is that in the case of PVDF10, only a minor increase in electrolyte mass was observed (Fig. S15) following electrolyte immersion. The CARR5 sample exhibited a similar response. The behavior of CARR5 can be explained by the small amount of binder, which may not be sufficient to create sufficient porosity. These results also confirm that, in addition to changing the binder, finding the right ratio is also very important. In the case of 7-10-15% carrageenan, electrolyte uptake appears to be rapid following electrolyte immersion, with maximum uptake occurring almost immediately (with minimal change observed 24 h later). In contrast, PVDF10 exhibits a slower rate of electrolyte uptake, which may result in either an increase in electrode resistance (as observed in impedance measurements) or a prolonged diffusion and slower kinetics in cyclic voltammetry.
Conclusions
Among the many factors affecting the performance of Li-S cells, binding materials have received relatively little attention. It is known that PVDF, the standard binding material, has low electronic and lithium-ion conductivity and moderate binding strength. Its insufficient flexibility adversely affects the mechanical integrity of the cathode. These properties severely limit the performance of Li-S batteries. Carrageenan, a polysaccharide-type binder, is a promising substitute of PVDF. The use of carrageenan can eliminate the toxic NMP solvent from the electrode slurry preparation process and make the cathode fabrication process less harmful to the environment. Another advantage of carrageenan binder is its easy availability and low cost. The effect of carrageenan on the performance of CR2032 type Li-S cells was investigated by a wide range of experimental techniques. Galvanostatic charge-discharge measurements revealed that in terms of specific discharge capacity, sulfur utilization and long term cyclability cells assembled with 10 wt% carrageenan clearly outperforms those prepared with the same amount of PVDF. SEM images show that the electrode becomes less fractured with increasing carrageenan content. The comparison of the elemental maps of cathodes prepared with 10 wt.% PVDF and 10 wt% carrageenan revealed that sulfur is more evenly distributed in the presence of carrageenan. Na and K were found in high concentrations near the sulfur deposits demonstrating that the carrageenan binder coats the sulfur particles.
Coin cells were investigated with S K-edge X-ray absorption spectroscopy. Data were collected in transmission and fluorescence modes – the latter from both sides of the separator. The amount of polysulfide compounds in the electrolyte during battery operation was accurately quantified by LCF. In line with the literature, Li2S was observed in the electrolyte at the end of the discharge in the case of PVDF binder. This confirmed that due to the poor binding ability of the PVDF and the inactivity in trapping polysulfides, the Li2S end product can easily be dissolved from the top of the electrode to the electrolyte and consume the active material (sulfur) in every cycle. In contrast, in the case of the carrageenan-containing electrode, the observed species in the electrolyte were middle-chain polysulfides (Li2S6, Li2S4) during the discharge and charge. This scheme is in line with the cyclic voltammetry results where the peak shifts suggested that carrageenan may facilitate the conversion of the short chain polysulfides to long-chain polysulfides. It has thus been elucidated how the binder can affect the conversion of polysulfide compounds: carrageenan forms a real chemical bond with the harmful by-products, while PVDF cannot react with these compounds thus does not protect the cathode from the active material loss. Another factor contributing to the increased electrochemical performance was that carrageenan resulted in electrodes with higher porosity, which also had a positive effect on the rate capability.
Methods
Materials
The commercially available sulfur powder (precipitated powder, reagent grade) was procured from Reanal. The SuperP, polyvinylidene difluoride (PVDF), iota – carrageenan, Whatman® GF/A glass microfiber filter (separator), bis(trifluoromethane)sulfonimide lithium salt (LiTFSi, 99.95 %), 1,3-dioxolane (DOL, 99 %), 1,2-dimethoxyethane (DME, anhydrous, 99.5 %), lithium ribbon (thickness 0.75 mm, 99.9%), Li2S powder, BN powder and aluminum foil were purchased from Sigma-Aldrich.
Electrode preparation
Sulfur, carbon, and the corresponding binder were measured in the appropriate proportions. In the first phase, a 30 min dry milling of the sulfur and carbon powder (SuperP) was introduced, then the solvent and the binder material were added to the system and a further 45 min milling was applied. The prepared slurry was spread through a 120 μm slit to an aluminum foil of 16 μm thickness with an automatic film applicator (BYK-Gardner 2105). The aluminum current collector with the coating was room dried and later transferred into a vacuum oven for slow heating at 60 °C for 24 h to remove the solvents. After the drying, the tape was punched into small discs of 14 mm diameter. The prepared and investigated electrodes are listed in Table 1.
Cell assembly
CR2032 type button cells were assembled in a glovebox (MBraun) under an argon atmosphere (O2 = 0.1 ppm, H2O < 0.3 ppm) to avoid contact of lithium and electrolyte with air and moisture. The positive and negative terminals are made of stainless steel. The positive electrode discs had a diameter of 14 mm and were covered with one layer of separator (d = 16 mm, Whatman GF/A) after insertion into the positive terminal. The separator and the pores of the positive electrode were soaked with liquid electrolyte (0.75 M LiTFSI and 0.25 M LiNO3 in DME: DOL 2:1). To ensure reproducibility of the experiments, the same volume of 50 microliters of electrolyte was introduced into the cell in each case. Metal lithium was used as the negative electrode. The lithium was cut to 10 mm diameter and in each case any contamination that might be present on the surface was removed. A spacer and a stainless-steel ring were then applied to the lithium to ensure proper pressure and contact. The cell was sealed with the top cover and the button cells were crimped together using an MSK-110 hydraulic crimper.
Preparation of standards for X-ray absorption spectroscopy
The Li-polysulfides standards were synthesized by mixing a stoichiometric amount of sulfur powder and lithium metal in excess of dried tetrahydrofuran (THF). The synthesis was performed in an argon filled glove box. The mixtures were stirred at 50 °C until all the reactants dissolved. THF was then removed under reduced pressure to obtain dry Li-polysulfides.
The S and Li2S standards were prepared by mixing commercially available chemicals with BN in a compositional ratio of 20 wt.% S or Li2S and 80 wt.% BN. This composition was also used for the Li-polysulfides. In all cases, the mixtures were pressed into 6 mm diameter pellets which were sealed between two thin Kapton tapes under argon atmosphere.
Operando cell
Due to the limited penetration depth of tender X-rays XAS measurements carried out at the K-edge of sulfur require some modifications of the coin cell. Initially, a hole was cut only on the sulfur side of the separator, i.e., the sulfur cathode, and only the positive terminal of the cell had a Kapton window with a diameter of 6 mm and a thickness of 7 μm. In the improved version, the lithium electrode and the spacers were also holed and a Kapton window was used on the negative terminal as well. In this case, the window dimensions were reduced to 4 mm in diameter to provide better pressure distribution and electrical contact within the cell (Fig. S1). It is to be emphasized that each of the above modifications may affect the cell performance (e.g. by reducing the electrical contact area). The construction of such kinds of in-operando cells can easily lead to self-discharge or short circuit85. However, with the optimization of the size of the windows, the size of the holes and the cell assembling method we were able to create a working cell and make the transmission measurements possible.
Materials characterization
SEM-EDS measurements
The morphology and the elemental composition of the electrodes were examined by SEM and EDS. For the SEM-EDS measurements a FEI Quanta 3D dual beam electron microscope with an EDAX Apollo-X silicon drift detector (controlled by Genesis software package) was used. 10 kV accelerating voltage, 40 μm aperture, 8 μs acquisition time and 12 mm working distance were applied for the measurements. The beam current was 4 nA and 16 nA, respectively.
XPS measurements
The measurements were performed by using an Omicron EA 125 electron spectrometer in the “Fixed Analyser Transmission” mode; photoelectrons were excited by non-monochromatized MgKα (1253.6 eV) radiation. After measuring a survey spectrum, high resolution spectra were collected from the regions of interest (S 2p, C 1 s, O 1 s, F 1 s, Na 1 s and other regions if needed). For recording the high-resolution spectra, the electron spectrometer was operated in the Constant Analyser Energy mode with a „Pass energy” of 30 eV, providing resolution around 1 eV. The energy scale of the electron spectrometer was calibrated according to the ISO 15472 standard. The estimated uncertainty of the binding energies obtained in this work is around ±0.2 eV.
Spectra were processed with the CasaXPS package86, while quantitative evaluation of the data was performed with the XPSMultiQuant package87, during which a homogeneous depth distribution was assumed for all components.
XAS measurements
The X-ray absorption spectroscopy measurements were performed at the ASTRA beamline of SOLARIS National Synchrotron Radiation Center (Krakow, Poland). The spectra were recorded at sulfur K-edge in fluorescence and in transmission detection modes. The ionization chambers and sample chamber were filled with N2 gas at 25 torr. Fluorescent radiation was measured by a KETEK GmbH AXAS-M complete spectroscopic system with silicon drift detector (SDD). For monochromatizating the white beam coming from the bending magnet a Si (111) double-crystal monochromator was used. The ZnSO4 white line at 2481.4 eV was used to calibrate the monochromator. The monochromatic beam was shaped by slits and its size was 2 mm × 1 mm at the sample position. The absorption spectra were recorded from −150 to 800 eV relative to the sulfur K-edge (2472 eV). In the XANES region, equidistant energy step of 0.2 eV was used. The analysis of the XAS spectra was carried out with the DEMETER program package88.
Electrochemical measurements
The cyclic voltammetry measurements were recorded in a potential range of 1.5–2.7 V with 0.1 mV s–1 sweep rate with a Biologic SP-150 potentiostat. The rate capability and long-term cyclization tests were performed with a CT3002AU-5V100mA LANDT battery test system in all cases.


Responses