Common and disease-specific patterns of functional connectivity and topology alterations across unipolar and bipolar disorder during depressive episodes: a transdiagnostic study

Introduction
Both unipolar depression (UD) and bipolar disorder (BD) could exhibit symptoms of depressive episodes. According to the Diagnostic and Statistical Manual of Mental Disorders (DSM) 5th edition, they are defined as different diagnostic categories. Currently, symptomatic diagnostic criteria remain the only reliable criteria for differentiating between BD and UD, i.e., whether there have been or currently manifesting manic/hypomanic episodes [1]. However, in the course of BD, depressive episodes are the main manifestation [2, 3] and usually begin with a depressive episode [4, 5], while the first manic/hypomanic episode is delayed up to 5 years [6, 7]. Prior to this, there was a significant overlap of symptoms between BD and UD [8], which troubled clinicians for accurate diagnosis and had a significant impact on treatment decisions [9], clinical outcomes [10], and resource use [11]. Therefore, it is of great significance to explore the potential pathophysiological differences between BD and UD, especially in the early stages of the disease.
Various clinical measures have been implemented to assess the risk of the diagnostic transition from depression to BD. These clinical features suggest that, compared to UD, BD is characterized by earlier onset, family history of BD, more frequent depressive episodes, psychotic symptoms, and treatment resistance [12, 13]. Additionally, several clinical rating scales including the Mood Disorder Questionnaire [14], Bipolarity Index [15] and Hypomania Checklist [16] have been used to identify subthreshold manic or hypomanic symptoms, aiding in the early identification of BD. Although their effectiveness has been demonstrated, these tools still lack sufficient specificity to significantly reduce diagnostic uncertainty [17].
Additionally, the shared neurophysiological basis between BD and UD increases the challenge of distinguishing them. [18, 19]. Some studies had reported common structural and functional changes between BD and UD [20,21,22]. Studies had shown that BD and UD had overlapping abnormalities involving primary neural networks such as visual network (VN) and somatomotor networks (SMN) [22,23,24] and high-order neural networks such as default mode network (DMN) [25,26,27] compared to healthy controls (HC). In recent years, many studies had focused on the primary neural network function, which may partially explain the negative emotional bias and psychomotor retardation of patients with depressive episode [23, 28, 29]. Meanwhile, research highlights the role of DMN in BD and UD, which is a taskless neural network related to self-reference processing and emotional appraisal [30]. Numerous studies have reported changes of DMN in BD and UD, which may partially account for the mood disturbances during depressive episodes [26, 31]. How do BD and UD patients exhibit similar clinical manifestations? These common network changes may be a reasonable explanation for the similar clinical manifestations of across BD and UD [32, 33].
Many studies had focused on exploring the predictors for early identification of BD. Functional brain network exhibits topological characteristics between pure randomness and regularity, and the topological features of the brain network are considered to achieve optimal balance through separated and integrated information processing [34,35,36]. In recent years, some studies have shown that analyzing the topological attributes of BD and UD provides valuable information for distinguishing between them. For example, a study shows that the network architectures of BD and UD exhibit a shift towards randomization, while BD exhibits a stronger degree of randomization than UD [37]. Another study had indicated that both BD and UD show differences in connection density and connection path length compared to HC, and there are differences between BD and UD [38]. However, most of these studies were conducted on whole-brain and did not focus on networks with common abnormalities underlying BD and UD. BD and UD often have subtle differences in clinical features under similar clinical manifestations [39]. Exploring differences in the topological attributes of these common abnormal large-scale networks may help uncover the neuropathological mechanisms underlying subtle differences in clinical features. Meanwhile, up to date, the vast majority of studies have compared the differences between BD and UD on cross-sectional [40, 41]. However, such comparisons did not provide the direct evidence for the early identification of BD from depression, as the patients who need to be identified are those initial depressive episode BD (IDE-BD). Therefore, it is necessary to conduct longitudinal research to obtain the direct evidence and reliable results [42].
The aim of this study is to investigate the predictors of diagnostic transition from depression to BD. In this longitudinal study, we identified a cohort of IDE-BD patients who were initially diagnosed with depression at recruitment but transitioned to BD during follow-up. We hypothesize that BD and UD share common abnormal networks, potentially serving as the neuropathological basis for their similar clinical manifestations. Additionally, we propose that BD and IDE-BD exhibit similar topological attribute patterns, distinct from those of UD, which may help the early identification of BD.
Methods
Participants
From 2012–2023, both BD and major depressive disorder (MDD) participants were recruited in Nanjing Brain Hospital. All of them were evaluated by two experienced psychiatrists through Mini-International Neuropsychiatric Interview (M.I.N.I, Chinese version) and were diagnosed depend on the Diagnostic and Statistical Manual of Mental Disorders-IV (DSM-IV). All of them completed clinical evaluations including 17-item Hamilton Depression Rating Scale (HAMD-17) and Hamilton Anxiety Scale (HAMA). At the time of recruitment, all patients were experiencing depressive episodes. Meanwhile, all patients recruited met the following inclusion criteria: (1) HAMD-17 scores > 7; (2) 18–60 years old; (3) right-handed and native Chinese speaker; (4) no physical therapy such as electroconvulsive therapy (ECT) or repetitive transcranial magnetic stimulation (rTMS) or psychological therapy within last six months. The exclusion criteria were as following: (1) patients with severe physical diseases, including severe cardiac, hepatic and renal insufficiency or autoimmune diseases; (2) patients with organic brain disorders; (3) psychoactive substance or drug abusers; (4) previous or current history of other psychiatric disorders; (5) contraindications to MRI scanning; (6) special populations such as pregnant and lactating women.
During the same period, age- and sex-matched HCs were recruited from the surrounding community, schools and hospitals, totally 204 cases. The criteria were as follows: (1) aged 18–60 years; (2) right-handed and native Chinese speaker; (3) no mental disorders and severe illness; (4) no history of mental disorders in first degree relatives; (5) no contraindications to MRI scanning.
MDD patients who completed the baseline assessments were included in the follow-up cohort. During follow-up, diagnostic information was verified by psychiatrists of the research team through a combination of telephone interviews, in-person interviews, and medical record reviews. Based on the follow-up outcomes, we classified the MDD participants into the IDE-BD group and the UD group. IDE-BD were those initially strictly diagnosed with MDD at enrollment and then transferred to BD with the episodes of mania/hypomania during follow-up. UD patients were those MDD patients who underwent a diagnostic review 5 years after discharge from the hospital, with no change in their diagnosis. The resulting sample included 536 patients, comprising 181 with BD, 265 with UD, and 90 with IDE-BD for analysis. All participants were informed in detail of the research process and signed informed consent forms, followed by detailed information collection and magnetic resonance scanning. This study was conducted in accordance with the Declaration of Helsinki and was approved by the Institutional Review Committee of Nanjing Brain Hospital affiliated to Nanjing Medical University (2011KY027).
Data acquisition
At the time of recruitment for the study, general information and clinical characteristics of participants were collected, including age, gender, educational years, family history of mental disease, age of onset, number of previous episodes, current episode duration and total illness duration. The MRI scan in this study was undertaken within 3 days of enrollment with a 3.0 T scanner (Siemens Verio; Erlangen, Germany) with an 8-channel radiofrequency coil. The participants were asked to lie in a flat position, had their head secured before the examination and were told to close their eyes, empty the mind, stay awake and avoid movement of the head and body parts. T1-weighted anatomical images obtained by gradient echo sequences with the following parameters: slice number = 176, slice thickness = 1 mm, repetition time/echo time (TR/TE) = 1900ms/2.48 ms, flip angle = 9°, field of view (FOV) = 250 × 250 mm2, matrix size = 256 × 256. The scan lasted 4 min 18 s. The functional images were acquired using gradient-recalled echo-planar imaging (GRE-EPI) with the following parameters: slice number = 32, slice thickness = 4 mm, TR/TE = 3000 ms/40 ms, flip angle = 90°, FOV = 240 × 240mm2, matrix size = 64 × 64, and voxel size = 3.75 × 3.75 mm. The total time was 6 min 45 s.
MRI data preprocessing
The MRI data were preprocessed using DPABI (www.restfmri.net) based on MATLAB Software and DiCER-lightweight (https://github.com/BMHLab/DiCER). The preprocessing pipeline were performed including: (a) removal of the first 6 volumes to stabilize magnetic signals; (b) skull stripping; (c) slice-timing and head motion correction; (d) alignment with high-resolution T1 anatomical images; (e) spatial normalization using the transformation matrix derived from mapping the T1 images to Montreal Neurological Institute (MNI) space via segmentation of gray matter, white matter, and cerebrospinal fluid, and resampling to 3 × 3 × 3 mm3; (f) detrending and band-pass filtering (0.01–0.08 Hz); (g) Diffuse Cluster Estimation and Regression (DiCER) [43]; (h) Gaussian smoothing with a 6-mm full-width at half-maximum core and linear detrending. All participants met the criteria of maximum translational motion < 3 millimeters and rotation < 3 degrees.
The Dosenbach atlas [44], including 160 ROIs distributed across the brain, was used construct functional brain networks. Each ROI was a sphere with a radius of 5 mm. We excluded the cerebellum from the analyses as it was not fully covered in all scans. After removing 18 ROIs in the cerebellum, 142 ROIs remained. For each ROI, the average time series of all voxels were extracted. The correlation coefficients, i.e. functional connectivity (FC), for each pair of two ROIs was calculated using Pearson’s correlation. Then resting-state FC (RSFC) matrix was then transformed to z-scores using Fisher’s R-to-Z formula.
Network analysis
The network-based statistics (NBS) analysis could identify intergroup differences in brain networks while overcoming multiple comparison problems. In NBS, cluster is generated by the connectivity of edges below the threshold in the topological space. For each edge, we used a strict threshold of P < 0.001. At the same time, a virtual distribution was generated with 5000 randomization permutations, and the value of significant difference for multiple comparisons was 0.05 [45]. The analysis and visualization were performed via DPABI toolbox(www.restfmri.net).
In order to characterize the differences obtained in the comparisons, the differences were mapped to the network defined by YEO [46]. According to the YEO atlas, the human cortex can be divided into seven networks. Due to the fact that the limbic network defined by YEO contains only a small number of edges, a subcortical network (SCN) was used to instead [23]. Therefore, the seven networks are the visual network (VN), the sensorimotor network (SMN), the dorsal attention network (DAN), the ventral attention network (VAN), subcortical network (SCN), frontoparietal network (FPN), and default mode network (DMN) [23]. Finally, the number of edges falling within the 7 networks and between the 21 networks was calculated.
Graph theory analysis
Graph theory analysis was used to explore the functional topological properties of abnormal networks shared by BD, IDE-BD, and UD. According to previous research [23, 47], a sparsity threshold range of 0.1–0.34 with a step size of 0.01 was set to generate a binary network, ensuring that the small world attribute could be maximally estimated. Global attributes including global efficiency (Eglob), local efficiency (Eloc), clustering coefficient (Cp), shortest path length (Lp), standardized clustering coefficient (γ), standardized shortest path length (λ), small world coefficient (σ) of the functional network at each sparsity threshold were calculated [48]. γ, λ and σ could reflect the small-world properties. A network displays small-world properties when the λ approximately matching randomization network and γ larger than the randomization network [48]. For all measures, the area under the curve (AUC) was calculated across the full threshold range as its superior sensitivity [49].
Statistical analysis
SPSS26.0 was used for statistical analysis of demographic and clinical characteristics. One-way ANOVA was used for continuous variables (age, education), while chi-square test was used for the categorical variable (gender). Clinical characteristics were compared across BD, IDE-BD, and UD. Permutation test and NBS in the DPABINet statistical toolbox was used to compare the network matrices between disease groups (BD, IDE-BD, and UD) and HC. Age, gender and years of education were controlled as covariates to ensure that the results were not affected by confounding factors. In order to demonstrate the changes in the topological properties of disease groups, T-test comparison was conducted between each disease group and HC group, with age, gender and education level as covariates. Spearman correlation analyses were performed between global attributes with differences and HAMD, with Bonferroni correction. Finally, in order to explore the difference of topological properties between IDE-BD and UD, T-test was conducted, with age, gender and education years as covariate variables.
Results
Demographic and clinical characteristics
The demographic and clinical characteristics of the participants are shown in Table 1. There was no significant difference in gender among the four groups. There was no significant difference at the time of recruitment between each disease group and HC, however, UD was older than BD at the time of recruitment (age, F = 11.390, p < 0.001; BD vs. UD, p < 0.001). The educational level of HC was higher than disease groups (education, F = 21.879, p < 0.001). Between IDE-BD and UD, there was no significant difference in the aspects including number of episodes, current episode duration, total illness duration, HAMD and HAMA. However, IDE-BD showed earlier onset age compared to UD (onset age, F = 34.297, p < 0.001; IDE-BD vs. UD, p = 0.033), which was consistent with the previous study [13]. Although there was no significant difference between IDE-BD and UD in family history of mental disorder after correction (χ2 = 4.182, p = 0.123), IDE-BD tend to show higher family history of mental disorder than UD before correction.
Abnormal FC patterns over UD, IDE-BD and BD
In order to investigate the alteration patterns of FC disease groups, we compared the differences of network matrices using NBS between each disease group and HC group. As the atlas defining 142 network nodes, a 142 × 142 network matrix was compared at the group level. The results showed that decreased FC involving numerous nodes and all 7 networks was found in the UD, IDE-BD, and BD compared to HC (NBS, edge p < 0.001, correction p < 0.05) (Fig. 1).

(A) decreased FC of BD compared to HC after NBS (edge p < 0.001, correction p < 0.05); (B) decreased FC of IDE-BD compared to HC after NBS (edge p < 0.001, correction p < 0.05); (C) decreased FC of UD compared to HC after NBS (edge p < 0.001, correction p < 0.05). VN, visual network; SMN, somatosensory network; DAN, dorsal attention network; VAN, ventral attention network; SC, subcortical network; FPN, frontoparietal network; DMN, default mode network.
To clarify how these changes are distributed in networks, we counted the number of edges that involve in each network (Fig. 2). In the UD group, the first three networks with decreased edges are SMN(71), VN(54), and DMN(38), respectively. In the IDE-BD group, the first three networks with decreased edges are SMN(26), DMN(10), and VN(8), respectively. In the BD group, the first three networks with decreased edges are SMN(47), VN(45), DMN(45), respectively. SMN, VN, and DMN are the common abnormal networks in disease groups.
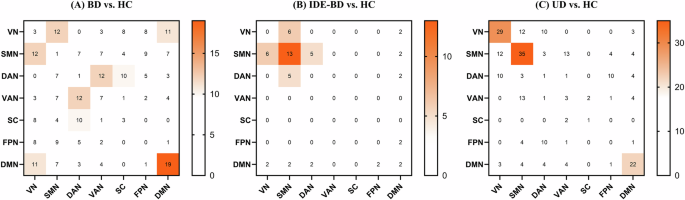
(A) Count of decreased FC in BD compared to HC; (B) Count of decreased FC in IDE-BD compared to HC; (C) Count of decreased FC in UD compared to HC. For the network abbreviations, please refer to Fig. 1.
Graph theory analysis of UD, IDE-BD and BD
Graph theory analysis was conducted within the nodes of SMN, VN, and DMN. The results show that the topological properties of UD, IDE-BD, and BD were disturbance (Fig. 3). UD (t = −2.394, p = 0.017), IDE-BD (t = −2.559, p = 0.011) as well as BD (t = −2.093, p = 0.037) showed decreased Cp comparing to HC. However, decreased Lp value and increased Eglob value were only found in BD (Lp: t = −2.720, p = 0.007; Eglob: t = 2.905, p = 0.003) and IDE-BD (Lp: t = −2.459, p = 0.015; Eglob: t = 2.526, p = 0.012) comparing to HC, and there was no significant difference in Lp value and Eglob value between UD and HC.
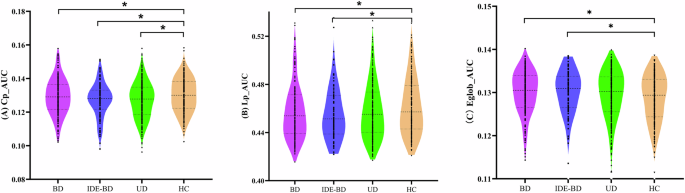
(A) BD, IDE-BD as well as UD show decreased Cp comparing to HC. (B) decreased Lp were only found in BD and IDE-BD, but not in UD, comparing to HC; (C) increased Eglob were only found in BD and IDE-BD, but not in UD, comparing to HC. Cp, clustering coefficient; Lp: shortest path length; Eglob, global efficiency.
Correlation analysis between the Cp value and clinical symptoms was conducted in patients with depressive episodes. There was a negative correlation between the Cp value and HAMD scores(r(536) = −0.102, p = 0.018). In addition, correlation analysis between the Lp value, Eglob value and clinical symptoms was conducted in the BD and IDE-BD. Results showed that there was a negative correlation between the Lp value and HAMD scores (r(271) = −0.134, p = 0.027, without correction), and a positive correlation between the Eglob value and HAMD scores (r(271) = 0.137, p = 0.024, without correction). However, no significant results were found after multiple comparison correction.
The comparison of topological properties between IDE-BD and UD was conducted. However, we did not detect a significant difference between IDE-BD and UD.
Discussion
The current study investigated the common and disease-specific FC and topological attribute abnormalities patterns in patients with depressive episode from a network perspective. We found widespread decrease of functional connectivity across BD, IDE-BD and UD. Aberrant networks including VN, SMN and DMN were shared across BD, IDE-BD and UD. In addition, the topological properties of BD, IDE-BD as well as UD were disturbance. Decreased Cp was observed in BD, IDE-BD as well as UD, and was associated with depressive symptoms. However, the alterations of Lp and Eglob were only observed in the BD and IDE-BD group, which seems correlated to depressive symptoms, while was not observed in the UD group. However, we did not detect the direct difference between IDE-BD and UD.
The current results add to the understanding of the altered connectome in affective disorders. While most past studies have focused on single affective disorders compared to HC [50, 51], our study show a common core of impaired RSFC in affective disorders. The findings highlight alterations of transdiagnostic nature. Reduction RSFC mainly focusing on VN, DMN and SMN was found in BD, IDE-BD and UD comparing to HC, which associated with visual input, emotional processing and sensory motor. The reduction connectivity strength of these networks reflects the overall pattern of connectivity dysregulation within the connectome, which is shared by affective disorders.
Vision is the foundation for people to obtain external information and respond to external stimuli, and abnormalities in VN have been found in many mental disorders [52, 53]. Although abnormalities in the FC of visual regions are not usually considered a core feature of psychopathology, our findings are not rare in pointing to dysfunction in VN and are consistent with a growing number of literatures focusing on sensory processing in affective disorders. Evidence from both task-based [54] and resting-state [55] studies suggest that patients with MDD have abnormal visual processing. Recent study reported that the disruption of VN was associated with clinical symptoms of MDD [56]. Study also implicated that FC was reduced in VN for patient with BD, which was significantly correlated with mood management. Study suggests that stimulation of areas of VN is a new therapy target for depressive episodes, providing rapid relief of depressive symptoms [57]. SMN plays a core role in detecting and processing sensory inputs, as well as preparing and executing motor functions [58]. Motor retardation has long been associated with a higher risk of mental disorders [59]. Sensorimotor dimension had been added to the Research Domain Criteria framework for understanding the importance of motor dysfunction in mental disorders [60]. A meta-analysis found reduced regional homogeneity of the SMN in patients with MDD, which could explain psychomotor retardation, a key clinical manifestation of MDD [61]. For depressed-BD, a study has shown that a major abnormal network is SMN [62]. Additionally, transdiagnostic studies highlight the dysconnectivity of SMN. A recent study showed the decrease FC within- and between-SMN in patient with affective disorder including MDD and depressed-BD [63]. Even if the clinical symptoms of the patients are relieved after treatment, the disconnection of SMN still persists, indicating that the disconnection of SMN may be characteristic markers of affective disorders. This emphasize that the abnormality of sensorimotor system is a key feature of cross diagnosis in patients with affective diseases, which implicating motor-related symptoms and their neural correlation are common psychopathological factors of emotional disorders [64]. DMN is a task-free neural network associated with self-reference processing and social cognition, and was frequently reported abnormalities in affective disorders [26, 30]. Reduced FC of DMN indicates impaired ability of integrate internal activities in affective disorders [65]. Our study is consistent with past mainstream results. Previous studies have found a robust result that DMN was the core abnormal networks in MDD [66,67,68]. For patients with BD, A study found reduced FC in some key regions of DMN (e.g., posterior cingulated gyrus and precuneus) in patients with BD [69]. A meta-analysis based on a seed-based approach found reduced DMN which may be associated with the clinical manifestation of depressive episodes in patients with BD [70]. These studies consistently demonstrate common abnormalities in affective disorder in both primary and high-order neural networks.
Our results are consistent with existing findings, indicating that BD and UD share the common hierarchy dysfunction patterns from primary neural networks (VN, SMN) to high-order neural networks (DMN) [22, 24]. Primary sensory neural networks (VN, SMN) are involved in the reception and abstraction of stimulation [71, 72], while the DMN could integrates abstract information with personal emotion, self-cognition, and inner thoughts, ultimately guiding external actions [73,74,75]. These hierarchy functional impairments will hinder the transition from perceptive function to more abstract function such as cognitive function and emotive function [76], which is the common anomaly characteristics of affective disorders in sensory processing and behavioral encoding [77,78,79]. The theory also supported by our study that reduced Cp was observed in BD, IDE-BD and UD, indicating the decrease ability of information obtaining and processing and behavioral encoding in affective disorders. Reduced Cp reflects diminished local interconnectivity of the network, reflecting impaired separation ability of brain network [80]. The correlation between Cp and HAMD emphasizes the commom role of these abnormalities in affective disorders.
Notably, we observed disease-specific topology abnormalities in BD. In addition to observing a decrease in Cp, we also observed a decrease in Lp and an increase in Eglob in the BD and IDE-BD but not in UD, which may reflect diagnosis-specific characteristic of BD. Lp and Eglob reflect the integration function of brain, which is the overall ability of information communicating [80]. Past graph theory studies have indicated that patients with BD show abnormal global network integration [50, 81, 82], which aligns with our findings. These findings suggest that the separation dysfunction of the brain may be shared by affective disorders, while alterations of integration function may be specific to BD. Further investigations showed that there seems to be a correlation between alterated Eglob and Lp and clinical symptoms in the BD and IDE-BD, but this was not observed in the UD. This further indicates that the abnormality in network integration function is specific to BD rather than a shared anomaly in affective disorders. In order to find direct evidence for early identification of BD, we tracked a group of patients who were initial diagnosis as MDD and then transferred to BD in the follow-up period. To our best knowledge, this is one of the few studies that focused on early identification of BD. Unfortunately, we did not identify any direct differences in the topological properties between IDE-BD and UD.
There are several limitations to the current study. First, although we tracked the progression of symptoms in patients with depressive episodes, we still could not guarantee that the UD patients in our study would not convert to BD, and ongoing follow-up should be conducted in the future to improve the diagnostic reliability of the sample. Second, the scan duration of 6 min and 45 s tends to be on the short side in terms of test-retest reliability. The scan duration not only affects the ability to obtain similar FC maps across subjects, but also impacts the ability to distinguish individual differences in FC strength. While it is standard to use 5–7 min of resting-state data, the test-retest reliability of FC estimates can be significantly improved by increasing the imaging duration to 9–13 min or longer [83]. Third, due to lack of strict restrictions, patients may be taking antidepressants or mood stabilizers. In the future, refined study needs to be conducted on a group of drug-navie patients. Fourth, there was a difference in educational attainment between the disease groups and HC in our study. Although we considered this as a covariate in our statistics to reduce the possible impact of the difference, we still could not completely rule out bias due to this condition. In the future, we need to recruit better matched HC to reduce bias in results. The current research does not include structural analysis. Future research should combine structural analysis, such as white matter connectivity or neurochemical imaging, which may help clarify potential mechanisms.
In conclusion, we explored the common and disease-specific network connectivity patterns between BD and UD, and tracked a group of patients defined as IDE-BD who initially strictly diagnosed with MDD but naturally BD in order to explore disease-specific connectivity patterns for the early identification of BD. The current study shows a common pattern of aberrant FC in affective disorders mainly including the VN, SMN and DMN which involve stimuli reception and abstraction, emotion processing, and guiding external movements. The network separation dysfunction in these networks is shared by affective disorders, however, the network integration dysfunction is specific to BD. The aberrant network integration functions in BD and IDE-BD might be valuable diagnostic biomarkers.


Responses