Predicting antipsychotic responsiveness using a machine learning classifier trained on plasma levels of inflammatory markers in schizophrenia

Introduction
Schizophrenia is a heterogeneous disorder characterised by its diverse manifestations in presentation, illness trajectory among individuals and treatment outcomes [1]. This heterogeneity challenges efforts to personalize treatment and derive accurate prognosis [1]. The Working Group on Classification of Psychotic Disorders for ICD-11 advocated the removal of traditional subtypes such as paranoid and catatonic as they lack clinical utility in everyday clinical practice [2]. However, these advocated changes are insufficient as classification of schizophrenia still heavily depends on symptom clusters. The introduction of severity and specifiers may pose more hurdles than benefits for busy clinicians. Additionally, the reliability and predictive validity of these additions remain uncertain and may not surpass the previously abandoned subtypes. Therefore, the identification of schizophrenia subtypes continues and involves various strategies such as biological markers, clinical staging and treatment response, each presenting unique challenges [3].
Despite the availability of numerous typical and atypical antipsychotics, except for clozapine’s effectiveness in refractory schizophrenia, differences in their efficacy remain inconclusive [4]. Present evidence suggests three distinct antipsychotic response levels: to antipsychotics other than clozapine, to clozapine itself, and a suboptimal response to both. Treatment guidelines typically mandate two unsuccessful antipsychotic trials before fulfilling criteria for treatment resistance and hence clozapine eligibility [2]. However, for those with a suboptimal response to clozapine, there’s limited evidence on effective interventions, hinting at a potential “ultraresistant” form of schizophrenia [2].
The significance of immune dysregulation in schizophrenia has garnered research and clinical interest [5]. There is accumulating evidence of immune abnormalities in blood, cerebrospinal fluid, central nervous system, including alterations in immune cell numbers, inflammatory markers, and antibody levels in schizophrenia [6]. This connection presents a compelling avenue for biomarker identification that might serve as vital indicators for clinical use, e.g. in identifying or prognosticating treatment response or resistance [6]. The exploration of immune-related biomarkers thus holds promise for more personalised and effective treatment approaches in schizophrenia.
Due to the heterogeneous and complex nature of schizophrenia, subtyping schizophrenia patients before identification of biomarkers is a more reasonable approach [7]. Machine learning (ML) techniques offer several advantages: Firstly, ML algorithms can sieve through high dimensional and heterogenous nature of biological data, which often contain many variables [8]. Through advanced feature selection and dimensionality reduction methods, ML algorithms can identify relevant patterns and associations within the data, even in cases where traditional statistical methods may struggle [8]. Recently, ML algorithms have gained traction in scrutinising schizophrenia patient data e.g., to predict clinical progress, differentiate between schizophrenia patients and healthy individuals, based on neuroimaging data, clinical information, and biological markers [8,9,10,11].
Building on this momentum, the objective of this study is to employ ML on blood-based measurements of inflammatory markers to train models for categorising individuals into three pharmacological subtypes of schizophrenia: antipsychotic responsive (ARE), clozapine responsive (CRE) and clozapine resistant (CRT). Through these models, we aim to enhance our understanding of schizophrenia subtypes, so to contribute to more personalised and effective treatment strategies.
Materials and methods
Study settings and subjects
The cross-sectional study was conducted at the Institute of Mental Health, Singapore. Individuals living with schizophrenia, aged 21 to 80 were enrolled in the current study. Participants are categorised into three pharmacological subtypes, namely: ARE, CRE and CRT. A set of healthy control (HCL) is also included in this study for comparative analysis.
The Clinical Global Impression – Schizophrenia scale (CGI-SCH) assesses positive, negative, depressive, cognitive, and overall symptom severity, and was employed to assess symptom severity in the present study [12,13,14]. In the present study, positive symptom remission is indicated by a CGI-SCH score of 3 and lesser on the positive item, reflecting low levels of illness symptoms with little impairment in patient’s usual social and occupational roles. Individuals with schizophrenia were categorised as ARE, CRE and CRT based on criteria outlined by Lee et al. [13]. ARE was defined by the ability to attain CGI-SCH positive symptom remission after 8 weeks of non-clozapine antipsychotic agents [12]. Both CRE and CRT refers to individuals with treatment resistant schizophrenia (TRS), characterised by failure of 2 or more unsuccessful antipsychotic trials and subsequent prescription of clozapine. CRE or CRT was defined by the attainment of positive symptom remission after at least 8 weeks of clozapine treatment. Individuals selected as HCL have no past or current history of mental illness or neurological disorder and no first-degree relatives with diagnosed psychiatric disorders. Participants were excluded if they had a history of traumatic brain injury or immune-mediated disorders, had no febrile illness and were not on anti-inflammatory agents for at least one week before study enrolment.
Ethics approval for this study was provided by the National Healthcare Group’s Domain Specific Review Board. Written informed consent was obtained from all study participants. Experimental work on human samples was also approved by HSA Residual Blood Samples for Research, project titled “Blood biomarkers of immune-related diseases” (Ref No. 201306-05) and de-identified human blood tissue was collected in accordance with the approved IRB studies titled “Study of blood cell subsets and their products in models of infection, inflammation and immune regulation” (CIRB Ref: 2017/2806 and A*STAR IRB Ref. No. 2024-003).
Data and clinical information
Socio-demographic data such as age, sex, and ethnicity, and smoking status were collected from all study participants. Anthropometric measurements such as weight and height were collected during the site visit. Four study clinicians ascertained the diagnosis of schizophrenia using the Structured Clinical Interview for DSM-5 (SCID-5) and assessed symptom severity on the CGI-SCH [12]. Each clinician had at least 5 years of clinical experience in psychiatry and attained an inter-rater concordance of >0.9 on the CGI-SCH. Prescription information for antipsychotics was obtained from participants’ medical records.
Sample collection and measurement of protein expression of inflammatory markers
A sample of venous blood was collected from all study participants into CPTTM blood collection tube. Whole blood was centrifuged at 1700 g for 20 min for plasma collection which was stored in −80 °C. Plasma inflammatory markers were assessed using the commercially available Olink Target 96 Inflammation from Olink®. Proximity Extension Assay technology from Olink® uses antibody pairs conjugated to unique oligonucleotides and is quantified via PCR. When both antibodies of a pair bind the target protein simultaneously, their respective conjugated oligonucleotides are brought into proximity, facilitating hybridization. The oligonucleotide sequence is then extended by DNA polymerase, amplified, and measured by qPCR to determine the sample’s initial protein abundance. Raw analyte expression values after PCR underwent multiple rounds of transformation by Olink®, including a log2 transformation, and were returned as normalised protein expression values.
Missing value imputation and batch effect correction on proteome data
Plasma samples were put through the Olink® platform in three batches to describe relative serum expression for 96 proteins. Signals for any given protein falling below detection limit were treated as missing values and any protein missing for more than half of samples was excluded. 75 proteins met this criterion for inclusion in the analyses. Remaining missing values were imputed based on mean imputation. The procedure for mean imputation is as follows: for proteins which meet the inclusion criterion, the mean of the protein signal in its respective dataset is obtained and the missing signals were replaced with the mean.
The three independently generated proteome datasets would give rise to training set (n = 79), validation set (n = 80), and test set (n = 38) for model training (see next section).
Batch correction was performed using Olink® recommended procedure [15].
Model training and shapely additive explanations (SHAP) analysis
Sample labels (HCL, ARE, CRE, CRT) were reorganised into different tiers to perform three sets of learning tasks, each involving a different ML model (Fig. 1A). The first task (Model 1) differentiates HCL from those individuals living with schizophrenia (HCL vs. ARE & CRE & CRT). The second task (Model 2) resolves antipsychotic response from the schizophrenia group, namely antipsychotic responsive and TRS (ARE vs. CRE & CRT). The final task (Model 3) involves differentiating clozapine responders (CRE) from clozapine resistors (CRT).

A Hierarchical approach used for model development to determine schizophrenia status, antipsychotic response, and clozapine response. HCL refers to healthy control, ARE refers to antipsychotic responsive, CRE refers to clozapine responsive, CRT refers to clozapine resistant. B Validation pipeline using train-test split.
The support vector machine (SVM) was chosen for its simplicity and efficiency [16, 17]. The feature selection approach, Recursive feature elimination (RFE) is implemented to select important features [18,19,20]. Selected sets of proteins are referred to as feature sets. Model parameters, including C and gamma (penalty terms) were tuned to reduce overfitting to the training data. Other parameters such as the class weights were tuned to mitigate the effect of class imbalance of the dataset. Parameter tuning was optimised via five-fold Grid Search cross-validation (GridSearchCV).
The validation set is then deployed to compare and evaluate feature sets and parameters. This step minimises overfitting and increases generalization based on receiver operating characteristics (ROC) score. Once the model is optimised given both the training set and validation set, the test set is used to score the models on ROC scores and balanced accuracy.
To analyse our models, SHAP was used to explain models and identify discriminant proteins [17]. To interpret the SVM model using SHAP, contributions of each protein feature from each sample were calculated as SHAP values using KernelExplainer. As model coefficients cannot be directly extracted from a SVM model with a kernel, the feature importance is inferred using these SHAP values. SHAP values can be interpreted as a measure to how much each feature from each sample contributes to the outcome of the prediction (towards a positive or negative prediction) based on the model. Thus, a good performance from the ML model is tantamount to the reliability of the SHAP values generated.
All ML tasks were performed using scikit-learn (version 1.1.2) in the Python environment.
Statistical analysis
To evaluate the statistical significance of protein expressions, we use the two-sample t-test. Multiple test correction was performed using the Benjamini-Hochberg procedure, with the family-wise error rate cutoff at 0.05).
To access the statistical significance of difference between pharmacological subtypes, Kruskal-Wallis H Test for non-normal distributed data for age and BMI, and Chi-squared test for categorial variables such as sex, smoking status, and ethnicity.
Results
Clinical characteristics
The study sample comprised 49 individuals as HCL, a group of people with schizophrenia, categorised into 3 groups – 49 ARE, 68 CRE and 29 CRT. Characteristics of the study sample are summarised in Table 1. BMI and age differed significantly between the groups. ARE had the highest BMI at 26.9 (P = 0.001) and CRT was the oldest amongst all (41.6 years, P = 0.015). From the clinical assessments, CRT exhibited the most severe symptoms among the four groups evaluated. We observed no differences in sex and ethnicity in all four groups. A detailed breakdown of demographics for training, testing and validation sets is available in Supplementary S1.
Predictive modelling for schizophrenia status, antipsychotic response and clozapine response
In Fig. 2A, the ROC curves illustrate the sensitivities of each classification model. Model 1, which differentiates HCL from SCZ, has a ROC of 0.74, Model 2, distinguishing ARE from TRS, has an ostensibly higher ROC of 0.88. Model 3, which discerns clozapine responsiveness, showed a ROC of 0.78. These results show contrasting outcomes from the ML models compared to standard differential expression analysis using statistical techniques (Fig. 2). The data on sensitivities and specificities of respective models can be found in Table 2.
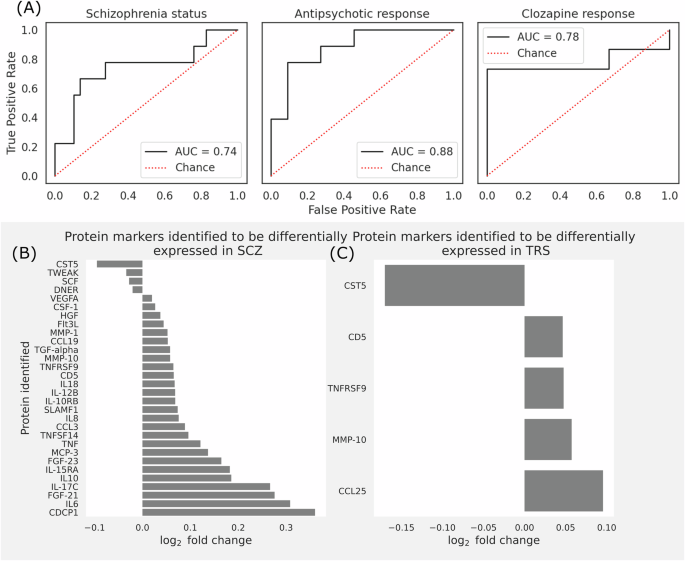
A Model performance for each classification task to determine pharmacological status. ROC curves for each model – (left) Status classification (HCL v. people with schizophrenia), (middle) Antipsychotic response classification (antipsychotic responsive v. antipsychotics resistant), and (right) Clozapine response classification (clozapine responsive v. clozapine resistant). B Bar graph showing the statistically significant fold change in protein expression of individuals with schizophrenia, compared to HCL. C Bar graph showing the statistically significant fold change in protein expression of individuals on clozapine, compared to individuals on antipsychotics except clozapine.
The prediction model was able to reasonably differentiate clozapine responsive and clozapine resistant samples, whereas our statistical analysis shows that there is no statistically significant difference between the clozapine responsive and clozapine resistant group in any proteins. Overall, our models can perform reasonably well on their classification tasks.
Protein profiles
Olink® inflammation panel was employed to detect the relative differences in inflammation-related protein expression levels between the study groups described in Fig. 1B. A total of 75 proteins were analysed after imputing for missing values (percentage of missing data seen in Supplementary S2). These proteins include 44 cytokines and chemokines, 11 cell surface receptors and signaling molecules, 7 enzymes and proteases, 11 growth factors and related molecules, and 2 other regulators and proteins (list of proteins seen in Supplementary S3). All 75 protein markers were used to build predictive models as elaborated in Fig. 2B.
Comparison of protein levels across groups
Figure 2B refers to the protein markers with statistically significant fold changes for comparisons between HCL and cases. 30 proteins exhibited significantly distinct levels between HCL and cases (i.e., ARE & CRE & CRT) (full list of proteins with fold change and P-values in Supplementary S3). Notably, CST5, DNER, SCF, and TWEAK displayed downregulated levels in individuals with schizophrenia, while CCL19, CCL3, CD5, CDCP1, CSF-1, FGF-21, FGF-23, Flt3L, HGF, IL10, IL-10RB, IL-12B, 12-15RA, IL-17C, IL18, IL6, MCP-3, MMP-1, MMP-10, SLAMF1, TGF-alpha, TNF, TNFRSF9, TNFSF14, and VEGFA exhibited upregulated levels. Most of these dysregulated immune biomarkers share functions related to immune regulation, inflammation, and cell signaling. They act on common pathways and networks such as immune cell recruitment and activation, T cell differentiation and proliferation, modulation of cytokine signaling, and cell growth and survival.
Figure 2C refers to the protein markers with statistically significant fold change for comparison between antipsychotic responsive and TRS groups. Five proteins (CCL25, CD5, CST5, MMP-10, and TNFRSF9) showed significant differences between antipsychotic responsive and TRS groups (ARE vs CRT + CRE); CCL25 emerged as the exclusive marker unique to antipsychotic responsiveness.
No significantly different protein markers were identified between clozapine responsive and clozapine resistance groups.
Discussion
Subgrouping individuals according to their response to antipsychotic treatment has potential for identifying clinically relevant prognostic markers. This could lead to effective personalised treatments which will improve clinical outcomes in individuals with schizophrenia. Personalised approaches could optimize therapeutic interventions, reducing trial-and-error prescribing and enhancing patient quality of life. The multifactorial nature of schizophrenia presents a significant challenge to personalise treatment. The interaction of genetic, environmental, and biological factors complicates the development of accurate predictive models. This complexity requires a multidimensional approach to integrate various data types and analytical methods to address the disorder’s intricacies. To the best of our knowledge, this study marks an early effort to develop a predictive model for categorizing antipsychotic responsiveness.
Model prediction
There have been numerous attempts to develop predictive models for precision psychiatry using ML and deep learning algorithms. However, most are trained on neuroimaging, speech patterns and digital features [21,22,23]. Only a handful were based on molecular biomarker data [8]. The present study was able to achieve a reasonable performance of 0.74 to distinguish people with and without schizophrenia, and 0.88 and 0.78 respectively for differentiating responsiveness to antipsychotics and clozapine. However, the drop in performance for model 3 (differentiating clozapine responsiveness) could be due to small sample size.
Regardless of accuracy and performance, all models still require external validation or practical implementation in clinical settings. The transition from research to clinical application involves addressing challenges to data standardization and integration with electronic health records. Successful implementation could lead to widespread adoption of predictive tools, allowing evidence-based decision-making in psychiatric care. So far, very few prediction tools developed in mental health research have progressed into clinical use, with the prediction of medication response in schizophrenia still in its early stages [24]. Two studies focused on predicting response to medications commonly used in bipolar disorder, namely lithium and quetiapine, utilizing baseline sociodemographic, clinical, and family history information [25, 26]. Although both studies developed models that performed above chance levels, neither model underwent validation in independent samples. In future research, a crucial strategy will be the integration of biological data for comprehensive analyses. Biological markers offer objective measurements of physiological processes or biomarkers, enhancing reliability and reducing variability. Furthermore, the ability to longitudinally monitor changes over time through biological data offers valuable insights into disease progression, treatment efficacy, and individual health trajectories. Therefore, integrating biological data, including molecular biomarkers, offers significant potential to enhance overall model performance and deepen our understanding of the genetic foundations of mental illnesses. This approach could lead to more precise and effective treatments, based on the comprehensive understanding of the biological underpinnings of schizophrenia.
Inflammatory markers
Using ML, we identified 18 proteins to be the most impactful features to differentiate healthy individuals from people with schizophrenia. These investigated proteins were involved in inflammatory processes, such as Jak-STAT, NF-κB, mitogen-activated protein kinases (MAPK), RAS, and TNF signaling pathway, cytokine-cytokine, and receptor interaction pathways [27]. 11 out of these 18 proteins (CD5, CST5, DNER, IL-10, IL-10RB, IL-12B, IL-15RA, IL-17C, MCP-3, MMP-10, and SCF) exhibited significant difference in protein expression levels between healthy individuals and schizophrenia group.
The identification of inflammatory markers associated with schizophrenia supports the growing evidence that immune dysregulation plays an important role in the pathophysiology of the disorder. Results from the present study are concordant with reported findings – higher protein expression levels of commonly studied markers such as CCL23, IL-6, IL-8, IL-10, IL-12, IL-15, TNF and TGF are observed in individuals with schizophrenia when compared to healthy individuals [28, 29]. As chemokines, growth factors, cell surface receptors traditionally, received less attention than cytokines, reports of such group of inflammatory markers in psychosis or schizophrenia are limited and often inconsistent. Nonetheless, we observed a general upward trend for similar markers for individuals with schizophrenia in the present study [30, 31]. The observed elevated levels of cytokines and chemokines indicate a possible ongoing inflammatory state, contributing to neuroinflammation and subsequent neuronal dysfunction observed in schizophrenia [32]. Understanding these biological changes allows new avenues for exploring targeted anti-inflammatory treatments as adjunctive therapies for schizophrenia.
Several meta-analyses on associations between immunological markers and antipsychotics response were limited to pre- and post-treatment in first episode psychosis [33, 34]. Among numerous immune biomarkers studied, IL-1β, IL-6, and TGF-β were consistently reported to have significant reductions post-antipsychotic treatment. Thus far, only one meta-analysis conducted to evaluate the immune alterations induced by clozapine which reported a down-regulation of IL-6 levels in patients who received clozapine, compared to other antipsychotics [35]. Although the present study had similar down-regulation of IL-6 (log2 fold change of −0.112) in TRS compared to ARE, this fold change did not meet statistical significance. Out of the 8 immune markers identified via ML, only IL-18 and TNF from this study was associated with response to amisulpride, risperidone, olanzapine, and/or quetiapine [34]. Further investigation into the role of less-studied inflammatory markers, such as CCL25, CST5, MCP-2, MCP-4, PD-L1, and TNFRSF9 is necessary.
The value of ML for classifying pharmacological subtypes
ML methods such as the Support Vector Machine (SVM) used in this study can discern subtle signals that may not be identified through traditional statistical testing. Unlike conventional statistical methods like the t-tests, ML methods can model multiple features simultaneously and capture relationships between features, which might be overlooked. ML models can handle multidimensional analyses, uncovering intricate interactions, providing a more comprehensive understanding of schizophrenia’s biological landscape.
The SVM was selected for its simplicity, robustness, and its reliance on a good feature set. When coupled with the explainable AI approach SHAP, we were able to improve model interpretability. Based on Fig. 3, several statistically significant features had less predictive power compared to features that were not statistically significant based on the mean absolute SHAP value. Hence, this approach can be powerful for biomarker screening. Contemporary methods like ensemble methods (such as bagging and boosting) are recognised for their superior prediction performance score and popularity. However, in this context, they may not be appropriate due to our limited sample and feature size.
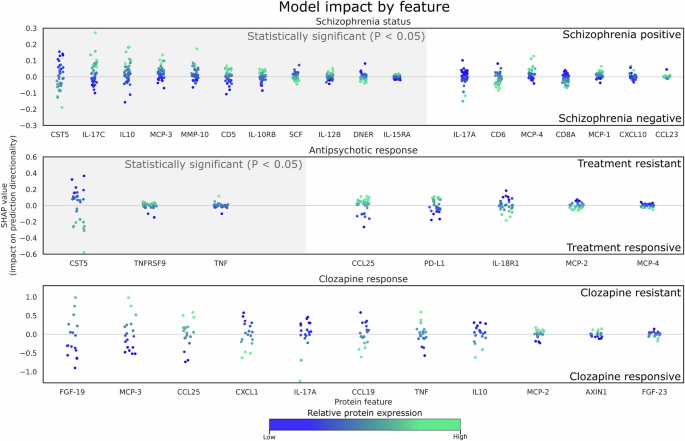
Each datapoint represents a prediction from the test set, the x-axis represents selected proteins, and the y-axis represents the respective impact on the prediction outcome by the model (e.g. towards treatment resistance or treatment positive). Since the datapoints represent the contribution of each sample by each feature to its prediction, they are color coded to its relative protein expression value in the test set. Grey hue along the x-axis denotes proteins that are deemed to be statistically significant. There are no statistically significant features detected between clozapine responsive and clozapine resistant samples. (top) HCL from participants with schizophrenia, (middle) Antipsychotic responsiveness (ARE vs TRS), and (bottom) Individuals with TRS (CRE vs. CRT). Each datapoint represents a sample of each feature, which represents its SHAP value and how it contributes to the final prediction outcome (refer to Supplementary S3 for a comprehensive list of fold changes, P and SHAP values).
Strengths and limitations
Strengths. The sample population is from a single site in a tertiary healthcare institute, which enabled enrollment of a well-characterised clinical sample and reduce heterogeneity in data and sample collection. Adopting plasma proteins enables high throughout analysis, allowing for the simultaneous identification and measurement of a vast array of proteins.
Limitations. The inflammation panel in the current study is a general list and not tailored for psychosis or mental disorders. We were unable to enroll a drug-naïve group to investigate the impact of medication exposure on peripheral immune profiles. Our study lacked longitudinal evaluation, essential for understanding the consistency of immune profiles among pharmacological subtypes, as well as the influence of factors such as exposure to infectious agents or alterations in medications or treatment regimes.
We demonstrated the efficacy of using ML to predict pharmacological subtypes of schizophrenia based on blood-based inflammatory biomarkers. Our study shows that extracted biomarkers from ML models exhibit different expression levels but do not necessarily attain statistical significance possibly due to limited sample sizes and clinical heterogeneity. Despite these limitations, the functional characterization of ML selected biomarkers is supported by contemporary literature, which validates their associations with biological pathways or processes that are relevant to schizophrenia. Hence, ML-based models can be useful for predicting treatment outcomes and yield meaningful markers for understanding underlying mechanisms.


Responses