Suicidal risk is associated with hyper-connections in the frontal-parietal network in patients with depression

Introduction
Suicide is a complex multifactorial phenomenon. Up to 60% of people who commit suicide have a major depressive disorder (MDD) [1], and depressive patients have suicide mortality about 20 times higher than that of the general population [2]. Moreover, in patients with treatment-resistant depression (TRD), the suicide attempt (SA) was sevenfold higher compared to those with non-TRD patients [3,4,5], suggesting that suicide has a strong association with depression. Suicide ideation (SI) is the process of thinking or ruminating about not wanting to live or imagining being dead or forming a plan to do so, which is a significant risk factor for suicide behavior and is often present before an SA occurs. Identifying SI is thus a critical step in preventing suicide. Both SI and SA may exhibit characteristics of syndromes, including commitment, rigidity, failure, shame, and isolation [6]. However, in clinical practice, most patients will not show or are unwilling to express their suicidal ideation, making it difficult to evaluate the suicide risk precisely and timely.
Brain imaging holds promise to provide objective biomarkers for suicidal risk. Previous studies have demonstrated the role of prefrontal cortices and subcortical structures including the amygdala, basal ganglia, and hippocampus in mediating aggression, impulsivity, and mood regulation [7,8,9,10]. Functional connectivity in several large-scale brain networks, including the fronto-parietal network (FPN) and the default mode network (DMN), was related to increased suicidality in MDD patients [11, 12]. Nevertheless, characteristics derived from functional imaging are poor predictors of individual suicide risk, either due to unreliable subject-level neuroimaging results or limited sample size for the biomarker discovery [13,14,15]. Recent studies suggested that sufficient functional data, e.g., 25 min of resting-state functional magnetic resonance imaging (fMRI) data per subject, and, in some cases, even as much as 4 h, are required to obtain reliable functional markers and distinguish an individual from the group [16].
To discover meaningful biomarkers for suicidal risk, it is critical to obtain within-subject measurements across different states. For depression with high suicide risks, electroconvulsive therapy (ECT) is the first-line treatment that can alleviate suicidality rapidly and effectively [17, 18]. The fast response makes ECT an ideal therapeutic paradigm to investigate how functional activity changes across different risk states within the same individual. Here, we aimed to explore the neurobiological mechanisms underlying suicide risk varying from no SI to SI/SA based on individualized functional connectome derived from resting-state fMRI (rs-fMRI). We first identified a set of functional connections that track suicide risk in patients and then examined whether these connections can be normalized by ECT treatment. These findings will provide insights into neural mechanisms of suicide and may lead to future biomarkers for early identification and intervention of individuals at high risk of suicide.
Materials and methods
Participants
From July 2021 to July 2022, a total of 99 participants aged between 16 and 45, diagnosed with a depressive episode according to DSM-5 criteria (Diagnostic and Statistical Manual of Mental Disorders, 5th Edition, DSM-5) [19], were enrolled at Beijing Anding Hospital, Capital Medical University, China (Registration number: ChiCTR2100048182). The study was approved by the Ethics Committee of Anding Hospital (No.202194FS-2) and conducted in accordance with the declaration of Helsinki. Informed consent was obtained from each participant.
Eligible participants must have a score ≥17 on the 17-item Hamilton Depression Rating Scale (HAMD) [20], and was diagnosed with either unipolar or bipolar depression disorder. None of the participants had comorbid psychiatric diagnoses; however, 6.06% (6 out of 99) reported non-psychiatric conditions such as kidney stones, lumbar disc herniation, adenomyosis, or polycystic ovary syndrome. For participants who received the ECT administration, they must show recent suicidal symptoms (SS), including SI and/or SA, within two weeks. Exclusion criteria were: a history of schizophrenia or other mental disorders (e.g., intellectual disability), neurodegenerative or neurological disorders (Alzheimer’s disease, epilepsy, severe brain injury, etc.), current drug or alcohol abuse, MRI contraindications, allergies to muscle relaxants or anesthetics, pregnancy, or recent use of ECT or other neuromodulation therapies such as transcranial electrical stimulation within 90 days preceding the study. Twenty-nine patients with SS received ECT treatment and were allowed to change their medication regimen throughout the ECT intervention.
Before the initiation of ECT, all participants underwent assessments using the Beck Scale for Suicide Ideation (BSSI) [21], the HAMD, the Hamilton Anxiety Rating Scale (HAMA) [22], and the MATRICS™ Consensus Cognitive Battery-Chinese version (MCCB) [23]. The BSSI is a 21-item self-report questionnaire, with only 19 items scored, utilized for a comprehensive assessment of suicide ideation severity. Scores range from 0, indicating the absence of the symptom, to higher values indicating more pronounced suicidal thoughts. The depressed patient cohort was categorized as follows: (1) individuals with suicide ideation (BSSI score >0) but without any suicide attempt were labeled as the SI group; (2) those who had attempted suicide were labeled as the SA group. Notably, all SA cases in this study were accompanied by suicide ideation; (3) all patients with non-zero BSSI scores were labeled as the SS group, encompassing both SI and SA cases; (4) individuals exhibiting no suicide symptoms (NSS) constituted the NSS group, defined by a BSSI value of zero; (5) SS patients who underwent ECT treatment before and after the intervention were further subdivided into the SS_pre and SS_post groups.
After quality control of the data (mean head motion <0.25 mm, completed rs-fMRI and BSSI and HAMD estimates), data from 61 SS patients (31 SI and 30 SA patients) and 35 NSS patients were retained for the imaging biomarker analysis, while 21 SS patients (12 SI and 9 SA patients) with pre- and post-ECT treatment data were retained for the within-subject intervention analysis. Demographic and clinical characteristics of SS and NSS participants are summarized in Table 1, and those of SS_pre and SS_post are provided in Table S1. Details regarding suicide methods and times of occurrence are detailed in Table S2.
ECT procedure
The Thymatron system (Somatics Thymatron®, Venice, FL, USA) was utilized for administering ECT with bifrontal electrode placement sites during the procedure. The stimulus dosage was determined using the half-age method [24]. Prior to anesthesia induction, all patients received 0.5 mg of atropine intravenously. Muscle relaxation was achieved through intravenous succinylcholine administration (0.4 mg/kg for women, 0.5 mg/kg for men), and anesthesia was induced with intravenous propofol (1.5 mg/kg). Patients underwent 9–12 sessions of ECT treatment scheduled on Days 1, 2, 3, 4, 6, 8, 10, 12, and 14. Additional sessions on Days 16, 18, and 20 were provided if necessary based on the patient’s response to treatment.
MRI data acquisition and processing
MRI data were acquired on a 3 T Siemens Magnetom Prisma scanner with a 64-channel phased-array head coil at Beijing Anding Hospital. MRI scans and clinical assessments were performed on the same day. All participants completed structural T1-weighted and 24-min resting-state fMRI scans. For participants receiving ECT, the MRI scans were completed within 3 days before the ECT. The parameters for high-resolution structural T1-weighted image acquisition were as follows: repetition time (TR) = 2530 ms, echo time (TE) = 1.85 ms, field of view (FOV) = 256 × 256 mm2, flip angle (FA) = 90°, voxel size = 1 × 1 × 1 mm2, slice thickness = 1.0 mm, matrix = 256 × 256. The parameters for resting-state fMRI parameters were: TR = 3000 ms, TE = 30 ms, FOV = 216 × 216 mm2, matrix = 64 × 64, FA = 90°, slice number = 47, slice thickness = 3 mm, voxel size = 3 × 3 × 3 mm3, and 47 axial sections collected with interleaved acquisition and no gap. Four functional runs were acquired per participant and each run lasted 6.2 min (124 time points). During the resting-state scan, participants were instructed to remain still, stay awake, keep their eyes closed, and avoid repetitive or specific thoughts. Participants who received ECT also participated in a post-treatment MRI session within 5 days after the last ECT treatment, using parameters identical to those for the baseline MRI.
MRI data were preprocessed using the same methods as reported in our previous studies [25]. In brief, the T1-weighted images were first processed to reconstruct the cortical surface using FSL and Freesurfer. Resting-state fMRI data were aligned to the structural image using boundary-based registration. FMRI data were preprocessed using the following steps: (1) removing the first four frames; (2) slice timing correction; (3) motion correction; (4) global mean signal normalization across runs; (5) band-pass temporal filtering (0.01 – 0.08 Hz); (6) regression of covariates, which includes motion parameters, average signals derived from anatomically-defined whole-brain, white matter, cerebrospinal fluid masks, and their temporal derivatives. Head motion was quantified using frame-wise displacement (FD) with Jenkinson’s method, which is calculated as the root mean square of translational and rotational movements [26]. The fMRI data of each participant were registered to the surface fsaverage6 template and smoothed using a 6-mm full-width half-maximum kernel in the surface space.
Individual-level functional network parcellation
Cortical functional regions were mapped in each individual according to the following steps. First, we segmented each hemisphere into 5 zones according to the Desikan-Killiany atlas [27]. Second, a group-level atlas with 92 subareas covering the whole brain cortical surface was created based on a large sample of 1000 subjects from the Genomic Superstruct Project using a k-means clustering approach. Third, a previously established iterative parcellation algorithm was implemented to gradually refine the boundaries of the subject-specific functional regions for each participant [28]. Using this procedure, 92 individualized, homologous functional regions (46 regions in each hemisphere) were localized in each participant. This technology demonstrated good reliability (dice’s coefficient = 0.76 ± 0.03, range: 0.69–0.84) when individualized functional regions were derived from only 12-min (split-half of the 24-min data) data across all 96 participants (61 SS and 35 NSS). To explore the characteristics of large-scale networks, these functional regions were further grouped into seven canonical networks reported by Yeo et al. [25], which included the visual (VIS), sensorimotor (MOT), attention (ATN), salience (SAL), limbic (LMB), frontoparietal (FPN), and default mode networks (DMN).
Functional connectivity (FC) was estimated by calculating Pearson’s correlations between the time series of each region, and then an individualized symmetrical FC matrix (92 × 92) was created. The FC values were transformed to Fisher’s z values. Each participant’s functional brain was thus characterized by 4186 (92 × 91/2, the lower triangle of the FC matrix) individualized connections in the FC matrix.
Identifying connectivity markers for suicide risk
We identified FCs in the SS group that could predict the BSSI score using leave-one-out cross-validation (LOOCV). Specifically, we temporarily excluded one participant from the SS group as the test set and used the remaining 65 (N-1) participants as the training set to train a predictive model. Within the training set, Pearson’s correlations between all FCs and the BSSI scores were calculated, considering covariates including age, gender, education, HAMD without suicide item, HAMA, duration of depression, and head motion. FCs that are significantly (p < 0.05) positively or negatively correlated with the BSSI were selected as input features to construct the linear predictive model using the LIBLINEAR package with default parameters [29]. The selected features in the test data were then used as input for the prediction model to estimate the BSSI score for the test set. After completing the LOOCV for all patients, we calculated Pearson’s correlation between the predicted and actual BSSI scores to evaluate the performance of identified FCs in predicting BSSI scores.
Abnormal connections and their normalization through treatment
To explore the dysfunctions of large-scale networks potentially linked to suicide risk, we conducted two-sample t-tests to compare the identified FCs for each network between patients with suicide risk (SS group) and those without suicide risk (NSS group). These identified FCs related to the BSSI scores were grouped into seven canonical networks. An imaging score calculated as the average FC within each network was used for group comparison. We included age, gender, education, HAMD (excluding the suicide item), HAMA, duration of depression, and head motion as covariates in the analysis.
If FCs are found to be aberrant in individuals with SS, we proceeded to investigate whether ECT treatment could influence and normalize them. Paired t-tests were conducted on the identified connections to assess changes from pre- to post-treatment (SS_pre vs. SS_post).
Exploratory analyses
We investigated the capacity of the imaging marker to indicate the escalation of risk from SI to SA. Using a one-way analysis of variance (ANOVA) test with the age, gender, education, HAMD without suicide item, HAMA, duration of depression, and head motion as covariates, we assessed variations in the imaging marker scores across NSS, SI, and SA groups. Subsequent post-hoc two-sample t-tests were conducted to ascertain whether the observed group differences were primarily attributable to SI or SA.
To determine if the identified FCs are specifically contributing to the estimation of suicide rather than depression symptoms present in the cohort, we conducted the same prediction analyses for HAMD and examined the overlap between the identified FCs for BSSI and those for HAMD in the SS group.
Given the gender imbalance in each group, we further explored whether the identified FCs were influenced by gender. We first compared the identified FCs between males and females. Additionally, we re-ran the group comparisons between NSS and SS, as well as between pre-treatment and post-treatment, within the female and male groups separately.
Results
ECT rapidly alleviates suicidal risk
Demographic data and clinical characteristics of the SS (n = 61) and NSS (n = 35) groups are summarized in Table 1. No significant differences were observed in age (SS: 25.52 ± 8.13 years; NSS: 26.46 ± 9.01 years; p = 0.604), education (SS: 14.41 ± 2.15 years; NSS: 14.49 ± 2.25 years; p = 0.870), gender distribution (SS: female, n = 48; NSS: female, n = 24; p = 0.271), duration of depression (SS: 4.03 ± 4.80 years; NSS: 3.67 ± 4.42 years; p = 0.716), or cognitive deficits (SS: 44.93 ± 9.48; NSS: 46.59 ± 8.50, p = 0.432) between the two groups. However, as expected, HAMD, HAMA and BSSI scores were significantly higher (p < 0.001) in the SS group. There were no significant differences in current medication status (p > 0.05) between the SS and NSS groups.
Among the SS participants, 29 received ECT, and 21 completed the post-treatment assessment and MRI scan. Following 9–12 ECT sessions, 18 out of 21 patients (85.7%) reported no suicidal thoughts (BSSI = 0), while 3 patients reported suicidal thoughts (BSSI > 0). Across the entire group of 21 patients, there was a significant decrease in BSSI scores, HAMD scores, and HAMA scores, as well as a mild increase in MCCB scores throughout ECT treatment (Table S1). These results indicate an overall improvement in symptoms including those related to suicide risk, depression, anxiety, and cognition. Adverse events, such as headache and dizziness, were reported but did not persist during the treatment phase, and no severe adverse events occurred during the experiment.
Functional connectome could predict suicide risk
To assess the capability of individualized FCs in predicting suicide risk, we trained prediction models to estimate the BSSI scores. The findings revealed that a specific set of FCs could predict the BSSI scores, and the predicted BSSI scores exhibited a significant correlation with the actual BSSI scores (Fig. 1, r = 0.41, p = 0.001). This prediction model included 40 connections across multiple networks.

Scatter plots show the correlation between BSSI scores predicted using FCs and the actual BSSI scores. Each dot represents one participant from the SS group. FCs were derived from 92 individualized regions of interest (ROIs). The group-atlas-based 92 regions encompassing the seven networks from the Yeo atlas are displayed, with black lines indicating the boundaries of these regions. BSSI Beck scale for suicide ideation, VIS visual network, MOT sensorimotor network, DAN dorsal attention network, VAN ventral attention network, LMB limbic network, FPN frontoparietal network, DMN default mode network, FC functional connectivity.
Suicide risk is associated with hyper-connectivity in the FPN
These 40 connections that contributed to the estimation of the BSSI score were subsequently categorized according to the 7 canonical networks and compared between the SS and NSS groups to investigate network abnormalities. Our analysis revealed that connections involving the FPN were significantly increased in the SS group (Fig. 2, two-sample t-test, p = 0.008, Cohen’s d = 0.58, FDR corrected) than in the NSS group. Within these FPN connections, 4 demonstrated positive FC values, while 4 showed negative FC values. Notably, upon investigating these positive and negative FCs separately, we observed significant increases in negative FCs (two-sample t-test, p = 0.022, Cohen’s d = 0.50) and moderate increases in positive FCs (two-sample t-test, p = 0.077, Cohen’s d = 0.38) within the FPN in the SS group compared to the NSS group.
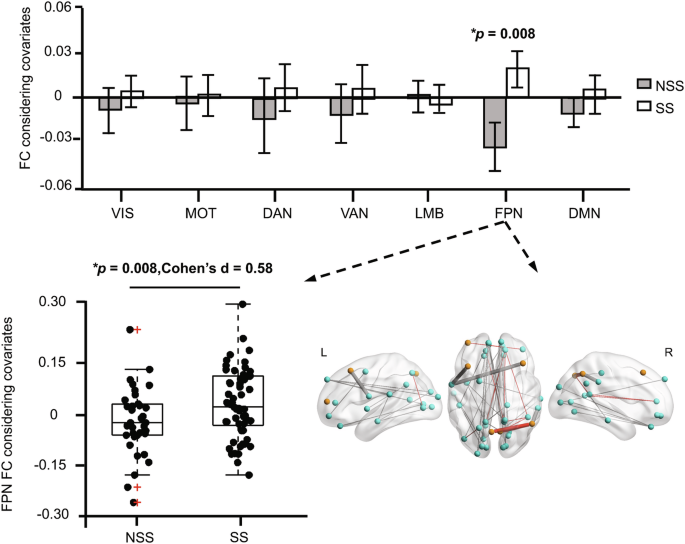
The 40 FCs contributing to BSSI prediction were categorized into 7 networks, and the average of connections included in each network was compared between the SS and NSS groups. The average of 8 FCs in the FPN was significantly (p = 0.008, FDR correction) increased in the SS group. The red “+“ symbols denote individual outliers, identified as data points deviating 1.5 times the interquartile range from the bottom or top of the box. SS suicide symptom, NSS no suicide symptom, BSSI Beck scale for suicide ideation, VIS visual network, MOT sensorimotor network, DAN dorsal attention network, VAN ventral attention network, LMB limbic network, FPN frontoparietal network, DMN default mode network, FC functional connectivity, L left, R right.
ECT normalizes hyper-connectivity in the FPN
Subsequently, we investigated the impact of ECT on these FPN hyper-connections that are associated with suicide risk. We found that the negative FCs connected to the FPN were significantly diminished in the SS_post group compared to the SS_pre group (paired t-test, p = 0.001, Cohen’s d = 0.56, Fig. 3), while positive FCs connected to the FPN remained unchanged (paired t-test, p = 0.747, Cohen’s d = 0.08). The regions connected by these negative FCs included the FPN, VAN, MOT, and DMN. Intriguingly, this set, FPN negative hyper-connections in the SS group compared to the NSS group (two-sample t-test, p = 0.022, Cohen’s d = 0.50), was restored to normal levels after treatment (SS_post vs. NSS, two-sample t-test, p = 0.794, Cohen’s d = 0.07).
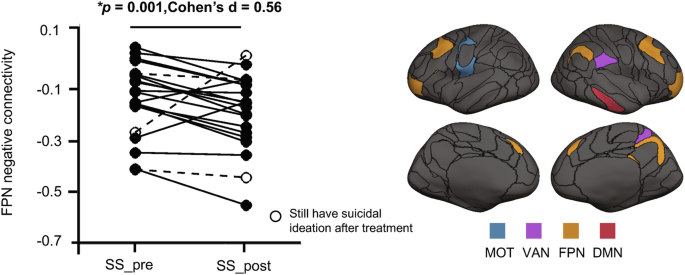
Identified negative FCs from FPN were decreased in the SS_post group compared to the SS_pre group (paired t-test, p = 0.001), brain regions of these connections were shown on the right. SS_Pre patients with suicide symptoms at pre-treatment, SS_Post patients with suicide symptoms at post-treatment, FPN frontoparietal network, MOT sensorimotor network, VAN ventral attention network, DMN default mode network.
Exploratory findings
Given that the SS group included patients with SI and SA, we explored whether the identified FPN connectivity differed among NSS, SI, and SA groups. One-way ANOVA test revealed a significant difference in the three groups (Fig. S1, p = 0.006). Post-hoc two-sample t-tests showed significantly elevated FPN connectivity between SA and NSS (two-sample t-test, p = 0.002, Cohen’s d = 0.81), a significant difference between SA and SI (two-sample t-test, p = 0.039, Cohen’s d = 0.54), but not between NSS and SI (p = 0.269, Cohen’s d = 0.27), indicating the observed group difference in the FPN connectivity was primarily driven by the patients with SA.
To explore the potential of using functional connections as biomarkers specific to suicide risk rather than depressed mood, we compared the FCs predicting BSSI with those predicting HAMD scores (excluding the suicide item). Only 1.6% of the FCs were found to contribute to both BSSI and HAMD scores. Importantly, the FPN negative hyper-connections normalized by ECT in the SS group were not among the FCs predicting HAMD scores. Additionally, there was no difference in these functional connections between females and males (p = 0.731, Cohen’s d = 0.08). However, upon reanalyzing the main findings separately for females and males, these results were primarily driven by females (Fig. S2).
Discussion
Discovering a reliable biomarker for assessing suicide risk holds the potential to detect and prevent suicidal behavior at an early stage. In this study, precision resting-state fMRI was employed to identify a specific set of functional connections associated with suicide risk. We found that connections involving the FPN exhibited heightened connectivity in individuals with suicidal symptoms compared to those without such symptoms. ECT was found to normalize these connections, suggesting the potential neural mechanisms of this treatment in mitigating suicide risk. Furthermore, negative connections within the FPN exhibited the most significant changes following ECT. Collectively, this data underscores the existence of neurobiological foundations for suicide risk that could potentially be normalized through intervention, paving the way for future personalized neural therapy.
The FPN, essential for executive functioning, relies on the dorsolateral prefrontal cortex (DLPFC) and inferior parietal lobule (IPL) as major hubs, which are densely connected with other cortical areas responsible for various functions such as attention, decision-making under uncertainty, and complex problem-solving [30, 31]. Previous neurobiological studies, both in vivo and post-mortem, have implicated frontal and parietal regions in suicide risk [32, 33]. Structural changes in the DLPFC and IPL have been linked to planned suicide attempts in bipolar patients [34], and a history of suicide attempts in patients with MDD [35, 36]. Functional connections involving the DLPFC or/and IPL, particularly with the striatum and motor regions, have been associated with self-harm, suggesting the involvement of the FPN circuit related to behavioral disinhibition and impaired decision-making, both risk factors for suicidal behaviors [1, 37, 38]. Disturbances in the fronto-parietal areas that regulate impulsivity can impair the evaluation of behavioral consequences, thereby increasing the likelihood of suicide [39]. Participants with suicide risk showed altered negative connectivity in the FPN, suggesting reduced competition or interaction with this network. These disruptions in negative connectivity indicate impaired functional coupling, which compromises the ability to accurately regulate control over risk behaviors, potentially leading to the development of suicidal thoughts.
The normalization of FPN connectivity following ECT suggests that ECT may exert its therapeutic effects by modulating these neural circuits, enhancing emotion regulation processes and thereby reducing suicidal ideation and behavior. ECT induces rapid and widespread changes in brain function and connectivity, making it ideal for investigating acute treatment effects on abnormal FC in patients at risk for suicide. However, other treatments with more subtle mechanisms of action, such as cognitive-behavioral therapy (CBT) or mindfulness-based interventions, can also beneficially change brain connectivity, though these changes may not be as pronounced or rapid as those observed with ECT [40, 41]. Similarly, pharmacological treatments like antidepressants have been associated with alterations in the FPN connectivity [42, 43]. While their mechanisms of action differ from ECT, they can still positively impact neural networks relevant to depression and suicide risk. Overall, various interventions targeting suicide risk may have effects on similar brain circuits, albeit through potentially different mechanisms.
Understanding the neural mechanisms underlying the therapeutic effects of ECT and other treatments for suicidal behavior is crucial for developing targeted interventions and improving patient outcomes. Individual-level FPN connectivity is implicated not only in suicide-related circuits but also provides personalized targets for intervention in individual patients. While ECT is a well-established antidepressive method with rapid improvement in suicidal behavior, it affects the entire brain and is limited by safety concerns and adverse effects [44]. Non-invasive brain stimulation treatments, such as transcranial magnetic stimulation (TMS), offer an alternative treatment for depression and even suicidal behavior [45]. However, treatment response depends on selecting the precise therapeutic target or circuit. Beyond DLPFC TMS, limited evidence suggests that directly targeting the IPL could be therapeutically valuable in depressed patients with suicide ideation [46, 47]. Network-based brain stimulation in the FPN may guide future therapies to enhance the antidepressant response, especially in patients at high risk of suicide.
Identifying alterations in brain circuits that contribute to the transition from SI to SA is crucial for developing more precise and effective strategies to mitigate suicide risk. In our exploratory study, a significant difference in the FPN connectivity was observed between SA and NSS groups. However, no significant difference was found between SI and NSS. These findings indicate that changes in this specific connectivity become pronounced only during the SA period or when suicide thoughts are particularly intense, but are not sensitive enough to detect SI without an attempt or when suicide thoughts are relatively weak.
More than half of individuals with depressive disorders do not attempt suicide, and the severity of depression does not reliably predict suicide attempts [48]. Negative emotions in depressed patients may intensify suicidal ideation without directly leading to extreme suicidal acts [49]. Whether suicide is an independent symptom of mood remains uncertain. In our study, a significant correlation was observed between the BSSI and the HAMD (excluding the suicide item) scores in the SS group, suggesting a strong relationship and potential shared pathophysiology between the two symptoms. However, the low similarity of FCs underlying the BSSI and the HAMD indicated a distinct neurological basis for suicidal ideation apart from depressed mood. Nevertheless, future studies with larger datasets should address heterogeneity to identify neurological pathways to suicide and mood.
Several limitations should be considered in interpreting our findings. First, although we used longer, higher-quality scans to enhance reliability, the cohort was predominantly females, it is unclear whether these findings apply to males, and the generalizability of the findings still requires validation with an independent dataset. Second, the biomarkers were identified in depressive adult patients presenting suicide symptoms, cautioning against broad generalizations to other disorders or adolescent populations. Third, rather than solely recording the presence or absence of a suicide attempt, future studies should comprehensively assess individuals’ histories regarding suicidal thoughts, behaviors, and attempts, using standard measurement tools such as the Columbia Suicide History Form. Moreover, understanding the neurobiological mechanisms associated with the progression of suicide risk from no SI to SI and SA is critical. However, in our cohort, all the SA cases are accompanied by severe suicide ideation, it’s challenging to distinguish suicide attempts and suicidal ideation. To address this limitation, a larger cohort comprising individuals with SI and SA cases whose ideation severity matches that of SI cases is required. Psychological constructs and adverse experiences should be considered, and subcortical regions, crucial for depression and suicide, need to be included in future analyses. Finally, although the observed effects may be uniquely associated with the powerful and immediate impact of ECT, it is important to carefully consider the impact of medication changes on functional connectivity when interpreting post-treatment changes.


Responses