Superior preclinical efficacy of co-treatment with BRG1/BRM and FLT3 inhibitor against AML cells with FLT3 mutations

Introduction
The BRG1/BRM-associated factor (BAF) complexes are ATP-dependent chromatin remodeling complexes [1]. They contain the mutually exclusive, core ATPases, BRG1 (SMARCA4) and BRM (SMARCA2) [1,2,3,4]. AML stem/progenitor cells express and depend on the activity of BRG1/BRM [5,6,7], which is essential for lineage specific gene expressions. Cells with reduced BRG1 levels or BRG1 mutation depend for survival on BRM activity in the BAF complex [2, 8]. Small molecule inhibitors of the ATPase activity of BRG1 and BRM repress BRG1/BRM-dependent gene-expressions [9]. Inhibitors of BRG1/BRM induce differentiation and undermine the in vitro and in vivo growth of AML cells [7, 10, 11]. FHD-286 is a small molecule, orally bioavailable, BRG1 and BRM-selective, ATPase inhibitor, which induces differentiation and loss of viability of AML stem/progenitor cells. It is currently under clinical investigation for safety and clinical efficacy in AML (NCT04891757).
FLT3 is a class III receptor tyrosine kinase (TK) that exhibits activating, somatic, gain-of-function internal tandem duplication (ITD) and/or TK domain (TKD) mutations in approximately 25% and 8% of AML, respectively [12, 13]. Quizartinib and gilteritinib are FLT3 kinase inhibitors (FLT3-TKI), which are approved for the therapy of AML with FLT3 mutation [14, 15]. Although treatment with these FLT3-TKIs can induce clinical remissions in AML with FLT3 mutations, emergence of therapy-resistant AML stem/progenitor cells curtails durable remissions, leading to AML relapse and poor leukemia-free survival [16]. Therefore, there is a need to develop and test the efficacy of novel anti-AML agents and determine their lethal activity in combination with FLT3-TKI against AML with FLT3 mutations. In the present studies, we interrogated the in vitro and in vivo efficacy of FHD-286-based combinations with the FDA approved FLT3-TKIs quizartinib and gilteritinib. Concomitantly, we also determined the gene expressions signature of these combinations in models of AML cell lines and patient-derived AML cells harboring MLL1r or mutant (mt) NPM1 and FLT3-ITD mutation. Additionally, we determined the synergistic efficacy of FHD-286 and the FLT3-TKIs against AML cells expressing FLT3 mutations resistant to the FLT3-TKI. Findings presented demonstrate that treatment with FHD-286 induced in vitro loss of viability in AML cell lines and PD AML cells expressing MLL1r or mtNPM1 and FLT3-ITD and/or FLT3-TKD mutations. FHD-286-induced lethality in these AML cells was associated with marked perturbations in expression of FLT3 and FLT3 target genes (mRNA and protein). Taken together, our findings below highlight the promise of FHD-286-based rational combinations with the FLT3-TKI in exerting significant anti-AML efficacy against cellular models of AML stem/progenitor cells with MLL1-r or mtNPM1 and FLT3-ITD with or without FLT3-TKD mutations.
Materials and methods
Ethics approval and consent to participate
These studies were conducted in accordance with relevant guidelines and regulations and were approved by the Institutional Review Board of MD Anderson Cancer Center under protocols LAB01-473 and PA16-0468. All samples were collected and tested following approval under these protocols. Informed consent was obtained from all participants. All in vivo studies were approved by the IACUC at M.D. Anderson Cancer Center and conducted under protocol # 0000-1401.
Reagents
FHD-286 was obtained under a material transfer agreement with Foghorn Therapeutics (Cambridge, MA). Quizartinib and gilteritinib for in vitro and in vivo studies were obtained from MedChem Express (Monmouth Junction, NJ).
Cell lines
MOLM13 [DSMZ Cat# ACC-554, RRID: CVCL_2119] and OCI-AML3 [DSMZ Cat# ACC-582, RRID: CVCL_1844] cells were obtained from the DSMZ (Braunschweig, Germany). MV4-11 [ATCC Cat# CRL-9591, RRID: CVCL_0064] cells were obtained from the ATCC (Manassas, VA). MOLM13 cells with isogenic TP53 mutations [R175H and R248Q] were a gift from Dr. Benjamin L. Ebert (Dana Farber Cancer Center, Boston, MA). HEK-293T [RRID: CVCL_0063] cells were obtained from the Characterized Cell Line Core Facility at M.D. Anderson Cancer Center, Houston, TX. All experiments with cell lines were performed within 6 months after thawing or obtaining from ATCC or DSMZ. MOLM13-quizartinib resistant (QR) cells were developed through repeated shocks with 100 nM of quizartinib for 96 h followed by recovery. PCR amplification and Sanger sequencing were used to confirm the presence of the D835Y mutation in the MOLM13-QR cells. OCI-AML3 FLT3-ITD cells were generated by ectopic overexpression of a lentiviral vector containing the entire FLT3-ITD cDNA and puromycin selection. OCI-AML3-Vector contains the empty vector.
Cell line authentication
The cell lines utilized in these studies were authenticated in the Characterized Cell Line Core Facility at M.D. Anderson Cancer Center, Houston, TX utilizing STR profiling.
Assessment of percentage non-viable cells
Following designated treatments (72–96 h), cultured cell lines or patient-derived (PD) acute myeloid leukemia (AML) blast cells, were washed with 1X PBS, stained with TO-PRO-3 iodide (Cat# T3605, Life Technologies, Carlsbad, CA) and analyzed by flow cytometry in the FL4 channel.
Synergy analysis of FHD-286-based combinations
To determine whether drug combinations of FHD-286 and quizartinib or gilteritinib produced superior, synergistic lethal activity, we utilized the ZIP method within the SynergyFinder V3 online web application tool [17]. The ZIP method is an integration of the Bliss independence and the Loewe additivity models. Thus, delta scores greater than zero represent synergism [18].
Methods for sequencing of primary de novo AML blast cells, transcriptome analysis, SDS-PAGE and immunoblot analyses, proteomic profiling, single cell next-generation mass cytometry ‘CyTOF’ analysis of mtNPM1 + FLT3-ITD-expressing AML cells and the in vivo mouse models are detailed in the Supplemental Materials and Methods.
Data and software availability
MOLM13 RNA-Seq datasets were previously deposited in GEO as a Super Series under Accession ID GSE252938. OCI-AML3 and OCI-AML3-FLT3-ITD RNA-Seq data were deposited in GEO under Accession ID GSE289713. The mass spectrometry proteomics data have been deposited to the ProteomeXchange Consortium via the PRIDE partner repository with the dataset identifiers PXD055994 and PXD047967.
Results
AML cells with FLT3-ITD are dependent on FLT3 and BRG1 (SMARCA4) and are sensitive to FHD-286-mediated depletion of FLT3 and loss of viability
Previous studies have demonstrated that AML patients with FLT3-ITD with or without FLT3-TKD mutations exhibit poorer overall survival compared to patients without FLT3 mutations [19]. Figure S1A shows a Kaplan-Meier plot comparing the disease-free survival of patients with FLT3-ITD or mutant FLT3 compared to patients with wild-type FLT3 in the TCGA dataset. Notably, approximately 50% of patients with FLT3 alteration also exhibited mutations in NPM1. Furthermore, a comparison of the expression levels of FLT3 and SMARCA2 mRNA in the 173 AML samples from the TCGA data set (for which RNA-Seq analysis was available) compared to FLT3 and SMARCA2 expression in 70 normal RNA-Seq samples via the GEPIA server demonstrated significantly higher expression of FLT3 and SMARCA2 in AML cells versus normal cells (p < 0.05) (Fig. S1B) [20]. Additionally, utilizing the BEAT AML2.0 dataset [21], we determined that patients with FLT3-ITD-positive AML (N = 158) exhibited significantly higher (p < 0.001) expression of SMARCA2 and SMARCA4 mRNA than patients with FLT3-ITD-negative AML (N = 511) (Fig. S1C). We next interrogated the CRISPR-sgRNA dependency-screens (DepMap) to determine whether FLT3 and SMARCA4 are dependencies in AML cell lines with FLT3-ITD [22]. As shown in Fig. S1D, the FLT3 and SMARCA4 gene-effect scores were between 0 and –2.0, highlighting them as dependencies in FLT3-ITD expressing AML cell lines, especially those that also express an MLL1-fusion protein (FP) such as MOLM13, MOLM14, and MV4-11. We next determined that relatively low concentrations of FHD-286 induced dose dependent loss of viability in FLT3-ITD expressing MOLM13 and MV4-11 cells as well as in quizartinib-resistant MOLM13-QR cells (developed through repeated shocks with 100 nM of quizartinib), which also express a FLT3-D835Y mutation in exon 20 of FLT3 (Figs. 1A and S1E). RNA-Seq analysis in MOLM13 cells showed that treatment with FHD-286 caused log2 fold-decline in the expression of FLT3 and FLT3 target genes MYC and GADD45A but induced the expression of Cyclin D1, CEBPB and CDKN1B (p27) [16, 23] (Fig. 1B). FHD-286 treatment for 16 h also depleted FLT3 and MYC expression in MV4-11 and quizartinib-resistant MOLM13-QR cells as determined by real time qPCR analysis (Fig. S1F and S1G). To determine FHD-286-induced protein expression perturbations signature, we next conducted mass spectrometry on MOLM13 cells treated with FHD-286 for 48 h. Figure 1C shows a volcano plot of significantly decreased proteins (p < 0.05) including FLT3, c-Myc, and CBL1, with concomitant induction of p21, p27, CEBPA, HMOX1, and CTTN. Immunoblot analysis also documented a significant depletion of FLT3 protein expression and induction of p27 in the cell lysates of MV4-11, MOLM13 and MOLM13-QR cells treated with FHD-286 (20-100 nM) for 48 h (Fig S1H and S1I). We next determined the effects of treatment with FLT3 inhibitor quizartinib or gilteritinib in MV4-11, MOLM13 and MOLM13-QR cells. As shown in Fig. 1D, E, treatment with quizartinib or gilteritinib potently induced loss of viability in the MV4-11 and MOLM13 cells, whereas only higher concentrations (>20 nM) of gilteritinib induced loss of viability in the MOLM13-QR cells. We next compared the effects of quizartinib and FHD-286 treatment on the MOLM13 and MOLM13-QR cells. Immunoblot analysis following treatment with quizartinib showed increased glycosylation of FLT3 in MOLM13 but not as much in MOLM13–QR cells (Fig. 1F) [24]. This was associated with loss of STAT5 phosphorylation and depletion of c-Myc and CDK4 but induction of p27 expression. On the other hand, treatment with FHD-286 reduced the expression of FLT3, c-Myc, CDK6, CDK4, and BCL2 while inducing p27 and CD11b (a cell-surface differentiation marker) in both MOLM13 and MOLM13-QR cells (Fig. 1F).

A MOLM13, MV4-11 and quizartinib-resistant MOLM13-QR cells were treated with the indicated concentrations of FHD-286 for 96 h. Then, cells were stained with TO-PRO-3 iodide and the % non-viable cells were determined by flow cytometry. Columns, mean of three experiments, Bars, S.E.M. B Our publicly available RNA-Seq data of MOLM13 cells treated with 100 nM of FHD-286 for 16 h (as biologic replicates) were used to generate a volcano plot (log2 fold-change versus –log10 p-value) of mRNA expression changes in FLT3 and FLT3 target genes at greater than 1.25-fold up or down and p < 0.05. C. MOLM13 cells were treated with 100 nM of FHD-286 for 48 h. Cells were harvested and pellets were processed for total proteome profiling by tandem mass tag mass spectrometry. Volcano plot (log2 fold-change versus -log10 p-value) of mass spectrometry-determined protein expression changes (>1.20-fold up or down and p < 0.05) in FLT3 and FLT3 target genes in FHD-286-treated compared to control cells. D, E MOLM13, MV4-11 and quizartinib-resistant MOLM13-QR cells were treated with the indicated concentrations of quizartinib or gilteritinib for 96 h. Following this, the % non-viable cells were determined by TO-PRO-3 iodide staining and flow cytometry. Columns, mean of three experiments, Bars, S.E.M. F. MOLM13 and MOLM13-QR cells were treated with the indicated concentration of quizartinib for 24 h or FHD-286 for 48 h. Following this, cells were harvested and total cell lysates were prepared. Immunoblot analyses were conducted on the total cell lysates. The expression levels of GAPDH in the cell lysates served as the loading control. Representative immunoblots from two experiments are shown.
Co-treatment with FHD-286 and quizartinib or gilteritinib induced synergistic loss of viability in AML with FLT3-ITD with or without TP53 mutation, and FHD-286 pretreatment overcame resistance to FLT3 inhibitor in MOLM13-QR cells
We next determined the in vitro lethal activity of co-treatment with FHD-286 and quizartinib or gilteritinib against AML cells with FLT3-ITD. Combined treatment with FHD-286 and quizartinib or gilteritinib induced synergistic lethality in MV4-11 and MOLM13 cells, with delta synergy scores of over 20 by the ZIP method (Figs. 2A and S2A–S2D). This was associated with greater depletion of STAT5, AKT, CDK4/6 and cleavage of p27 but induction of HMOX1 in MOLM13 cells (Fig. 2B). Combined treatment with FHD-286 and quizartinib or gilteritinib was also synergistically lethal in MOLM13-QR cells and in MOLM13 cells expressing hotspot TP53 mutations with delta synergy scores greater than 7 by the ZIP method (Figs. 2C and S2E–S2J). To determine FHD-286-mediated protein alterations that may play a role in overcoming resistance to FLT3 inhibitor treatment in the quizartinib-resistant cells, we exposed MOLM13-QR cells to increasing doses of FHD-286 for 96 h and performed immunoblot analyses on their total cell lysates. As shown in Fig. 2D, treatment with increasing concentrations of FHD-286 caused marked depletion of FLT3, MYC, CDK4, CDK6 and BCL2 proteins, with concomitant induction of CD11b and to a lesser extent of p27. We next determined whether pre-treatment with 30 nM of FHD-286 for 96 h would overcome resistance to FLT3-TKI in MOLM13-QR cells with expression of FLT3-ITD and FLT3-D835Y. Figure 2E, F demonstrate that compared to treatment with quizartinib or gilteritinib alone, pre-treatment with FHD-286 for 96 h significantly (p < 0.05) restored sensitivity of MOLM13-QR cells to quizartinib and enhanced their sensitivity to clinically relevant doses of gilteritinib, especially at the lower concentrations.
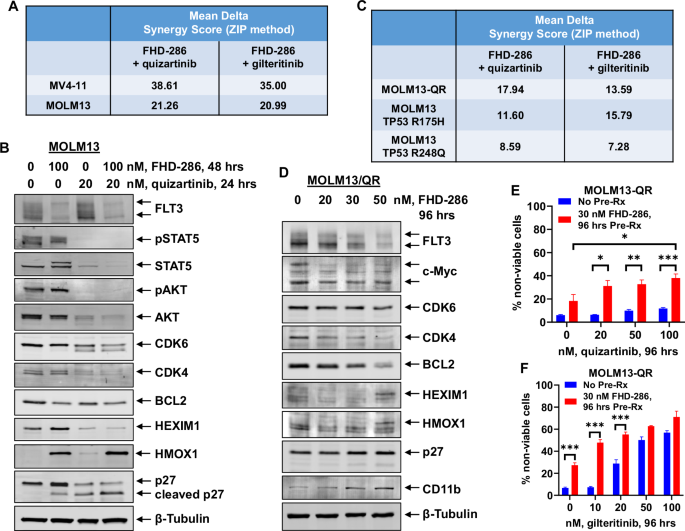
A MV4-11 and MOLM13 cells were treated with FHD-286 (dose range: 10 nM–50 nM) and quizartinib (dose range: 0.5-10 nM), or gilteritinib (dose range: 2 nM–20 nM) for 96 h. At the end of treatment, the % non-viable cells were determined by staining with TO-PRO-3 iodide and flow cytometry analysis. Delta synergy scores were determined by the ZIP method within the SynergyFinder web application. Synergy scores >1.0 indicate a synergistic interaction of the two agents in the combination. Mean Delta Synergy scores for each combination are shown. B MOLM13 cells were treated with the indicated concentrations of FHD-286 and/or quizartinib for 24–48 h. At the end of treatment, total cell lysates were harvested and immunoblot analyses were conducted. The expression levels of β-Tubulin in the cell lysates served as the loading control. Representative immunoblots from two experiments are shown. C MOLM13-QR (FLT3-D835Y), MOLM13 TP53-R175H, and MOLM13 TP53-R248Q cells were treated with FHD-286 (dose range: 10 nM to 50 nM) and quizartinib (dose range: 0.5–50 nM), or gilteritinib (dose range: 2 nM–20 nM) for 96 h. At the end of treatment, the % non-viable cells were determined by staining with TO-PRO-3 iodide and flow cytometry analysis. Delta synergy scores were determined by the ZIP method within the SynergyFinder web application. Synergy scores >1.0 indicate a synergistic interaction of the two agents in the combination. Mean Delta Synergy scores for each combination are shown. D MOLM13-QR cells were treated with the indicated concentrations of FHD-286 for 96 h. Following this, total cell lysates were prepared and immunoblot analyses were conducted. The expression levels of β-Tubulin in the cell lysates served as the loading control. Representative immunoblots from two experiments are shown. E, F MOLM13-QR cells were treated with or without 30 nM of FHD-286 for 96 h, followed by treatment with the indicated concentrations of quizartinib or gilteritinib for 96 h. Cells were then stained with TO-PRO-3 iodide and the % non-viable cells were determined by flow cytometry. Columns, mean of three experiments, Bars, S.E.M. *=p < 0.05; **=p < 0.01; ***=p < 0.005 compared to cells with no FHD-286 pretreatment.
Co-treatment with FHD-286 and quizartinib or gilteritinib induced synergistic loss of viability in AML with co-expression of mutant NPM1 and FLT3-ITD
In AML with mutant NPM1, co-mutation with a FLT3-ITD occurs in over 50% of patients resulting in significantly worse prognosis compared to patients without FLT3 alteration [25]. To determine the effect on the transcriptome in AML cells due to the presence of mutant NPM1 and the response to FHD-286 and/or FLT3 inhibitors, we used lentiviral transduction to overexpress FLT3-ITD under the control of an EF‐1α promoter in OCI-AML3 cells. Gene set enrichment analysis (GSEA) applied to the RNA-Seq-determined perturbations revealed that FLT3-ITD expression in OCI-AML3 cells caused positive enrichment of HALLMARK gene-sets of interferon response, inflammatory response, KRAS signaling, and Hedgehog signaling (Fig. 3A). Transduction and increased FLT3-ITD expression in OCI-AML3 cells caused significant log2 fold-increase in mRNA expressions of PIM1, BCL2, FYN, WT1, VEGFA, GRB10, CEBPB, EGR1, DPYSL3 and CPXM1 while simultaneously decreasing HSP70, HSPA5, CCND1, LYZ, and BCL2L11 (Fig. 3B). Treatment with FHD-286 in OCI-AML3-FLT3-ITD cells caused negative enrichment of the mRNA gene-sets of MYC targets, inflammatory response, mTORC1 signaling, IFNγ-response, protein translation, and regulation of FLT3 (Fig. 3C). Specifically, FHD-286 treatment caused log2 fold-decline in MYC, MYB, SPI1, BCL2, IRF8, IL7R, MEF2D, CPXM1, CD44, and CSF1R but increase in the mRNA expressions of CFLAR, CTTN, CDKN2B, CASP8, HMOX1, HEXIM1, and CDKN1A (Fig. 3D). Immunoblot analyses showed that treatment with FHD-286 for 48 h depleted protein levels of FLT3-ITD and BCL2 with concomitant increase in p21 and p27 levels in OCI-AML3-FLT3-ITD and OCI-AML3-vector cells (Fig. 3E). Exposure to FHD-286 for 96 h induced loss of viability in a dose-dependent manner in OCI-AML3-FLT3-ITD cells which was not different from its effects observed in OCI-AML3 cells, as previously reported (Fig. 3F) [11]. Gilteritinib treatment inhibited the levels of phosphorylated FLT3 as well as increased FLT3 glycosylation in OCI-AML3-FLT3-ITD versus OCI-AML3-vector cells (Fig. S3A), while both gilteritinib and quizartinib only slightly increased the loss of viability in OCI-AML3-FLT3-ITD cells (Figs. S3B and S3C). Notably, co-treatment with FHD-286 and quizartinib or gilteritinib induced synergistic loss of viability of the OCI-AML3-FLT3-ITD cells (Figs. 3G and S3B-S3C). Co-treatment with FHD-286 and gilteritinib was associated with depletion of p-FLT3 (Y591), p-AKT, AKT, CDK4/6 and BCL2 with concomitant induction of HMOX1, p27, p21 and HEXIM1 in the OCI-AML3-FLT3-ITD cells (Fig. S3D).
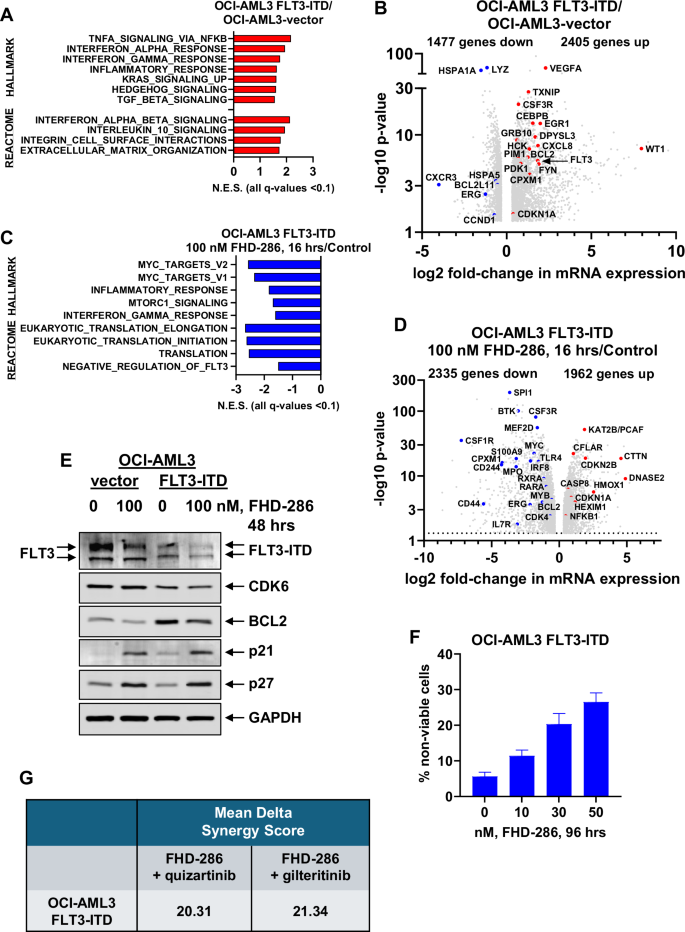
A–D OCI-AML3-FLT3-ITD cells were treated with or without 100 nM of FHD-286 for 16 h in biologic duplicates. Total RNA was isolated and utilized for RNA-Seq analysis. A Gene set enrichment analysis of OCI-AML3-FLT3-ITD-expressing cells over OCI-AML3-vector cells compared to HALLMARK and REACTOME pathways. Normalized enrichment scores are shown. All q-values are <0.1. B Volcano plot (log2 fold-change versus –log10 p value) of RNA-Seq-determined mRNA expression changes (greater than 1.25-fold up or down and p < 0.05) in OCI-AML3-FLT3-ITD cells over OCI-AML3-vector cells. C Gene set enrichment analysis of FHD-286-treated OCI-AML3-FLT3-ITD cells compared to HALLMARK and REACTOME pathways. Normalized enrichment scores are shown. All q-values are <0.1. D Volcano plot (log2 fold-change versus –log10 p-value) of RNA-Seq-determined mRNA expression changes (greater than 1.25-fold up or down and p < 0.05) in FHD-286-treated OCI-AML3-FLT3-ITD cells compared to untreated OCI-AML3-FLT3-ITD cells. E OCI-AML3-vector and OCI-AML3-FLT3-ITD cells were treated with the indicated concentrations of FHD-286 for 48 h. At the end of treatment, total cell lysates were prepared and immunoblot analyses were conducted. The expression levels of GAPDH in the cell lysates served as the loading control. F OCI-AML3-FLT3-ITD cells were treated with the indicated concentrations of FHD-286 for 96 h. Following this, the % non-viable cells were determined by TO-PRO-3 iodide staining and flow cytometry. Columns, mean of three experiments, Bars, S.E.M. G OCI-AML3-FLT3-ITD cells were treated with FHD-286 (dose range: 10 nM–50 nM) and quizartinib (dose range: 10–100 nM), or gilteritinib (dose range: 10 nM–50 nM) for 96 h. At the end of treatment, the % non-viable cells were determined by staining with TO-PRO-3 iodide and flow cytometry analysis. Delta synergy scores were determined by the ZIP method within the SynergyFinder web application. Synergy scores >1.0 indicate a synergistic interaction of the two agents in the combination. Mean Delta Synergy scores for each combination are shown.
Co-treatment with FHD-286 and quizartinib or gilteritinib induced synergistic loss of viability in patient-derived (PD) AML cells with co-expression of mutant NPM1 and FLT3-ITD
We next determined the effects of treatment with FHD-286 against primary, patient-derived (PD) acute myeloid leukemia (AML) cells with expression of FLT3-ITD. Immunoblot analyses on cell lysates of AML cells from 4 patients, three harboring FLT3-ITD, confirmed that FLT3 protein is expressed, albeit at disparate levels, in these PD AML cells (Fig. 4A). Mass spectrometry analysis on PD AML cells harboring mutant NPM1 + FLT3-ITD AML showed that treatment with FHD-286 depleted the expressions of FLT3, MYC, CBL, STAT5A, SPI1, CXCR4 and CEBPA but induced p21 and p27 expressions in the cell lysates of these cells (Fig. 4B). Utilizing cocktails of rare-metal element-tagged antibodies, we next performed CyTOF analyses on PD AML cells with mtNPM1 and FLT3-ITD. Figure 4C shows that, in the phenotypically defined AML stem/progenitor cells (high expression of CLEC12A, CD123, CD99, and CD33 but low expression of CD11b), compared to the untreated controls, FHD-286 treatment depleted the protein expressions PU.1, c-Myc, FLT3, CDK6, HOXA9, RUNX1, and MCL1, but increased expressions of p-H2AX. We also determined the lethal effects of treatment with gilteritinib or FHD-286 in 4 samples of patient-derived (PD) AML with mutant NPM1 and FLT3-ITD with or without FLT3-TKD mutations. Although the response of each primary sample to gilteritinib was variable, all samples responded to treatment with FHD-286 in a near dose-dependent manner (Fig. 4D). We next determined the in vitro lethal activity of co-treatment with FHD-286 and quizartinib or gilteritinib in PD AML cells with mtNPM1 and FLT3-ITD with a FLT3-TKD mutation. Combined treatment with FHD-286 and FLT3-TKI induced synergistic lethality in PD AML samples with mtNPM1 and FLT3-ITD with or without D835Y or F691L FLT3-TKD mutations, showing delta synergy scores of over 2.0 by the ZIP method (Figs. 4E and S4A). In contrast, co-treatment with FHD-286 and quizartinib or gilteritinib exhibited minimal lethal activity (<10% non-viable cells) against normal CD34+ hematopoietic progenitor cells (Fig. S4B).
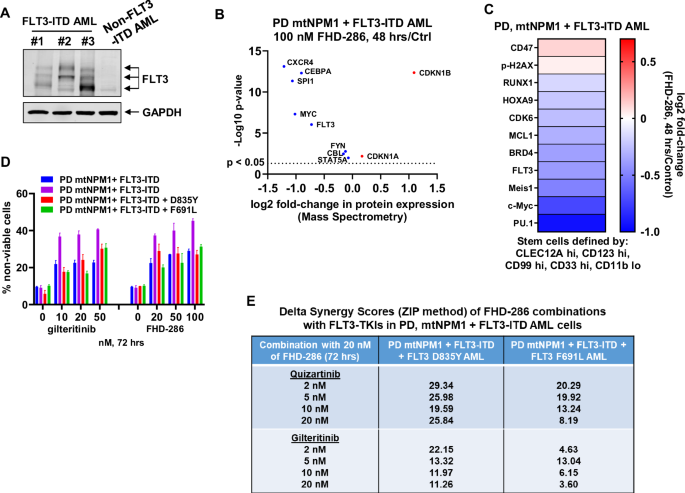
A Immunoblot analysis of FLT3 expression in three patient-derived AML samples with FLT3-ITD and one non-FLT3-ITD AML sample showing variation in FLT3 expression. The expression levels of GAPDH in the cell lysates served as the loading control. B PD mtNPM1 + FLT3-ITD AML cells were treated with 100 nM of FHD-286 for 48 h. Cells were harvested and pellets were processed for total proteome profiling by tandem mass tag mass spectrometry. Volcano plot (log2 fold-change versus -log10 p-value) of mass spectrometry-determined protein expression changes in FLT3 and FLT3 target genes in FHD-286-treated compared to control cells (fold change >0 or <0 and p < 0.05). C Patient-derived mtNPM1 + FLT3-ITD AML cells were treated with 100 nM of FHD-286 for 48 h. CyTOF analysis was conducted utilizing cocktails of rare metal element-tagged antibodies. The heat map shows the log2 fold-change (FHD-286-treated over Control) of depleted and induced proteins in phenotypically defined AML stem/progenitor cells (CLEC12A hi, CD123 hi, CD99 hi, CD33 hi and CD11b low). D Four patient-derived AML samples with mtNPM1 + FLT3-ITD and/or additional FLT3 mutation were treated with the indicated concentrations of gilteritinib or FHD-286 (in duplicate) for 72 h. At the end of treatment, cells were stained with TO-PRO-3 iodide and the % non-viable cells were determined by flow cytometry. E Patient-derived AML cells with mtNPM1 + FLT3-ITD with or without FLT3-TKD or gatekeeper (F691L) mutation were treated with FHD-286 (dose range: 20 nM–50 nM) and quizartinib (dose range: 0.5–2.0 nM), or gilteritinib (dose range: 5 nM–20 nM) for 72 h. At the end of treatment, the % non-viable cells were determined by staining with TO-PRO-3 iodide and flow cytometry analysis. Delta synergy scores were determined by the ZIP method within the SynergyFinder web application. Synergy scores >1.0 indicate a synergistic interaction of the two agents in the combination. Delta Synergy scores for each combination are shown.
Superior efficacy of combined therapy with FHD-286 with quizartinib or gilteritinib in xenograft and PDX models of AML with mtNPM1, FLT3-ITD and FLT3 D835Y
Next, we evaluated the pre-clinical in vivo efficacy of FHD-286-based combinations in the cell line xenograft and PDX models of AML with mtNPM1, FLT3-ITD and FLT3 D835Y. Following tail vein infusion and engraftment of luciferase-transduced MOLM13-QR (FLT3-D835Y) or PD AML cells with mtNPM1, FLT3-ITD and FLT3-D835Y, cohorts of NSG mice were treated with vehicle control or previously determined safe doses of the drugs, i.e., FHD-286 and/or quizartinib or gilteritinib. Notably, Fig. 5A–C demonstrate that, compared to treatment with vehicle control, monotherapy with FHD-286, quizartinib or gilteritinib, significantly reduced the AML burden as well as improved the survival of the NSG mice engrafted with MOLM13-QR-Luc/GFP cells. Importantly, as compared to treatment with each drug alone, co-treatment with FHD-286 and gilteritinib was significantly more effective in reducing the AML burden and improving the survival of the NSG mice (Fig. 5A–C). Furthermore, in the PDX model of luciferized mtNPM1 + FLT3-ITD + FLT3-D835Y AML cells (harboring co-mutations shown in Table S1), Fig. 6A–C demonstrate that compared to vehicle control, treatment with FHD-286 or gilteritinib alone reduced the AML burden and improved the survival of the NSG mice. Importantly, compared to monotherapy with each drug, co-treatment with FHD-286 and gilteritinib was significantly superior in reducing the leukemia burden and further improved the survival of the mice (p < 0.01).
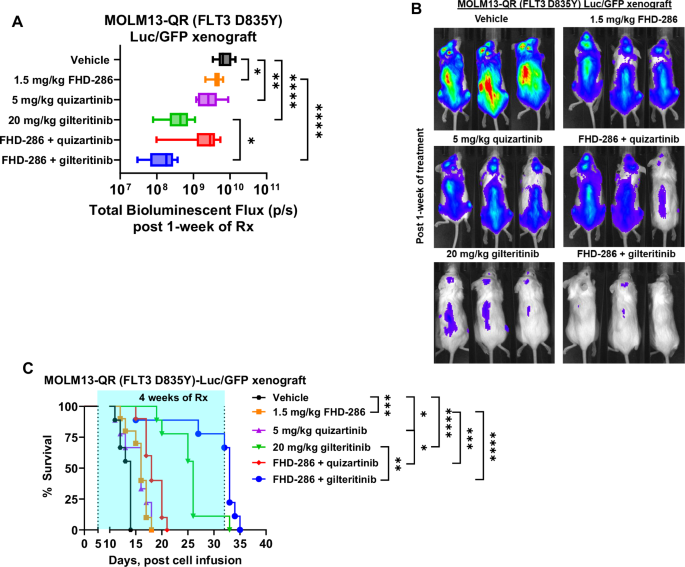
A Total photon counts [flux] (determined by bioluminescent imaging) in NSG mice engrafted with luciferized MOLM13-QR cells and treated for 1 week with FHD-286 and/or quizartinib or gilteritinib at the indicated doses. *=p < 0.05; **=p < 0.01; ****=p < 0.001. B Representative bioluminescent images of mice from panel (A). C Kaplan-Meier survival plot of NSG mice engrafted with luciferized MOLM13-QR cells and treated with 1.5 mg/kg of FHD-286 (daily x 5 days, P.O.) and/or 5 mg/kg of quizartinib (daily x 5 days, P.O.) or 20 mg/kg of gilteritinib (daily x 5 days, P.O.) for 4 weeks. Significance between cohorts was determined by a Mantel-Cox log-rank test. *=p < 0.05; **=p < 0.01; ***=p < 0.005; ****=p < 0.001.
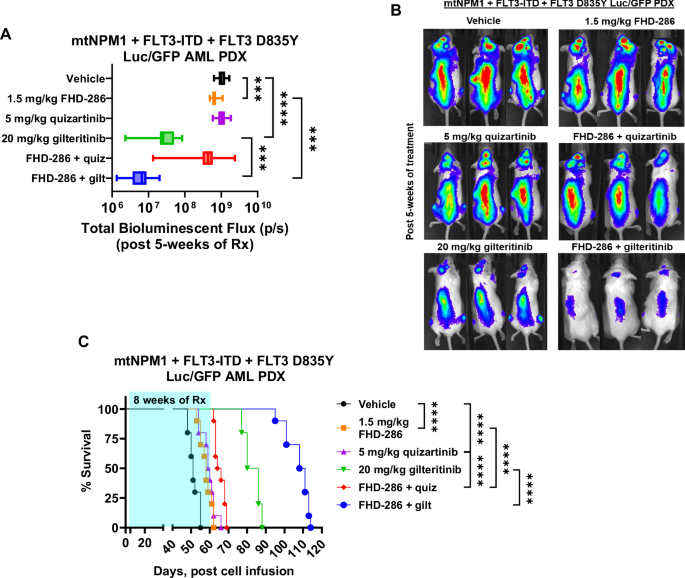
A Total photon counts [flux] (determined by bioluminescent imaging) in NSG mice engrafted with luciferized mtNPM1 + FLT3-ITD + FLT3-D835Y AML PDX cells and treated for 5 weeks with FHD-286 and/or quizartinib or gilteritinib at the indicated doses. ***=p < 0.005; ****=p < 0.001. B Representative bioluminescent images of mice from panel (A). C Kaplan-Meier survival plot of NSG mice engrafted with luciferized mtNPM1 + FLT3-ITD + FLT3-D835Y AML PDX cells and treated with 1.5 mg/kg of FHD-286 (daily x 5 days, P.O.) and/or 5 mg/kg of quizartinib (daily x 5 days, P.O.) or 20 mg/kg of gilteritinib (daily x 5 days, P.O.) for 8 weeks. Significance between cohorts was determined by a Mantel-Cox log-rank test. ****=p < 0.001.
Discussion
Targeting the chromatin remodeler ATPases BRG1/BRM (SMARCA4/2) has been reported to exert lethal activity against AML stem/progenitor cells, whereas treatment with the FLT3-TKI is effective against AML cells with FLT3-ITD and/or FLT3-TKD [7, 11, 13, 15, 16]. In the present studies, we demonstrated that, while monotherapy with FHD-286 dose-dependently induced in vitro loss of viability, co-treatment with FHD-286 and FDA-registered FLT3 antagonists quizartinib or gilteritinib was synergistically lethal against AML cells with MLL1r or mtNPM1 exhibiting FLT3-ITD expression, including those with additional FLT3-TKD mutations. Notably, co-treatment with FHD-286 and gilteritinib was effective against quizartinib-resistant AML cells, as well as against AML cells harboring TP53-R175H or R248Q mutation [26]. Furthermore, co-treatment with FHD-286 with gilteritinib reduced in vivo AML burden and improved survival of mice engrafted with AML with MLL1-r or mtNPM1 and FLT3-ITD with or without FLT3-TKD mutations.
By inhibiting chromatin remodeler ATPases, FHD-286 transcriptionally reduced FLT3 levels, which was associated with reduced BCL2, c-Myc and CDK4/6 levels, but increased HEXIM1, HMOX1, p27 and CD11b levels in the AML cells expressing FLT3-ITD. Collectively, these effects resulted in loss of viability of the AML cells, including those resistant to quizartinib. Additionally, due to these FHD-286-mediated effects, pre-treatment with FHD-286 sensitized and increased the lethal activity of quizartinib or gilteritinib. Simultaneous treatment with FHD-286 and FLT3-TKI was also synergistically lethal against AML cells with FLT3-ITD, including those resistant to quizartinib. The sensitizing effects of FHD-286 co-treatment may be mediated by reduced STAT5, pSTAT5 and AKT levels observed following combined treatment with FHD-286 and quizartinib in the AML cells [16, 27]. Notably, in the AML OCI-AML3 cells transduced with FLT3-ITD, again FHD-286 exerted lethal effects and co-treatment with FHD-286 and quizartinib or gilteritinib was synergistically lethal. This is likely due to FHD-mediated reduction in FLT3-ITD, BCL2 and CDK6, but upregulation of p21 and p27 levels in the OCI-AML3-FLT3-ITD cells. Therefore, the overall greater lethality due to co-treatment with FHD-286 and FLT3-TKI is likely due to broader inhibitory effects on the regulators of growth and survival signaling, e.g., FLT3, c-Myc, CDK4/6 and BCL2, mediated by the combination, as above.
TP53 mutations with or without monoallelic loss of the chromosome 17p occur in 5 to 10% of AML patients including those with FLT3 or NPM1 mutation [28, 29]. The presence of TP53 mutations confers resistance to anti-AML agents, especially DNA damaging agents [29]. Our preclinical findings presented here highlight a novel, potentially effective therapy against AML cells with FLT3-ITD and TP53 mutation. Co-treatment with the SMARCA4/2 inhibitor FHD-286 and FLT3-TKI retained the ability to induce loss of viability in the therapy refractory AML cells with FLT3-ITD and TP53 mutation. Moreover, this co-treatment was synergistically lethal against FLT3-ITD-positive AML cells with or without TP53 mutation. Collectively, these findings indicate that targeting stem/progenitor cells by a SMARCA4/2 inhibitor combined with a FLT3-TKI is an effective treatment option for overcoming not only FLT3-TKI resistance but also therapy resistance caused by TP53 mutations in FLT3-ITD-positive AML cells.
Our previous preclinical studies had highlighted that the combinations of FHD-286 and the conventional anti-AML agents, e.g., decitabine or venetoclax, or novel anti-AML agents, e.g., BET or Menin inhibitor, exerted superior in vitro efficacy. These combinations also reduced in vivo AML burden and improved mouse survival in the PDX models of AML. Collectively these pre-clinical data had suggested that these FHD-286-based combinations could potentially improve the therapeutic outcomes in AML patients. Results of our present studies further expand the scope of the benefit of FHD-286-based combinations that include FLT3-TKI, especially gilteritinib, against AML cells expressing FLT3-ITD and FLT3-TKD mutations, thereby expanding the repertoire of AML subtypes in which FHD-286 could be further evaluated clinically. Thus, our data support the clinical testing of FHD-286-based combination therapies for AML with MLL1-r or mtNPM1 and FLT3-ITD or other FLT3 mutation(s) in the de novo, relapsed or MRD setting.


Responses