POT, an optogenetics-based endogenous protein degradation system

Introduction
Precise regulation of cellular protein abundances is important for maintaining normal cell functions, and whose dysfunction is prone to diverse diseases in human. In cells, the stability of protein abundance is achieved through a dynamic equilibrium of continuous protein synthesis and degradation. Therefore, intervention of protein abundance has become an important approach to treat various diseases. The CRISPR/Cas9-based genome editing technology and RNAi, which manipulate protein expression at the mRNA level, normally exhibit drawbacks such as time-consuming procedures and susceptibility to compensatory effects and are not applicable to proteins with abnormal post-translational modifications. In contrast, controlling protein degradation can be a valuable approach for regulation of protein abundance. Currently, various strategies have been developed for protein degradation. One approach involves the recruitment of target protein to an E3 ubiquitin ligase using molecular glue1, which facilitates subsequent degradation. Alternatively, the proteolysis-targeting chimeras (PROTACs) method utilizes two ligands to recruit the target protein and E3 ligase separately 2, effectively inducing protein degradation. Additionally, the Trim-Away system utilizes the endogenous Fc receptor E3 ligase TRIM21 and antibodies targeting the protein of interests (POIs) for subsequent degradation3,4. These approaches are specifically designed for degradation of endogenous, unmodified proteins. However, they are not allowed for accurate control, and the instability of dosages can easily lead to inadequate treatment or induce unwanted side effect5. Therefore, it is beneficial for these tools to be subject to precise external control through specific stimulus.
Indeed, the advances in photopharmacology and optogenetics have facilitated the regulation of protein abundance in the cell. Recently, photopharmacology has been employed to equip traditional PROTACs with light control properties. One strategy utilizes a photocleavable protecting group (PPG) to shield the pharmacophore which can be the ubiquitin ligase, the linker, or the ligand targeting POIs. These compounds are also known as caging or photocaging6,7,8. Photocaged compounds are relatively easy to design because the structure of the active form is usually known. However, these compounds are irreversible and may form toxic byproducts in cells. The other strategy involves incorporating reversible light switches into the molecule9,10. Photoswitchable compounds can induce target degradation in one state of the switch but be inactivated in another state. These compounds have no potential toxic byproducts, and the activation is reversible, providing a more favorable approach. However, the strict molecular structure requirements are the challenge for the light-inducible protein degradation system11. In addition, both photocaging and photoswitchable PROTACs are difficult in selecting appropriate protein ligands and have inevitable issues such as low solubility and membrane permeability.
Optogenetics-based engineering of photoreceptors has been applied to control protein abundance in cells. The common strategy utilizes the light oxygen voltage domain 2 (LOV2) of the plant phototropins to emulate a photocaging-like effect12,13,14,15,16,17. Typically, these tools consist of POIs fused with a degradation sequence (also known as degron) together with the light-sensitive LOV2 domain. Upon light stimulation, the degron is exposed due to the unfolding of the C-terminal helix of LOV2, thereby initiating the degradation of the POIs. These tools enable rapid protein degradation, but they are only applicable to modified proteins, specifically, those that have been either exogenously expressed or endogenous protein modified through genetic editing. In tackling with this challenge, studies have employed nanobodies to specifically target unmodified POIs. The nanobodies are fused with specific domains to induce protein degradation, including ligands that enrich E3 ubiquitin ligases18, or directly fused with E3 ligases19. One example is the OptoTrim-Away system that derived from Trim-Away19, which has successfully employed to induce GFP-fused POIs degradation by using an anti-GFP nanobody (vhhGFP4). Recently, the RedΔTrim-TPD20 was developed to induce red light-mediated endogenous protein degradation. These designs all rely on expressed nanobodies to target POIs, while screening and validating the appropriate nanobodies are known to be tedious and costly endeavors. Therefore, it is crucial to design an optogenetics-based protein degradation system that targets endogenous, unmodified proteins but without laborious screening of the targeting sequences.
Here, we designed a peptide-mediated optogenetically controlled protein degradation system, namely Peptide-mediated OptoTrim-Away (POT) (Fig. 1a). The POT system utilizes TRIM21 participated protein degradation module and employs well-validated peptides for in vivo recognition of the POIs. We chose phosphoinositide 3-kinase (PI3K) 110α and glutathione peroxidase 4 (GPX4) as targets for their functions in cells have been well characterized, and both of them have no specific nanobodies available. The inter-SH2 (iSH2) region of the p85α regulatory subunit of PI3K21 and the 96-133 amino acid domain of the FUN14 domain containing 1 (FUNDC1)22 were selected as the ‘baits’ for effectively targeting the endogenous PI3K 110α and GPX4. Our live-cell imaging and biochemical experiments validated the functionality of these novel tools for light-induced endogenous protein degradation and their induced cellular phenotypes. We anticipate that the POT-derived system offers an alternative solution for rapid manipulation of endogenous protein levels, which has the potential to be used to dissect complex signaling pathways in cells or for targeted cellular therapies.

a Schematic of the POT system. An N-terminal peptide was used to target the specific protein of interests. Blue light illumination promotes the CRY2olig oligomerization, which induces the TRIM21-mediated protein degradation. Of note, the protein icons used in the figure are symbolic only and do not represent the actual size of the proteins. b, c COS-7 cells expressing POT or control plasmid (POTΔTRIM) were stimulated with different intensities of 488 nm laser (10 s every 1 min). The cells were imaged by confocal microscope (b) and mCherry fluorescence was quantified (c). Cells were stimulated with different intensity of 488 nm laser (10 s every 1 min). n = 29, 18, 33, 18 cells for groups in POTΔTRIM, 0.5 mW/cm2, 1 mW/cm2 and 2 mW/cm2, respectively. Scale bars: 10 μm. d Immunofluorescence images of COS-7 cells expressing POT-PI3K (red), before and 2 hours after illumination with blue light LED array (470 ± 10 nm; 1 mW/cm2, 1 s every 6 s). Cells were fixed and immune-stained with antibodies against PI3K 110α (green). (R)-MG132 was used to abolish protein degradation during immunofluorescence. Scale bars, 10 μm for full cell images and 1 μm for magnified images. e Intensity profile of PI3K 110α and POT-PI3K along the white lines on magnified images in (d). f Pearson’s correlation coefficient for POT-PI3K with PI3K 110α (n = 17 cells). All data were presented as mean ± SEM. Statistical significance is based on two-tailed Student’s t-test and is represented with labels, ns (P > 0.05), **** (P ≤ 0.0001).
Results
Development of an optogenetics-based toolbox for light-induced endogenous protein degradation
In order to downregulate endogenous protein in a light controllable manner, we developed a toolbox named POT. Recent studies showed that homodimerization of the RING domain in the TRIM21 protein is a crucial factor for activation of TRIM21 and induces degradation of TRIM21 as well as the substrate it is bound to19,23. Thus, we utilized a photoreceptor capable of light-induced oligomerization. Cryptochrome 2 (CRY2) is a plant photoreceptor known for its light-induced heterodimerization properties24 and weak oligomerization25. The CRY2 has been engineered into other variants (e.g., CRY2olig and CRY2clust) for enhanced light-induced oligomerization26,27, making it applicable here for driving the activation of TRIM21. Next, peptide was fused with CRY2olig and TRIM21 to target the POIs. The light-induced oligomerization of CRY2olig would trigger TRIM21-mediated ubiquitin-related protein degradation pathway23. Referring to a previous study19, we designed two constructs: peptide-mCherry-CRY2olig-TRIM21 and TRIM21-mCherry-CRY2clust-peptide. The former demonstrated more efficient cluster formation under our experimental conditions (Fig. S1) and was therefore selected as the POT construct for subsequent studies (as illustrated in Fig. 1a). The degradation efficiency of POT can be assessed by the co-expressed mCherry signals. Upon illuminating the POT transfected cells with 488 nm light (10 s every 1 min, 1 mW/cm2), we observed the formation of mCherry labeled POT clusters within 5 min (Fig. 1b). Cells expressing POTΔTRIM (POT lacking TRIM21 domain) served as control. With sustained blue light illumination, the reduction of the mCherry clusters was observed, while the mCherry signals in the POTΔTRIM group were unaffected (Fig. 1b & Supplementary movies 1-2). We quantified the light-induced protein degradation by quantitatively analyzed the fluorescent mCherry signals. After photobleaching correction using the bleaching curve (Fig. S2)28, we found that mCherry signals reduced to 50.56 ± 5.35% within 2 h, while the POTΔTRIM group was intact (Fig. 1c). Our experiments further optimized the light intensity to effectively activate the POT system. Illumination with 488 nm light at 1 mW/cm2 (10 s every 1 min) resulted in stronger protein degradation compared to 0.5 mW/cm2 (Fig. 1c). Since no enhancement in degradation was observed at 2 mW/cm2 conditions, we concluded that 1 mW/cm2 was sufficient and used it in subsequent experiments. Collectively, these results demonstrated POT as a robust blue light-induced protein degradation tool.
Next, we tested whether the POT system would induce the degradation of its endogenous binding proteins in cells. To validate this, we chose PI3K 110α, which has been found to be overexpressed in numerous cancers. Based on our previous study 21, the inter-SH2 (iSH2) region of the p85α regulatory subunit could be used as “bait” to target PI3K 110α in POT-PI3K. Our immunofluorescence staining results showed that after blue light activation (1 mW/cm2, 1 s light exposure per 6 s for 2 h), the endogenous PI3K 110α formed discrete clusters, and its colocalization with mCherry labeled POT-PI3K was significantly increased as quantified by Pearson’s correlation coefficient (PCC) (0.38 ± 0.03 in dark vs 0.76 ± 0.01 with light) (Fig. 1d-f). This observation suggested that iSH2 was able to target endogenous PI3K 110α. Subsequently, the cells were illuminated with custom-developed blue light LED array 29,30 (470 ± 10 nm; 1 mW/cm2,1 s light exposure per 6 s for 4 h), and the biochemical results showed that POT-PI3K induced 43.27 ± 8.59% reduction of endogenous PI3K 110α protein levels compared to the control cells expressing the empty vector pLenti-EF1a (Fig. 2a-b). Blue light also induced 55.01 ± 7.24% reduction of mCherry-labeled POT-PI3K compared to the dark condition (Fig. 2c), which further suggests the functionality of POT in regulating protein degradation. Of note, in cells expressing POTΔTRIM plasmid and empty vector, blue light stimulation had no effect in protein content (Fig. 2b, d), which demonstrated a crucial role of TRIM21 activation in blue light-induced protein degradation.
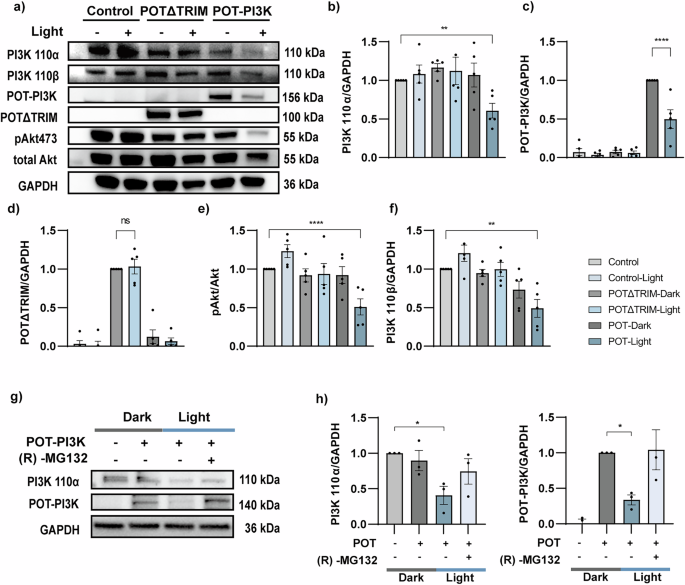
a A549 cells expressing pLenti-EF1a (empty vector), POTΔTRIM or POT-PI3K were illuminated with or without blue light LED array (1 s every 6 s, 1 mW/cm2) for 4 h before immunoblotting. All groups were pretreated with cycloheximide (CHX; 10 μg/ml) for 2 h before experiments. b–f The normalized densitometric of proteins over GAPDH ratio and pAkt473 over Akt ratio (e) in five independent experiments. g COS-7 cells expressing POT-PI3K were illuminated with or without blue LED array (1 s every 6 s, 1 mW/cm2) and treated with (R)-MG132 for 4 h before immunoblotting. h The normalized densitometric PI3K 110α (left) and POT-PI3K (right) over GAPDH ratio in three independent experiments. All data were presented as mean ± SEM. Statistical significance is based on One-way ANOVA tests and is represented with labels, ns (P > 0.05), *(P ≤ 0.05), **(P ≤ 0.01), ****(P ≤ 0.0001).
To further study the functionality of POT-PI3K module and its induced effect in downstream signaling, we examined Akt phosphorylation on serine 473 (pAkt473) by biochemical assay (Fig. 2a, e). The POT-induced PI3K degradation significantly reduced the ratio between pAkt473 and total Akt, whereas the POT-PI3K expressing cells kept in dark showed no effect (Fig. 2e). Given that iSH2 has high affinity for proteins with the phosphoinositide 3-kinase adaptor-binding domain (ABD), we hypothesized that POT-PI3K might act as a multi-target degradation tool within the PI3K family, which are commonly ABD-containing proteins31. To test that, we examined PI3K 110β level. Similar to PI3K 110α, we found that POT-PI3K was able to significantly reduce the endogenous PI3K 110β content (Fig. 2a, f), supporting that POT-PI3K targets multiple PI3K family members. In addition, the POT-PI3K-induced protein degradation was totally abolished (Fig. 2g-h) after treatment with proteasome inhibitor (R)-MG132, confirming that POT-induced protein degradation was exerted through the proteasome-mediated pathway. In summary, these results confirm that POT accomplishes light-induced degradation of endogenous proteins through the TRIM21-mediated proteasomal pathway.
Light dose-dependent and reversibility of POT-based endogenous protein degradation
Next, we investigated the light dose-dependent activation of POT system for controlled protein degradation. COS-7 cells expressing POT-PI3K were illuminated with 488 nm light (5 mW/cm2, 100 ms per 1 min) by fluorescence recovery after photobleaching (FRAP). The light-stimulated area was within the marked Cell 1 with a circle at the diameter of 4 pixels (~0.6 μm) (Fig. 3a & Supplementary movie 3). After 5 min of stimulation, light-induced clusters were observed in Cell 1. The labeled Cell 2 which was in close proximity to the stimulated area only formed clusters primarily at the edge closer to the Cell 1 (Fig. 3a & Fig. S4), while Cell 3 (far distant) was nearly intact. We then quantitatively analyzed the intracellular fluorescent mCherry signals to assess the protein degradation in these cells. The results showed a significant reduction in mCherry signals in Cell 1 compared to Cell 2, with no noticeable changes in Cell 3 (Fig. 3b). To confirm that this reduction was not due to photobleaching, we performed control experiments with cells expressing mCherry only under the same conditions, where the fluorescence remained stable (Fig. S5). Additionally, different intensities of 488 nm laser have shown to induce varying levels of protein degradation in live-cell imaging (Fig. 1c), quantitative analysis demonstrating that the POT-induced effects were light-dose dependent. Therefore, these results illustrate that POT-mediated protein degradation can be controlled in a light dose-dependent manner.
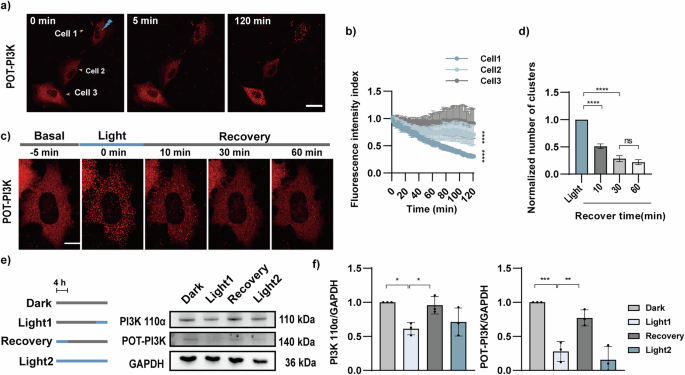
a COS-7 cells expressing POT-PI3K were illuminated with 488 nm laser (5 mW, 100 ms every 1 min) by FRAP. The FRAP area was within the marked Cell 1 with a circle at the diameter of 4 pixels (0.6 μm). The Cell 2 was in close proximity to the illuminated area, whereas Cell 3 was far distant. Scale bar: 10 μm. b The mCherry fluorescence in Cell 1-3 was quantified by live cell imaging (n = 3 cells). c The reversibility of POT was demonstrated through live-cell imaging in COS-7 cells expressing POT-PI3K. After 488 nm light stimulation, POT-PI3K formed clusters. The images of the recovery process were captured every minute without blue light exposure and representative time points were shown. Scale bar, 5 μm. d The formed protein clusters were measured and plotted with the conditions indicated (n = 17 cells). e The reversibility of POT-PI3K was demonstrated through immunoblotting in COS-7 cells overexpressing POT-PI3K. Cells were treated as follows: 16 h of dark (lane Dark), 12 h of dark and 4 h of pulsed blue light (1 s every 6 s, lane Light1), 4 h of pulsed blue light and 12 h of dark state (lane Recovery), and 16 h of pulsed blue light (lane Light2). f The normalized densitometric PI3K 110α and POT-PI3K over GAPDH ratio in three independent experiments. All data were presented as mean ± SEM. Statistical significance is based on two-tailed Student’s t-tests (b) or One-way ANOVA tests (d, f) and is represented with labels, ns (P > 0.05), *(P ≤ 0.05), **(P ≤ 0.01), ***(P ≤ 0.001), **** (P ≤ 0.0001).
We then investigated whether the POT-PI3K system maintained the property of reversible oligomerization of CRY2olig. The COS-7 cells expressing POT-PI3K were firstly exposed to 5 min of pulsed 488 nm laser illumination (1 mW/cm2, 1 s light exposure per 6 s). After that, the cells were imaged without 488 nm laser exposure for another 10 min, 30 min, and 60 min (Fig. 3c). The quantity of intracellular clusters was statistically analyzed using the particle tracking method as previously described32 (Fig. 3d). The results revealed a significant reduction in cluster formation after 10 min recovery in dark (51.15 ± 4.29% vs light treatment) and further reduced after 30 min (28.48 ± 5.45% vs light treatment). Interestingly, no significant difference in cluster formation was detected after 30 min and 60 min recovery in dark, suggesting the recovery to the maximum extent in 30 min.
Next, we tested whether recovery in dark condition could replenish previous degraded protein by blue light-induced POT-PI3K. The COS-7 cells expressing POT-PI3K were illuminated with blue light LED array 29,30 for 4 h (1 s light exposure per 6 s, 1 mW/cm2) followed by a 12 h dark treatment for recovery. We compared the protein levels of PI3K 110α and POT-PI3K in those cells treated with the opposite protocol (12 h of dark treatment followed by 4 h light illumination). The cells maintained in the dark or had sustained blue light illumination for 16 h served as negative and positive controls, respectively. We quantified the protein levels with biochemical assays and the results showed that unlike to the sustained light illumination, recovery in dark conditions allowed replenishment of PI3K 110α and POT-PI3K levels (Fig. 3f). These findings suggest that the POT-induced protein degradation process can be completely abolished by light deprivation. Moreover, periodic light illumination may allow more sophisticated control of protein abundance in cells.
Light-induced degradation of endogenous PI3K 110α diminishes cancer cell migration and enhances cell apoptosis
PI3K has been demonstrated to involve in cancer cell proliferation, migration, and cell apoptosis. To investigate the function of POT-induced degradation of PI3K 110α, we conducted the wound healing assay in HeLa cells. Our results showed that after 48 hours of blue light LED array illumination (1 s light exposure per 6 s, 1 mW/cm2), the migration towards wound area in cells expressing POT-PI3K was significant decreased when compared with control cells (transfected with empty vector), and the POT-PI3K induced reduction was comparable to the LY294002 (PI3K inhibitor, 10 μM) treatment (Fig. 4a-b). Notably, this inhibitory effect of POT-PI3K was alleviated following insulin (PI3K agonist, 100 nM) treatment. In contrast, in cells expressing POTΔTRIM showed no significant changes in migration under either dark or light conditions. Similarly, cell viability as measured by Cell Counting Kit-8 (CCK-8) revealed significantly lower viability in light-stimulated POT-PI3K expressing cells, when compared to control cells (Fig. 4c). Taken together, these findings indicate that POT-based degradation of PI3K 110α suppressed cancer cell migration and reduced cell viability.
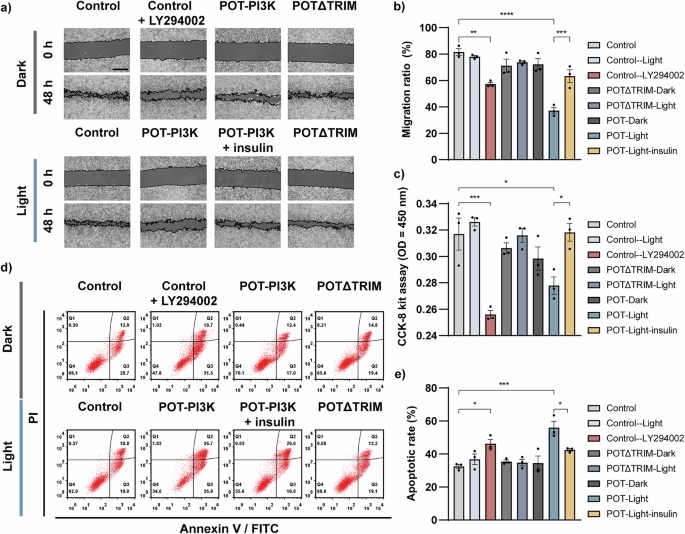
a Representative images of HeLa cell migration were assessed by wound healing assay. Cells expressing pLenti-EF1a, POT-PI3K, or POTΔTRIM were illuminated with or without blue light LED array (1 s every 6 s). HeLa cells treated with LY294002 and insulin were used as experimental controls. The images were captured at 48 h after wound scratch. Scale bar, 500 μm. b Quantified results of the wound healing assay are presented (n = 3 independent samples). c CCK-8 assay was employed to quantify the HeLa cell proliferation under different treatments (n = 3 independent samples). d HeLa cell apoptosis was analyzed by flow cytometry under different treatments and quantitatively plotted in (e) (n = 3 independent samples). All data were presented as mean ± SEM. Statistical significance is based on One-way ANOVA tests and is represented with labels, * (P ≤ 0.05), ** (P ≤ 0.01), ***(P ≤ 0.001), **** (P ≤ 0.0001).
Next, we assessed whether POT-induced degradation of PI3K 110α would promote cancer cell apoptosis. After treatment, HeLa cells stained with Annexin V and propidium iodide (PI) were analyzed by flow cytometry. Our results showed that in both blue light LED array (1 s light exposure per 6 s, 1 mW/cm2, 24 hours) stimulated POT-PI3K expressing cells and control cells treated with LY294002, the cell apoptosis ratios were significant increased (Fig. 4d-e). On the contrary, in control cells illuminated with the same dose of blue light or cells expressing POTΔTRIM, neglectable effects in cell apoptosis were detected, which excluded the possibility of light-induced toxicity and confirmed the specificity of POT system. Additionally, we showed that insulin treatment partially rescued the POT-PI3K induced cell apoptosis (Fig. 4e). Collectively, these results demonstrate that the light-induced degradation of PI3K 110α by POT recaptured the expected phenotype as by PI3K inhibition, whose downregulation diminishes cancer cell migration and enhances cell apoptosis.
Light-induced degradation of endogenous GPX4 enhances ferroptosis
To further validate the feasibility of POT system, we targeted another critical endogenous protein, GPX4. GPX4 is a glutathione-dependent lipid hydroperoxidase, which converts lipid hydroperoxides into non-toxic lipid alcohols to prevent ferroptosis33. It has been implicated in a wide variety of pathological processes, such as degenerative diseases, cancer, liver, and cardiovascular diseases34. Recent study has reported that FUNDC1, a mitophagy receptor, binds to GPX4 via its 96-133 amino acid domain22. We utilized this domain as the ‘bait’ to generate POT-GPX4 and validated its binding to GPX4. Immunofluorescence staining results showed that after LED array illumination (1 mW/cm2, 1 s light exposure per 6 s for 2 h), the endogenous GPX4 formed discrete clusters, and its colocalization with mCherry tagged POT-GPX4 was increased significantly as quantified by PCC analysis (0.40 ± 0.03 in dark vs 0.69 ± 0.01 with light) (Fig. 5a-b). These findings suggested that FUNDC1 (96-133 aa) exhibited effective targeting towards endogenous GPX4. Next, we confirmed light-induced GPX4 protein degradation by biochemical experiments. Upon blue light LED array illumination (1 mW/cm2, 1 s light exposure per 6 s for 4 hours), the POT-GPX4 led to 39.22 ± 1.03% reduction in endogenous GPX4 compared with control cells expressing empty vector, and 54.91 ± 8.41% reduction in mCherry-labeled POT compared with POT-expressing cells kept in dark (Fig. 5c-d). In contrast, blue light-treated control cells and (R)-MG132-treated cells showed no apparent protein reduction (Fig. 5d). We further demonstrated that TRIM21 motif is necessary for POT-GPX4 induced protein degradation (Fig. S6). These results demonstrate the effectiveness of light induced GPX4 degradation.
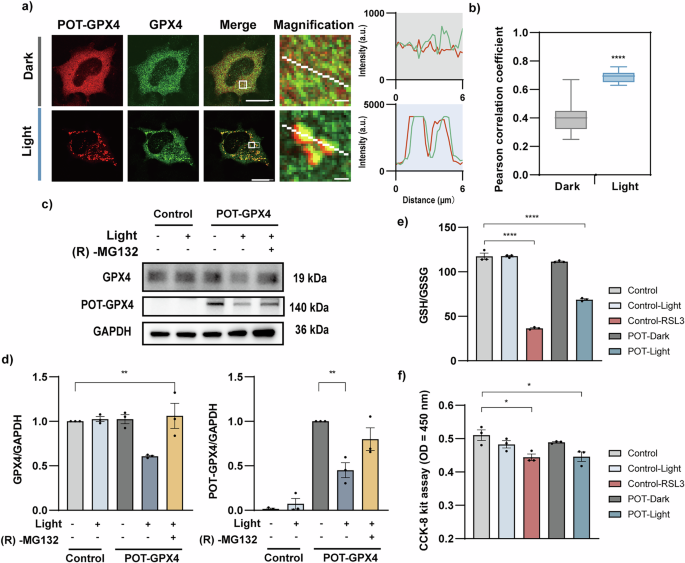
a Immunofluorescence images of COS-7 cells expressing POT-GPX4 (red), before and 2 h after LED array illumination (1 mW/cm2, 1 s every 6 s). (R)-MG132 was used to abolish protein degradation during immunofluorescence experiments. Cells were fixed and immuno-stained with antibodies against GPX4 (green). Graphs show intensity profile of GPX4 and POT-GPX4 along the white lines on magnified images. Scale bars: 10 µm for full cell images and 1 µm for magnified images. b Pearson’s correlation coefficient for POT-GPX4 and GPX4 (n = 16 cells). c COS-7 cells expressing POT-GPX4 were illuminated with or without blue light LED array (1 mW/cm2, 1 s every 6 s) or treated with (R)-MG132 for 4 h before immunoblotting. All groups were pretreated with CHX (10 μg/ml) for 2 h before experiments. d Normalized densitometric GPX4 (left) and POT-GPX4 (right) over GAPDH ratio in three independent experiments. e Intracellular GSH/GSSG levels in HeLa cells were quantified in the conditions indicated. HeLa cells treated with RSL3 were used as positive control (n = 3 independent samples). f CCK-8 assay on HeLa cells in the conditions indicated (n = 3 independent samples). All data were presented as mean ± SEM. Statistical significance is based on two-tailed Student’s t-tests (b) or One-way ANOVA tests (d–f) and is represented with labels, * (P ≤ 0.05), ** (P ≤ 0.01), **** (P ≤ 0.0001).
We next investigated whether the light-induced degradation of GPX4 by POT-GPX4 would trigger ferroptosis. The conversion of glutathione (GSH) to glutathione disulfide (GSSG) serves as a pivotal indicator for the occurrence of ferroptosis33. Thus, we quantitatively measured the ratio of GSH to GSSG, and the cells treated with GPX4 inhibitor Ras-selective lethal small molecule 3 (RSL3)35 were used as positive control. After blue light LED array stimulation (1 mW/cm2, 1 s light exposure per 6 s for 24 h), HeLa cells expressing POT-GPX4 exhibited significant reduction in GSH/GSSG ratio, resembling the effect of RSL3 treatment (Fig. 5e). To further evaluate cell viability, we performed CCK-8 assay, which showed that the POT-GPX4 transfected cells had significantly lower viability than the control cells, mimicking the reduction induced by RSL3 treatment (Fig. 5f). The decrease in cell viability was accompanied by the formation of mitoaggresomes (Fig. S7a-b) and elevated ROS levels (Fig. S7c-d) in cells, suggesting the occurrence of mitophagy closely associated with ferroptosis. Overall, these results demonstrate that POT-induced degradation of endogenous GPX4 promotes cell ferroptosis.
Discussion
To degrade endogenous, unmodified protein, we designed a novel light-controllable protein degradation system called POT, in which we employed expressed peptide as the ‘bait’ to target POIs. Although studies have been shown to utilize optogenetics to induce exogenous protein degradation12,13,14,15,16,17, light-controlled degradation of endogenous, unmodified proteins is still challenging. One solution is to target protein with nanobodies for regulated degradation18,19. However, the well-validated nanobodies permit for targeting proteins in live cells are still limited. Thus, an alternative and more feasible approach to degrade endogenous unmodified proteins is highly anticipated in the field.
In fact, the POT-based protein degradation system has significant advantages. The peptide sequences mediated protein-protein interaction can be readily accessible from literature, open-access databases (such as STRING) or simulated by AI-based algorithms (e.g., AlphaFold). Our results demonstrate that the expressed peptides iSH2 and FUNDC1 (96-133 aa) can effectively target to endogenous PI3K 110α and GPX4 (Fig. 1d-f, Fig. 5a-b). We anticipate that any protein within the cell can be targeted by a rational POT. To degrade the target POIs, the POT system utilizes the E3 ubiquitin ligase TRIM21, and the optogenetics tool CRY2olig to induce rapid and switchable downregulation of POIs. Compared with other E3 ligases, TRIM21 is more feasible as it promotes proteolysis of any substrates it is bound to19,23. It has been adopted in previously developed Trim-Away system, which has demonstrated in a wide range of applications3,4. Our results validated the potency of POT-mediated downregulation of endogenous PI3K 110α (Fig. 2) and GPX4 (Fig. 5), and validated its induced cell apoptosis and ferroptosis in cancer cells. We also demonstrated that the POT system was able to control protein degradation in a light-dose-dependent manner (Figs. 1c, 3a-c) and was able to restore the protein abundance after light deprivation (Fig. 3d-f). All these illustrated the great advantages of optogenetics-based regulation system.
The POT system has been shown to be able to effectively induce endogenous protein degradation with light. However, the potency of POT is dependent on the overexpressed TRIM21. As an essential E3 ubiquitin ligase, the prolonged upregulation of TRIM21 in cells may induce unexpected alterations in cellular activity 36,37,38. Interestingly, we observed that larger POT aggregates were more resistant to degradation (Fig. 3a). Incorporating environmental factors (e.g., temperature control), chemical modulators, or light-regulated gene transcription modules may help mitigate these limitations. Recently, the TRIM21 mutant with deletion of the B-Box domain (ΔTrim)20 has shown to enhance protein degradation efficiency and has minimal cytotoxicity even with constitutive promoters, which is a potential direction for optimization of POT. Moreover, the binding affinity between the ‘bait’ peptide and its target proteins warrants careful consideration. Selecting highly specific baits can enhance the specificity of the system, whereas broader baits may enable POT to function as a multi-target degradation tool.
In summary, our novel POT system employs co-expressed peptides to selectively target endogenous proteins in the cell and utilizes light to potently induce protein degradation. Compared with other existing drugs or chemical-induced protein regulation systems, POT has many significant advantages. Firstly, POT can downregulate any endogenous, unmodified proteins with appropriate peptides, it simplifies the screening process for the ‘bait’ by employing well-validated peptides to target POIs. Secondly, POT acts directly at the protein level, which allows for rapid downregulation of POIs and has the potential for degradation of long-lived proteins as well. Thirdly, POT system shares all the advantages of optogenetics-based tools, for precise light-induced protein degradation. Therefore, we believe the POT offers an alternative and practical solution for rapid manipulation of endogenous protein expression, which would have vast applications in dissecting complex signaling pathways in cells and for targeted cellular therapies.
Materials and methods
Chemicals and plasmids
The rabbit anti-PI3 kinase p110α (C73F8) (#4249), anti phospho-Akt (Ser473) (D9E) (#4060), and anti-Akt (pan) (C67E7) (#4691) antibodies were purchased from Cell Signaling Technology (Danvers, MA, USA). The rabbit anti-mCherry (ab167543), anti-PI3 kinase p110β (ab151549), anti-GAPDH (EPR16891) (ab181602), anti-glutathione peroxidase 4 antibodies (ab41787) and fluorescent-labeled secondary antibodies, Alexa Fluor 488 goat-anti rabbit IgG (ab150081), were purchased from Abcam (Cambridge, MA, USA). Secondary antibodies against rabbit IgG (M21002) conjugated with horseradish peroxidase were purchased from Abmart (Shanghai, China). Common chemicals and reagents were purchased from Sigma-Aldrich unless otherwise noted.
All plasmids used in this study were generated by Genewiz (Jiangsu, China). To generate POT-PI3K, the hTRIM21 gene (Gene ID: 6737) was synthesized and inserted into the pLenti -EF1a vector at the EcoR1 and BamH1 sites. Following this, iSH2 (from Addgene #66839), mCherry (from Addgene #66839), and CRY2olig (CRY2 E490G mutant synthesized by Genewiz) were sequentially inserted into the EcoR1 site, with flexible (GS) linkers and specific restriction enzyme cutting sites placed between each element to facilitate cloning. For cell apoptosis experiments, mCherry in POT-PI3K was removed to avoid spectral overlapping between PI signals. To generate POT-GPX4, the FUNDC1 fragment (96-133 aa, Gene ID: 139341) was synthesized and used to replace iSH2 in POT-PI3K by cutting at the EcoR1 and Cla1 sites. For the control constructs POTΔTRIM, hTRIM21 was removed from the POT-PI3K and POT-GPX4 plasmids by excision at the Asc1 and BamH1 sites. All generated constructs were validated by sequencing.
Cell culture and transfection
COS-7 cells, A549 cells, HeLa cells and HEK 293 T cells were cultured in high glucose Dulbecco’s modified Eagle’s medium (DMEM) (C11995500BT, Gibco) with 10% fetal bovine serum (FBS) (12103 C, Sigma) and 1% Penicillin-Streptomycin-Amphotericin Solution (C0224, Beyotime, China) at 37 °C in a humidified 5% CO2 incubator. The cells were transfected with indicated plasmids using the Lipofectamine 3000 (Life Technologies) according to the manufacturer’s instructions. We used 2 μg of DNA plasmids and 2 μL of lipofection reagents per 500 μL of cell culture to ensure transfection efficiency. After transfection, cells were covered with aluminum foil to eliminate light exposure, and all subsequent procedures were performed under a red-light lamp (~650 nm, 0.5 mW/cm2 at the operating area), which does not activate CRY2olig (Fig. S3).
For packaging the lentivirus, HEK 293 T cells were cultured on 6-well plates and transfected with psPAX2 (Addgene #12260), pMD2.G (Addgene #12259), and target plasmids at the ratio of 2:2:1 to produce lentivirus. Lentiviral supernatants were harvested at 72 h post-transfection and filtered through a 0.45 μM membrane (Millipore, MA). Before transduction, HEK 293 T cells were seeded on 6-well plates (4 × 10⁵ cells per well). After 12–18 h, cells were transduced with 2 ml lentivirus for 24 h in the presence of 10 μg/ml of polybrene (H8761, Solarbio). At 24 h post-transduction, the lentivirus was replaced by fresh culture medium. After 48 h of transduction, the HEK 293 T cells were sorted using fluorescence-activated cell sorting (FACSAria Fusion SORP, BD).
Live cell imaging
COS-7 cells were cultured on 35-mm glass bottom dishes (D35-20-1-N, Cellvis) and transfected with the plasmids indicated. Before imaging, the medium was replaced by KRBH buffer (pH 7.4), containing 125 mM NaCl, 5 mM KCl, 1.3 mM CaCl2, 1.2 mM MgSO4, 20 mM D-Glucose, 25 mM HEPES and 0.2% BSA. Live cell imaging was performed on an FV3000 confocal microscope (Olympus) with a 60X NA 1.4 object. Cells were kept in a thermostat-controlled chamber at 37 °C and humidified 5% CO2 throughout the imaging process. Excitation illumination was delivered from a combined laser device and images were collected on 1024 × 1024 pixels photo snapshots and movies. The 488 nm laser illumination was employed to induce oligomerization of CRY2olig protein. The 561 nm laser was utilized for visualizing proteins tagged with mCherry. Stacks of time-lapse images were captured in 1 min intervals after blue light stimulation. To correct for photobleaching, each image frame was multiplied by the inverse of the intensity loss ratio, as calculated from the mCherry photobleaching curve28. For light-dose studies, the 488-nm laser illumination with a 100-ms dwell time was delivered using the built-in FRAP module of the microscopy system. Images were captured by a 40X object. For long-term imaging, a focus lock system integrated into the confocal microscope was used to maintain focus throughout the imaging process. Quantification of the mCherry tagged protein degradation was performed using ImageJ (NIH, USA) as previously described21. The mean and standard deviation of the mCherry intensities were measured in ImageJ (NIH, USA). ΔCV was defined as (stdi/meani) – (std0/mean0) to indicate formation of clusters. The intensities of fluorophores within cells of interest were normalized and quantified with background subtraction. The protein degradation efficiency was analyzed by calculation the cellular mCherry signals. The quantity of intracellular clusters was statistically analyzed using the particle tracking method previously published32.
Immunofluorescence
Immunofluorescence cell staining was performed as previously described21,39. COS-7 cells were fixed in 4% paraformaldehyde for 15 min, permeabilized with 0.1% Triton X-100 in PBS for 10 min. After washing three times with PBS, cells were blocked with blocking buffer (3% BSA in PBS) for 30 min. Subsequently, cells were incubated overnight at 4 °C with the primary antibody (1:400 in blocking buffer), followed by washing three times with PBS. Cells were incubated with Alexa Fluor 488-labeled secondary antibody (1:400 in blocking buffer) and washed three times with PBS. The images were captured with an FV3000 confocal microscope (Olympus) with a 60X NA 1.4 object. The colocalization analysis of mCherry and PI3K 110α or GPX4 was performed by ImageJ (NIH, USA) with the Coloc 2 plugin. The intensity patterns along the single pixel line were measured by ImageJ with the plot profile tool.
Immunoblotting
COS-7 cells were cultured on 24-well plates (#3524, Corning) for biochemical experiments. Precise light illuminations were provided by a wireless-controlled LED array, as designed in our previous studies29,30,39. To inhibit new protein synthesis and ensure consistent basal protein levels, all groups of cells were treated with cycloheximide (CHX; 10 μg/ml, #HY-12320, MedChemExpress) for 2 h prior to blue light stimulation. The cells were lysed in cell lysis buffer (40 nM HEPES, 150 mM NaCl, 1% Triton X-100, and 0.5% NP40, adjusted pH to 7.4) containing protease inhibitors (cOmplete; Roche) and phosphatase inhibitors (PhosSTOP, Roche). Protein concentration was measured by bicinchoninic acid protein assay kit (#23227, Thermo Scientific). Samples of 15–30 μg of total protein were separated by 4–20% Tris-Glycine SDS-PAGE (ET15420Gel, ACE), transferred to polyvinylidene difluoride membrane (ISEQ00010, Millipore) and blocked with 5% BSA in TBST buffer. Proteins were hybridized to appropriate primary antibodies and horseradish peroxidase-conjugated secondary antibodies for subsequent detection with enhanced chemiluminescence reagents (SB-WB012, ShareBio). Signal intensity quantification was performed using the ImageJ software on unsaturated images.
Cell migration assay
Cell migration assay was performed as previously described39. HeLa cells were planted in 12-well cell culture plates (#3513, Corning) for wound healing assay to study cell migration. Cells were transfected with empty vector, POT-PI3K, or POTΔTRIM plasmids. The medium was changed 12 h after transfection. At 24 h post-transfection, cells were incubated with DMSO, 5 µM LY294002 (#HY-10108, MedChemExpress), or 100 nM insulin (#3435, Tocris Bioscience) before exposure to blue light stimulation. Meanwhile, scratches were made in the center of the plate by using 1 mL pipette tips and the cell migration was monitored by light microscopy.
Apoptosis detection
HeLa cells were seeded in 6-well cell culture plates (#3516, Corning) for apoptosis assay. After transfection and treatments indicated, cells were digested by trypsin and resuspended in Binding Buffers. Annexin V-FITC/propidium iodide (PI) double-stain apoptosis detection kit (AP101-60-kit, MultiScience) was used according to the manufacturer’s protocol. The proportions of apoptotic cells were evaluated by a flow cytometer (BD FACSCalibur) and analyzed using FlowJo.
Cell viability assay
Cell viability was examined by cell counting kit-8 (#C0038, Beyotime). HeLa cells were seeded in 96-well plates (#3925, Corning). At 24 h post-transfection, cells were incubated with 10 µM LY294002 (#HY-10108, MedChemExpress) in DMSO, or 100 nM insulin (#3435, Tocris Bioscience). After illumination with blue light for another 12 h, the CCK-8 solution (each well 10 µL) was added to each well for 40 min at 37 °C. SpectraMax M2e (Molecular Devices) was used to measure the optical density (OD) at 450 nm. Each group was performed with three replicates. To examine the cell viability of POT-GPX4, HeLa cells were transfected with POT-GPX4 and incubated with 2.5 µM RSL3 (HY-100218, MedChemExpress) in DMSO. After 24 h of treatment, the OD value was measured using SpectraMax M2e (Molecular Devices) in the abovementioned steps.
Intracellular GSH/GSSG ratio detection
The intracellular GSH/GSSG was detected using GSH and GSSG Assay Kit (#S0053, Beyotime). HeLa cells were seeded in 6-well plates (#3516, Corning) and transfected with POT-GPX4. The medium was changed 12 h after transfection. At 24 h post-transfection, serum-free medium was replaced, and cells were illuminated with blue light for another 24 h. Meanwhile, control cells were treated with 2.5 µM RSL3 for 24 h. The treated cells were lysed with freeze-thaw cycles and centrifuged to collect the supernatant for the measurement of GSH and GSSG according to the manufacturer’s protocol.
Mitochondrial morphology analysis
HEK 293 T cells stably expressing POT-GPX4, POTΔTRIM, and control cells were cultured on 35-mm glass bottom dishes. The cells were either illuminated with or without LED array (1 s every 6 s, 1 mW/cm2), or treated with 2.5 μM RSL3. After treatment, cells were stained with 100 nM MitoTracker™ Deep Red FM (M22426, Thermo Fisher) and 1 mM Hoechst (H1399, Thermo Fisher) according to the manufacturer’s instructions. The cells were washed by PBS for three times before imaged by Olympus FV3000 confocal microscope. Transfected cells were classified as “mitoaggresomes” if mitochondria were fragmented and clustered around nuclei, “uncertain” if mitochondria were fragmented but widespread within the cytosol, or “normal” if they were indistinguishable from control cells 26.
Live cell ROS level detection
HEK 293 T cells stably expressing POT-GPX4, POTΔTRIM, and control cells were cultured on 12-well plates. After treatment as indicated, the cells were digested by trypsin, washed by PBS, and stained with 1 μM H2DCFDA (#HY-D0940, MedChemExpress) in PBS for 15 min at 37 °C. The cells were then washed by PBS for three times and resuspended in PBS with 5% FBS. The fluorescence intensity of H2DCFA was detected by flow cytometer (BD FACSCalibur) and analyzed in FlowJo.
Statistical analysis
All data were presented as the mean ± SEM and analyzed by Student’s t-test for two group experiments and One-way ANOVA test for groups over three. All analyzed experiments used biological replicates to compute statistical significance. In all statistical analyses, P values less than 0.05 were considered statistically significant, and * indicates P < 0.05; ** indicates P < 0.01; *** indicates P < 0.001; **** indicates P < 0.0001.
Reporting summary
Further information on research design is available in the Nature Portfolio Reporting Summary linked to this article.


Responses