Light cues drive community-wide transcriptional shifts in the hypersaline South Bay Salt Works

Introduction
Understanding extreme environments requires probing the ecological and environmental interactions that maintain homeostasis within their challenging conditions. Diel cycles, or patterns of biological activity that correspond to daily rhythms, are present in all domains of life but are understudied in natural microbial communities compared to laboratory cultures. The day/night transition comes with changes in light intensity and temperature which may also affect geochemical conditions such as oxygen saturation, all of which organisms must adjust to. A well-known adaptation to diel cycles is the evolution of an internal molecular clock, which drives the rhythmic expression of different genes1,2. Circadian rhythms are instrumental in partitioning metabolic functions sensitive to external conditions, such as temporal separation of nitrogen fixation and photosynthesis in many species of Cyanobacteria3.
Previous research has demonstrated that microbial diel cycles are powerful drivers of activity and metabolism in multiple settings, from the marine water column to geothermal hot springs4,5,6. In hypersaline settings, metabolic diversity tends to be restricted due to the high bioenergetic cost of osmotic adaptation7. Thus, most extreme halophiles lead an aerobic heterotrophic lifestyle that relies on organic carbon produced by a small number of photoautotrophic taxa, including some Cyanobacteria8 as well as the unicellular eukaryote Dunaliella salina9. Therefore, diel regulation in these communities may have cascading effects not only for primary producers but also for the large network of heterotrophs they support.
South Bay Salt Works (SBSW), a commercial salt harvesting facility in Chula Vista, CA that hosts a series of evaporative salterns, is an ideal venue to understand diel cycling in a marine-derived extreme halophilic community10. The saltern system at SBSW consists of an intake channel from the San Diego Bay leading to a series of evaporator ponds, through which brine is passed sequentially until it reaches NaCl saturation, at which point halite precipitates11 (Fig. 1). The NaCl-deficient brine is drained from the ponds and salt is harvested. Further concentration of the saturated brine yields an MgCl2-dominated solution (Fig. 1, Supplementary Table 1). Previous research suggests that halophilic archaea such as Halobacterium salinarum have the capacity for circadian entrainment12, and that diel cycles broadly influence relative abundances of community members as well as lipid composition in hypersaline locations13. Yet how diel cycles affect resource use and gene regulation in halophilic communities remains to be addressed.

Red dots indicate sites where DNA was sampled for metagenomic and amplicon sequencing. The yellow dot indicates the site of diel metatranscriptomic sampling. Image retrieved from Google Earth on 05/27/2024.
We used metatranscriptomics to measure gene expression throughout a 24-hour period in one saltern at SBSW. Comparing whole-community mRNA transcripts across timepoints allowed us to investigate differentially expressed functions across day and night, the taxonomic differentiation of these functions, and interactions among community members. To corroborate these insights, we used a pure culture of Salinibacter ruber strain M3114 (DSM13855), an extremely halophilic bacterium with marked functional similarities to many Halobacteria15. Unusually for a bacterial species, Salinibacter ruber is a salt-in strategist and possesses a highly acidic proteome, making it an obligate halophile that thrives at an optimum of 20–30% salinity14,16. Originally isolated from a Spanish solar saltern, Salinibacter ruber is found abundantly in SBSW11 as well as many other solar salterns worldwide17. We grew S. ruber under twelve-hour light/dark cycling for one week followed by two days of sampling, and then twenty-four-hour darkness for two days in order to identify changes in gene expression due to light/dark cycles and test the ability of S. ruber to entrain free-running, or internally regulated, circadian rhythms.
Methods
Sampling procedure and objectives
Brine samples for RNA extraction were collected only from Site 12 (aw ≅ 0.83, TDS = 250.7 g L−1), the focus of our diel study due to its low water activity and high pre-saturation salinity. This site was sampled over a twenty-four-hour period at the following times: 10:00, 14:00, 18:00, 22:00, 02:00, 06:00. At each time point, bulk brine was collected from shallow water (< 1 m depth) into an acid-washed and triple rinsed 4 L container via peristaltic pump connected with acid-washed tubing that extended approximately 3 meters from shore (Supplementary Fig. 1). To capture cellular material and nucleic acids, approximately 250 mL of brine was passed through each 47mm-wide 0.2 µm PES filter (Pall Laboratory, Port Washington, NY) using a Sterlitech WaterVac vacuum pump (Sterlitech, Auburn, WA). Six filters were collected per time point. 1 mL RNAlaterTM solution (Invitrogen, Waltham, MA) was immediately added to each filter and excess liquid not absorbed by the filter was drawn through. Filters were then removed from the pump by carefully rolling them using sterile tweezers and placing them in 15 mL Falcon tubes without creasing filter paper. Samples were stored on dry ice in the field and transferred to −80 °C storage at UC San Diego.
Three additional filters were collected from Site 12, as well as all other ponds in the SBSW complex, without the addition of RNAlaterTM: the sampling procedure was identical in all other respects. These filters were used for DNA extraction and sequencing. Raw brine was also collected from all sites for TDS analysis via evaporation residue, as well as ionic composition (Supplementary Table 1). Additionally, temperature and pH measurements were collected from Site 12 at each time point using a HOBO MX2501 logger (Onset, Bourne, MA) and dissolved oxygen was collected using a miniDOT logger (PME Solutions, Vista, CA). Oxygen values were corrected for temperature and salinity using standard equations embedded in the proprietary “concatenate” software. Water activity was measured for all sites and all time points using a METER Aqualab 4TE water activity meter in the lab and regularly calibrated against METER Aqualab Verification/Calibration Standards.
Nucleic acid extraction and sequencing
All nucleic acids were extracted on the KingFisher Flex bead handling robot (ThermoFisher Scientific, Waltham, MA) using the MagMax Microbiome Ultra Nucleic Acid Isolation kit. The Microbiome Ultra soil protocol was used without modification for metagenomic samples, and the full protocol is available online from ThermoFisher (pub. # MAN0018070). The filters collected without RNAlater were divided into quarters using sterile scissors and one quarter was used for DNA extractions, while the other three quarters were archived at –80 °C.
Due to protocol development and troubleshooting of the RNA extractions, each timepoint presented here contains six sequence library datasets generated from a combination of filter replicates and sequencing replicates from the same bulk brine collection bottle. Six filters were collected for each timepoint using 250 mL each of sampled brine. However, due to sample loss and protocol development, some filters were combined into a single RNA sample while others were aliquoted into multiple sequencing replicates. Our replication scheme is thus as follows. Timepoint 10:00 contains three datasets, termed ‘combo’, where material from two filters was combined. All other timepoints have two datasets where material from one filter was split into two aliquots for sequencing. The remaining datasets contain extractions from a single filter each, for a total of six datasets per timepoint.
RNA from filter quarters were extracted separately and were later combined and concentrated using 3 KDa Amicon Ultra-0.5 centrifugal filter units (Millipore-Sigma, Burlington, MA) to produce a single RNA sample. The following custom DNase digestion step was added to the abovementioned KingFisher Flex automated extraction protocol between the Wash Buffer and 80% ethanol wash steps. To isolate RNA, DNA was degraded using 10 µL of TURBO™ DNase (Invitrogen, Waltham, MA) and 190 µL of 1× buffer (diluted in nuclease-free water) and agitated for 15 minutes at 37 °C. 1 µL of RNaseOUT™ recombinant ribonuclease inhibitor (Invitrogen, Waltham, MA) was added to each concentrated sample to prevent RNA degradation. Finally, a second TURBO™ DNase digestion step was performed following manufacturer instructions to remove remaining DNA. Final RNA concentrations were quantified using the Qubit RNA High Sensitivity assay (Invitrogen, Waltham, MA). RNA was extracted in two different batches in October 2020 and May 2021.
Extracted DNA was submitted to the UCSD Microbiome Core (San Diego, CA) for whole metagenome shotgun sequencing as well as amplification and sequencing of 16S and 18S rRNA genes as previously described11. Extracted RNA was submitted to the IGM Genomics Center (UCSD, San Diego, CA). All RNA samples were prepared using the Illumina Stranded Total RNA Prep with Ribodepletion and sequenced on an Illumina NovaSeq 6000, generating on average 34.5 M reads per sample.
Metagenome and amplicon analysis
High-quality metagenome-assembled genomes (MAGs) from all of the sites sampled at SBSW were curated according to the following pipeline, also described by Dutta et al.18. Briefly, raw reads were first trimmed and quality filtered using fastp v0.21.019. QC’d reads were then assembled into contigs using metaSPAdes v3.15.220 and contigs were binned using metaBAT 2 v2.15-6-g8b5702b21. CheckM v1.1.322 and dRep v3.2.223 were then used to sub-select 494 high-quality, unique MAGs from the 1721 metagenomic bins which were assembled from all 10 sites using the following cutoffs consistent with MIMAG standards24: ≥50% completeness, ≤10% contamination, and ≤99% average nucleotide identity. All MAGS were taxonomically annotated using GTDB-Tk v1.7.025 and ORFs were annotated using the NCBI Prokaryotic Genome Annotation Pipeline26. Amplicon sequences from 16S and 18S rRNA genes were processed using DADA2 v1.1427 and annotated using paprica v0.528, as described in Klempay et al.11.
Metatranscriptomic analysis
To annotate metatranscriptomic reads, we mapped our sequences to a custom database of genes curated from the South Bay Salt Works MAGs. Both assembly of mRNA reads and direct read mapping are valid forms of metatranscriptomic analysis, although direct read mapping to taxonomic and functional databases remains more popular in prepackaged metatranscriptomic workflows29. We chose to create a custom gene database created from annotated ORFs from medium- and high-quality MAGs. We acknowledge that metagenome-assembled-genomes are not fully comprehensive representations of all genes in a given genome. However, using direct read mapping to genes from our MAGs allowed us to analyze gene expression in a quasi-genomic and taxonomically specific context. Furthermore, these MAGs were environmentally relevant population genomes specific to the SBSW system, allowing us to detect fine-grained variance in expression.
To create this database, we quality-checked our reads with fastp (with approximately 99% of reads passing QC), and then selected the most transcriptionally active MAGs for database curation by aligning our reads against MAGs from all sampling sites using the Burrows-Wheeler Aligner’s BWA-MEM algorithm30. Over two-thirds of the MAGs chosen for this database were above 80% completeness, and half were above 90% completeness (Supplementary Table 3). We were able to map between 30–41% of reads from each sample to MAGs from SBSW. 114 MAGs accounted for 98% of the mapped reads, and we therefore selected these MAGs for our custom gene database. Metatranscriptomic reads were then mapped to the gene database created from these MAGs using BWA-MEM. The Sequence Alignment Map (SAM) files were parsed into count matrices using a custom Python script (see Code Availability statement), and these count matrices were used to perform differential expression analysis.
Data was analyzed in R using the packages DESeq2 v1.44.031, limma v3.60.632 and vegan v2.6-833 as well as the tidyverse v2.0.034 package for visualization. We used the likelihood ratio test (LRT) from DESeq2 for our time-series data to analyze all factor levels at once and identify genes showing a change in expression across timepoints35. Initial inspection of our normalized count data using Principal Component Analysis (PCA) revealed a batch effect in our replicates based on whether they were extracted in October 2020 or May 2021 (Supplementary Fig. 1A). To control for this, we incorporated batch as a factor in our model such that our full model was ~batch + time and our reduced model was simply ~batch. Additionally, for ordinations and other analyses outside of DESeq2, we used the removeBatchEffects function from limma to create a new, log-normalized count matrix. Subsequent examination of this new dataset via PCA and statistical analysis using vegan’s permutational multivariate analysis of variance (adonis2) demonstrated satisfactory reduction of batch effects on the data (Supplementary Fig. 1B,C).
We utilized DESeq2 in a genome-wise fashion by analyzing the differential expression of all genes in each individual MAG rather than comparing each gene to the entire metatranscriptomic dataset. We did this to more accurately represent each MAG’s genome-specific patterns of up- or down-regulation. We also transformed our time series variable using the cosinor model36,37 to circularize the 24-h cycle and reflect the biological reality that gene expression during nighttime hours should not be separated as it is in a linear numbering scheme beginning at midnight (Eq. 1).
where ({w}_{t}=frac{2pi t}{24}) and t was the original linear time value.
Salinibacter ruber chemostat culture and sampling
Salinibacter ruber strain DSM13855 (M31) was obtained from DSMZ and cultured in Salinibacter ruber medium 936 (DSMZ, Braunschweig, Germany)14. For chemostat culturing, 1.2 mL of S. ruber in exponential growth was added to 1.2 L of media in a bioreactor maintained at 37 °C with 340 rpm agitation and a flow rate of 17 mL h−1, illuminated by an LED grow light (FEDiCA, UFO 1000) in a grow tent to control for the effect of outside light. The culture’s doubling time was approximately 71 hours, equivalent to the medium replacement rate of the chemostat or 17 mL/h/1.2 L. This relatively slow equilibrium growth rate, compared to much faster exponential growth achieved using batch culturing methods, was a closer approximation of in-situ conditions in hypersaline brines, which are characterized by slow growth rates and low mortality11,38. In order to test circadian entrainment, we maintained the culture at 12 hour light/12 h dark conditions for one week. Following this entrainment period, we sampled for two days every 12 h and then continued sampling every 12 h under a regime of 24-h darkness for two more days to determine whether circadian patterns were still evident without a light stimulus. Samples were collected at the midpoint of the light or dark period. At each sampling point, duplicate 5 mL samples were extracted via 5 mL syringe and placed in sterile 15 mL falcon tubes. Tubes from dark samples were wrapped in aluminum foil to protect them from light. Samples were centrifuged for 10 minutes at 5000 rpm using a Centrifuge 5804 R (Eppendorf, Germany) and cell pellets were then suspended in 1.5 mL tubes with 100 μl of RNAlater stabilizer (Thermo Fisher Scientific, USA). Samples were then placed on dry ice and stored at −80 °C. A total of 16 samples were obtained (two from each collection point), and RNA was extracted and sequenced using the methods described above.
Analysis of RNA transcripts was performed by mapping transcripts to the Salinibacter ruber DSM 13855 reference genome (assembly ASM1304v1) using BWA-MEM and performing differential expression analysis using DESeq2. Two runs of DESeq2 were performed using the LRT model to test the effects of both light vs. dark while accounting for sampling time (full model = ~light+time, reduced model = ~time) and sample collection time while accounting for light (full model = ~time+light, reduced model = ~light). Finally, we performed a weighted gene correlation network analysis using the R package WGCNA39 to identify modules of genes sharing similar expression profiles and thus potential co-expression or coregulation. We used all genes in the dataset regardless of whether they were identified as differentially expressed, and performed one-step module detection with a signed network, a soft-thresholding power of six, and a minimum module size of 30. Network visualizations were generated using Cytoscape40.
Chemostat quality monitoring
Chemostat cultures were monitored using the Guava easyCyte™ Flow Cytometers (Luminex, TX, USA) before and during the experiment by sampling 1 mL from the chemostat culture. Triplicate samples were then created by adding 900 μl of PBS buffer, 100 μl of sample and 10 μl of glutaraldehyde to 1.5 mL tubes and storing at −20 °C before cell counts were performed on the flow cytometer. Cell density was 1.7 to 2.4 × 10⁶ cells/μL for all sampling points during the experiment. Additionally, Sanger sequencing of the 16S rRNA gene was performed to assess the purity of the culture.
Statistics and reproducibility
For the diel investigation of SBSW, differential expression testing was conducted across six timepoints within a twenty-four-hour window, utilizing six replicate sequencing datasets for each timepoint (see Nucleic acid extraction and sequencing) with DESeq2’s Likelihood Ratio Test. Transcript counts were normalized by DESeq2’s median of ratios method. This experiment is reproducible given appropriate permissions from the SBSW facility, although we note that the salinity of these concentrator ponds often changes due to internal facility use and management.
For the S. ruber chemostat, differential expression testing was conducted with DESeq2’s Likelihood Ratio Test on the factors of light vs. dark (light condition) and morning vs. evening (sampling time) across 8 total timepoints. We sequenced two samples of the batch chemostat culture (technical replicates) at each timepoint. We had two light and six dark sampling points, or four morning and four evening sampling points (Supplementary Fig. 2). Salinibacter ruber M31 is commercially available from the Leibniz Institute-DSMZ culture collections (DSM no. 13855).
Reporting summary
Further information on research design is available in the Nature Portfolio Reporting Summary linked to this article.
Results
Community structure & transcriptional activity
Our diel study focused on Site 12, a shallow hypersaline concentrator pond below NaCl saturation with a benthic mat. While temperature and oxygen concentration varied across the day-night cycle, water activity and pH measurements stayed fairly constant (Supplementary Table 2). Water activity was approximately 0.83, corresponding to an initial salinity measurement of 250.7 g L−1, while pH stayed between 8.2-8.3. The cell density of the brine on the date of our diel experiment was 2.72 x 10⁷ cells/mL, as previously reported (labeled Site III)38. While our samples were collected from the water column, our sampling apparatus was positioned above the benthic mat and captured transcriptional data from taxa abundant in the mat as well, likely through disturbance of mat material during the course of sampling or from the natural interchange of cells between the mat and water column (Supplementary Fig. 1).
The prokaryotic community of the water column was dominated by haloarchaea as well as halophilic bacteria. The most abundant archaeal ASVs belonged to Haloquadratum walsbyi, Halorubrum, Candidatus Nanohalobium constans, Halobaculum, and Natronomonas moolapensis (Fig. 2A). Abundant bacterial ASVs included Salinibacter ruber and Spiribacter curvatus. In contrast, mat and sediment samples were dominated by the halotolerant cyanobacteria Euhalothece natronophila, Salinibacter ruber, DPANN group nanoarchaea, and members of the bacterial family Rhodothermaceae. Other concentrator ponds at SBSW, which contributed to our MAG database, demonstrated a shift from bacterial to archaeal composition consistent with the decreasing water activity from the intake (Site 9) to just below NaCl saturation (Site 15, Supplementary Table 1). The eukaryotic community of the water column at Site 12 was dominated by the heterotrophic dinoflagellate Halocafeteria seosinensis, as well as autotrophic algae including Dunaliella salina and Chlorosphaeropsis alveolata (Fig. 2).
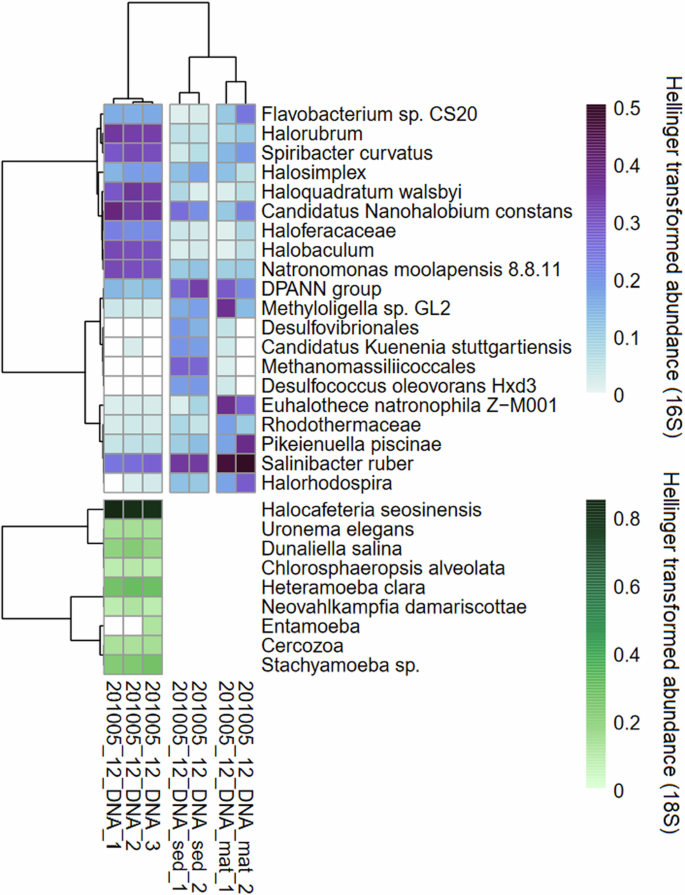
Represented by 16S rRNA gene abundance (prokaryotes) and 18S rRNA gene abundance (eukaryotes and fungi). Sediment and mat samples had <1000 total 18S reads and were excluded from further analyses. 16S and 18S rRNA gene abundances for all lakes at SBSW can be found in Supplementary Fig. 3. Hellinger transformation (square root of relative abundance) was used for color gradients for better visualization of rarer taxa, but dendrograms are based on untransformed relative abundance.
The transcriptionally active prokaryotic community of Site 12 was also dominated mainly by haloarchaea. Our dataset consisted of 180,973 genes from MAGs assembled from lakes at SBSW. Two MAGs, annotated as members of the Halomarina genus and the Halobacteriales genus SW-7-71-33 respectively, had the highest number of transcripts across all timepoints (Fig. 3) due to the high expression of a small number of unannotated or hypothetical genes. These potentially correspond to remnant rRNA or highly conserved sequences which mapped many transcripts from multiple species. Overall, the number of transcripts mapping to each MAG were relatively constant across all timepoints, indicating that the activity level of community members did not change significantly from day to night (Fig. 3).
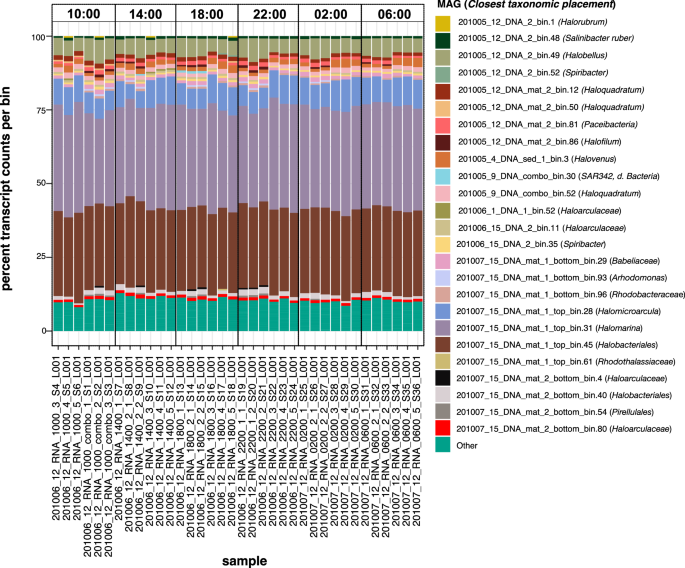
Shown as a proportion of the total reads recovered for each sample. Two genes representing ribosomes that were unsuccessfully filtered by ribodepletion, NODE_1943_length_16146_cov_30.276739_pgaptmp_000182 and NODE_2703_length_14133_cov_19.928612_pgaptmp_000886, were removed from the dataset before these calculations. Ribosomal identity was confirmed via manual BLAST searches. MAGs whose transcript counts were less than 0.5% of total reads in a sample are shown as “Other”.
We identified 2210 genes from 74 MAGs demonstrating significant differential expression (Benjamini-Hotchberg adjusted p-value < 0.05) across the day-night cycle using DESeq2’s Likelihood Ratio Test, corresponding to 1.22% of our total dataset. Of these, 406 genes had a fold change value of 2 or greater corresponding to a log2 fold change (L2FC) value of ±1. The heterogeneity of the environmental signal and/or lower read coverage of less abundant community members likely contributed to these overall lower fold change values. The majority of genes in our dataset were not identified as significantly differentially expressed and had extremely low transcript counts but still displayed some fold change between day and night (Fig. 4A). We selected the top 500 most variable genes across all samples in order to validate whether broad transcriptional changes were indeed due to day-night variance. When plotted using Principal Component Analysis, we found that differences in expression among highly variable genes drove the formation of two clusters: samples taken between sunrise (06:47) and sunset (18:24), and samples taken in the dark (Fig. 4B).
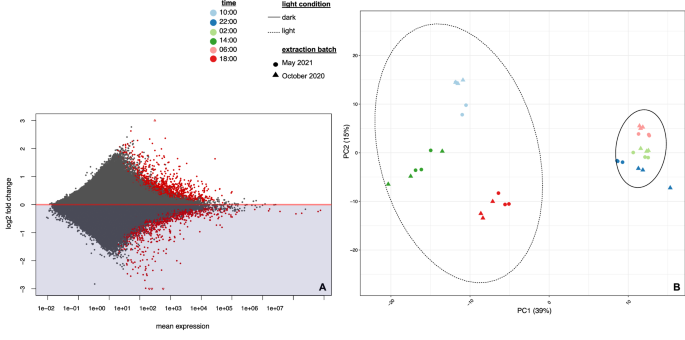
A MA plot of mean transcription vs log2 fold change for all genes in the SBSW dataset where each point represents one of 180,973 genes in the dataset. Negative log2 fold changes correspond to upregulation at night, while positive fold changes correspond to upregulation during the day. Red dots denote a Benjamini-Hotchberg adjusted p-value < 0.05. B PCA plot showing sample variation driven by the top 500 most variable genes, as selected by overall range in value between samples. This subset was chosen to validate whether the greatest differences between samples were indeed caused by a shift from day to night. Each point represents a replicate dataset used in our analysis. Percentages in axes represent the degree of between-sample variance explained by that axis.
Diel transcription patterns at SBSW
We found strong community-wide differential expression patterns driven by the day-night cycle. Several genes involved in aerobic respiration were significantly upregulated at night, including superoxide dismutases (SODs) which reached peak expression between 22:00 and 02:00. Fifteen genes belonging to multiple taxa were annotated as significantly differentially expressed, although none had a fold change greater than 2, indicating its overall constitutive expression (L2FC = -0.23 to -0.95, Fig. 5). Peak expression of SODs roughly coincided with the upregulation of key enzymes involved in the first carbon oxidation of the TCA cycle, including aconitate hydratase and isocitrate dehydrogenase, in several haloarchaea as well as two Rhodobacteraceae and Salinibacter ruber (Fig. 5). We also noted a concurrent higher expression of genes involved in the production of iron-sulfur clusters via the suf system, which are required for many enzymes involved in aerobic respiration, although these too had overall fold changes less than 2 (L2FC = -0.10 to -0.91, Fig. 5).
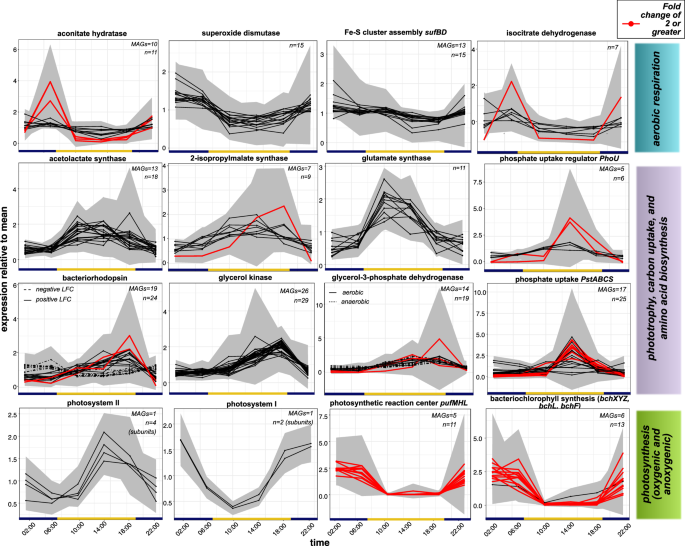
Lines indicate expression level relative to the base mean transcription of significantly differentially expressed genes, as calculated by DESeq2. Lines in red highlight genes with a fold change of 2 or higher (corresponding to log2 fold change value of ±1 or greater). Gray shading indicates standard error across six replicate samples for each time point. The total number of differentially expressed genes (Benjamini-Hotchberg adjusted p-value < 0.05, n) and the number of MAGs containing these genes (if these differ) is noted on the top right-hand corner of each plot.
We observed the opposite regulatory pattern for genes involved in anabolic pathways including carbon and phosphate assimilation as well as amino acid biosynthesis. Twenty-nine glycerol kinase genes belonging to haloarchaeal genera including CBA1134, Salinigranum, Halovenus, A07HB70, and other members of those families, as well as the bacterial genera Salinibacter and Spiribacter, reached peak expression between 14:00 and 18:00, although none had a fold change of 2 or greater (L2FC = 0.40 to 0.93, Fig. 5). Most of these genes were specifically identified as glpK. We also detected the upregulation of both aerobic and anaerobic glycerol-3-phosphate dehydrogenases around the same time (Fig. 5). Several genes involved in amino acid biosynthesis, including 2-isopropylmalate synthase, glutamate synthase, and acetolactate synthase (ilvB/N), were also upregulated during the day in many haloarchaea as well as Salinibacter (Fig. 5). In addition, phosphate assimilation via the transporter system pstSCAB peaked around 14:00 (Fig. 5) in genes belonging to several haloarchaea including Salinigranum, Haloquadratum, Halovenus, Natronomonas salsuginis, Halomicroarcula,QS-4-70-19, and Halorubrum. The associated regulator phoU was also upregulated in Halorubrum and Natronomonas MAGs.
Interestingly, we observed diverse regulatory patterns for genes involved in phototrophy and photoautotrophic carbon generation. We detected differential transcription of Photosystem II and Photosystem I genes belonging to a single MAG annotated as the halophilic Cyanobacterium Halothece. Photosystem II transcription peaked at midday (Fig. 5) while Photosystem I transcription in that same MAG peaked closer to midnight, although none of these genes had a fold change greater than 2 (L2FC = 0.17 to 0.74 for Photosystem II and -0.3 for Photosystem I). Additionally, transcription of the anoxygenic light-harvesting complex pufMHL as well as the genes involved in bacteriochlorophyll synthesis, attributed mainly to the Pseduomonadata genera Halofilum and Roseovarius, peaked between 02:00-06:00 with extremely high fold change between day and night (Fig. 5). Finally, we identified rhodopsin genes from several haloarchaea (including Halorubrum, Natronomonas, Halovenus, Halobellus, and Halomicroarcula) with peak expression levels occurring right before sunset (around 18:00), of which two had a fold change of 2 or greater (Fig. 5). Ten other rhodopsin genes had slightly elevated expression at night or in the early morning, peaking at 06:00, but with lower overall fold change values (L2FC = -0.18 to -0.50, Fig. 5). There was no taxonomic difference between genes with peak expression at sunrise versus sunset.
Light-dependent gene expression of Salinibacter ruber and comparison with environmental MAGs
To validate some of our findings and further investigate the partitioning of oxygen-sensitive gene expression at SBSW, we performed a controlled culture experiment using a halophilic representative organism, Salinibacter ruber strain M31 (DSM13855). Unlike previous work done on Halobacterium salinarum, we did not find diel oscillation of gene expression under 24 hr dark conditions (free-running rhythm)12. Our DESeq2 results analyzing the effect of sampling time alone found some differentially expressed genes (209 out of 2,968), but light condition had a stronger effect on gene expression, with 44% of genes (1297 out of 2968) displaying significant differential expression (Benjamini-Hotchberg adjusted p-value < 0.05) between light and dark conditions. However, the shorter timeframe of our experiment, as well as the sequencing of duplicate rather than triplicate samples from each time point, means that these results are a conservative estimate of diel transcriptional changes in Salinibacter ruber.
We compared these significantly differentially expressed genes in culture to the expression patterns of three Salinibacter MAGs in our database, one of which (201005_12_DNA_2_bin.48) was specifically annotated as Salinibacter ruber (Supplementary Table 3). There were many notable similarities between expression patterns in cultured S. ruber and the whole-community results discussed previously. Superoxide dismutase displayed increased expression under dark conditions in the cultured organism as well as two out of three MAGs (Fig. 6). We performed weighted gene correlation network analysis to identify genes with similar expression profiles to superoxide dismutase, which included several involved in aerobic respiration, Fe-S cluster assembly, transcriptional regulation, and universal stress responses (Supplementary Fig. 4). Additionally, aconitate hydratase and isocitrate dehydrogenase displayed similar expression profiles to superoxide dismutase (Fig. 6, Supplementary Fig. 4). Genes that demonstrated increased expression under light conditions in both cultured S. ruber and environmental genomes included glycerol kinase, phosphoenolpyruvate synthase, and acetolactate synthase. Interestingly, 2-isopropylmalate synthase was upregulated in two environmental MAGs but not in the cultured S. ruber strain (Fig. 6). Finally, we observed upregulation of light-sensitive cryptochromes and photolyases in both environmental and cultured genomes (Fig. 6).
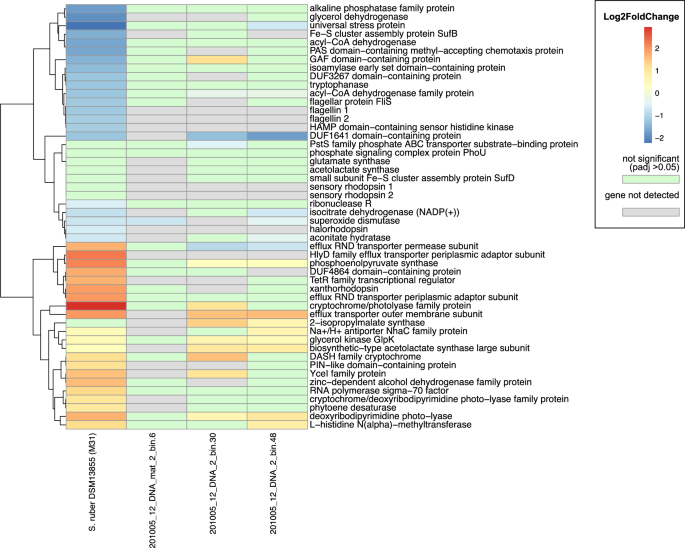
Positive log2 fold change indicates upregulation under light conditions, while negative log2 fold change indicates downregulation under light conditions. Genes shown were either identified as genes of interest from SBSW analysis or had the greatest log2 fold change and/or the smallest p-values in the Salinibacter ruber culture experiment.
Our culture experiment identified many genes with strong differential expression that were not detected in environmental MAGs. This could be due to a lack of enough sequencing coverage in SBSW to capture these patterns, the incompleteness of our Salinibacter MAGs (which were 80.4%, 94.2%, and 88.7% complete), or the chemical and/or biological differences between environmental and culture conditions. We did not detect differential expression of sensory rhodopsin or xanthorhodopsin genes in our Salinibacter MAGs, but we did observe significantly higher expression of a putative xanthorhodopsin in cultured S. ruber under light conditions (Fig. 6). Interestingly, we did not see upregulation of expression of the other three retinal-binding proteins in the cultured S. ruber genome, two of which are sensory rhodopsins and the other an inward-driven chloride pump. The identities of these rhodopsin genes were confirmed by examining their sequence similarity and gene neighborhoods in order to determine which rhodopsin function was significantly upregulated41.
Finally, many genes of unknown function were strongly up- or down-regulated in the S. ruber culture (Fig. 6). Only one, a DUF1641 domain-containing protein, was similarly upregulated in the dark in our MAGs. We also observed the increased expression of several genes in S. ruber under dark conditions that were not detected or not differentially expressed in our MAGs, including a universal stress protein, several flagellar genes, and glycerol dehydrogenase (Fig. 6).
Discussion
Previous work on understanding oxygen dynamics in hypersaline salterns has observed that community respiration rate decreases with illumination42,43. This result is interpreted as a shift in energy yielding strategy from the respiratory chain to the light-powered bacteriorhodopsin pump, suggesting that photoinhibition decreases the respiration of organic substrates by halophilic archaea during the day43,44. Importantly, light serves as a dual regulator of oxygen concentration in this context: both as a stimulator of oxygen-producing photosynthesis and as a suppressor of oxygen-consuming respiration. Therefore, the oxygen concentration in the saltern becomes more saturated during the day and is depleted at night, a pattern supported by our dissolved oxygen measurements (Supplementary Table 2). As the solubility of oxygen is greatly decreased in concentrated brines, oxygen limitation may be an important stressor for halophilic communities, which broadly adopt an aerobic heterotrophic lifestyle45. Thus, diel transcriptional regulation, facilitated by photosynthetic autotrophs and photoinhibition of respiration in heterotrophic halophiles, may help facilitate sufficient buildup of molecular oxygen in brines to support these diverse communities.
Our results provide transcriptional evidence to support this hypothesis in many important ways (Fig. 7). The differential regulation of superoxide dismutases (SODs) under dark conditions was an intriguing indicator of the increased presence of reactive oxygen species (ROS). These may be generated by oxidative metabolism, UV radiation, and other abiotic and biotic reactions and can cause damage to membrane lipids, DNA, and enzymatic metal centers46,47. The increased transcription of genes encoding SODs could be due to an increased rate of aerobic respiration, which would generate additional oxygen radicals. Indeed, recent work has found that the buildup of ROS due to aerobic respiration creates a significant stressor for cells and requires a vigilant detoxification response48,49. Corollary to this, we detected upregulation of key genes involved in the citric acid cycle, aconitate hydratase and isocitrate dehydrogenase. Aconitate hydratase is known to be extremely sensitive to radical damage, as its [4Fe-4S] cluster is inactivated by superoxide. In fact, it is so critically influenced by oxygen toxicity that it can be used to indirectly measure radical concentration within cells50. The upregulation of genes involved in iron-sulfur cluster assembly in the dark also supports this hypothesis, as iron-sulfur clusters are among the most ancient and widespread metal cofactors in biological enzymes51 and used widely in the respiratory chain52. Although SODs and suf genes did not display very high fold-change levels between day and night, this could be due to their fundamental necessity to and diverse uses in cell functioning, which required a baseline level of transcription at all times.
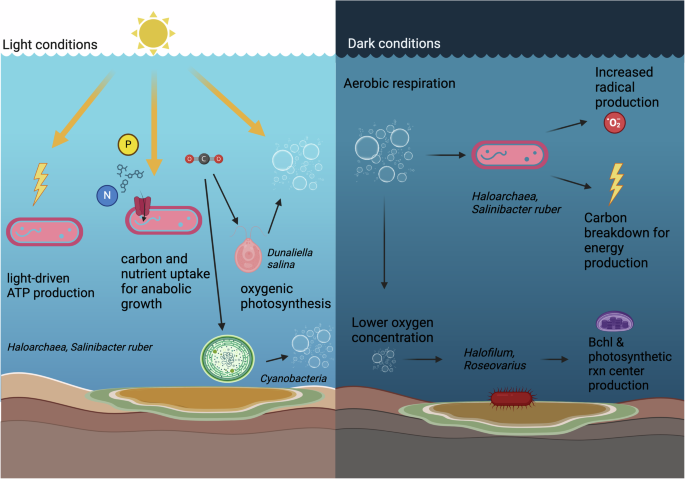
Created in BioRender. Weng, M. (2025) https://BioRender.com/q56f501.
Despite the upregulation of genes associated with aerobic respiration at night we found that expression of carbon assimilation genes increased during the day, suggesting that halophiles may utilize this carbon for anabolism and growth rather than ATP production. This type of metabolic switching has previously been documented in aerobic anoxygenic phototrophs, which partition respiration and anabolism with accordance to light availability53. Here, we observed upregulation of glycerol kinase expression under light conditions, peaking at midday, in several haloarchaea as well as Salinibacter and Spiribacter MAGs. We also detected the upregulation of both aerobic and anaerobic glycerol-3-phosphate dehydrogenases around the same time. Glycerol is a key carbon substrate in hypersaline environments, produced primarily by Dunaliella salina as an osmoprotectant and utilized extensively by heterotrophic haloarchaea such as Haloquadratum walsbyi as well as Salinibacter ruber54. The hypothesis that these organic substrates contribute to growth and biomass building under light conditions was further supported by the observed upregulation of several genes involved in amino acid biosynthesis. These include glutamate synthase, which mediates assimilation of inorganic nitrogen by conversion of a-ketoglutarate and ammonia55, acetolactate synthase, which catalyzes the first step in branched-chain amino acid synthesis56, and 2-isopropylmalate synthase, a key enzyme for leucine biosynthesis57.
Finally, we observed complex patterns in the expression of retinal-binding proteins at SBSW. The majority of the rhodopsin genes in our differentially expressed dataset were most highly expressed at mid to late afternoon. Additionally, we found clear upregulation of xanthorhodopsin under light conditions in our S. ruber culture, although the other three genes encoding retinal-binding proteins were not significantly differentially expressed or slightly downregulated. However, we also identified ten rhodopsin genes in SBSW that had low overall fold changes but were slightly upregulated toward early morning, with peak expression around 06:00. Interestingly, a previous transcriptional study found that bacteriorhodopsin was constitutively expressed in Haloquadratum walsbyi regardless of light condition58. The expression of the bacteriorhodopsin bop can be induced by both light and low oxygen concentration59, and thus the conflicting signals of low nighttime oxygen and high daytime light may contribute to the heterogeneous expression of rhodopsins at SBSW. Alternatively, bacteriorhodopsins have been found to be extremely stable under a wide range of challenging conditions, and therefore these transcriptional patterns may not correspond accurately to cellular concentrations of protein60.
In addition to rhodopsins, we also saw broad differences in expression across the day-night cycle in other light-harvesting genes. These genes, representing both oxygenic and anoxygenic photosynthetic strategies, belonged to taxa that were identified as highly abundant in the Site 12 benthic mat and less abundant in the water column. We observed that Photosystem II subunits belonging to a Halothece MAG were most highly expressed at midday, while Photosystem I subunits from the same Halothece as well as anoxygenic photosynthetic reaction centers belonging to Halofilum and Roseovarius were most highly expressed at night. Differential regulation of oxygenic and anoxygenic photosynthesis has been previously observed in hot spring mat environments, where it is hypothesized that anoxygenic photosynthesis is more abundant earlier in the day in order to avoid oxygen build-up from aerobic photosynthesis4. Light concentration may also play a role in the split regulation of Photosystems I and II: Photosystem I can be downregulated under high light intensity relative to Photosystem II in order to avoid photooxidative damage61, and diel differences in PSI and PSII expression in other environments have previously been noted62.
Results from our diel culturing experiment with S. ruber confirmed the differential regulation of key genes associated with aerobic respiration and anabolism, suggesting that diel partitioning of expression can persist in both natural environments and controlled culture settings. This separation may be influenced by photoinhibition of respiration, which has been previously observed in both culture and environment, as well as the efficient use of light and organic carbon resources produced by photoautotrophs. Interestingly, we did not observe circadian entrainment in S ruber despite the detection of free-running rhythms in Halobacterium salinarum12, suggesting that internal regulation of diel expression may be variable among halophilic organisms. We also observed differences in expression between cultured and environmental S. ruber populations, including the dark upregulation of flagellar proteins in culture which were not detected in environmental MAGs. Previous work has demonstrated that the differences in environmental stimuli between the natural and culture environment significantly alters the gene expression profile of cultured strains63. Genome composition is likely varied between wild and cultured ecotypes, and previous work at SBSW have demonstrated the importance of microdiversity in ecological succession at increasing salinities11. Therefore, the combined study of environmental communities as well as model organisms is crucial for capturing both interrelationships among community members as well as functional variation within populations of the same species.
Light cues regulate community-wide transcription of metabolically relevant genes at SBSW, indicating a potential shift from light-powered ATP generation powering anabolic processes during the day to aerobic respiration in the dark (Fig. 7). These cues are likely interpreted through complex regulatory networks that include light-sensing proteins such as rhodopsins, transcriptional regulators, and potentially internal circadian ‘clock’ genes. However, it should be noted that the transcriptional signals we measured at SBSW and in S. ruber chemostat culture may be modulated by post-transcriptional and post-translational activity. Future work on the expression patterns and potential metabolic shifts noted here should focus on verification of metabolic products and links between activities and the taxa that perform them. Previous studies have noted the difficulty of directly estimating primary productivity and aerobic respiration in hypersaline systems42, and thus developing these methods will be essential for greater insight into these environments.
This study highlights the importance of studying diel cycles in hypersaline environments to more fully understand how functional shifts in oxygen use are modulated by light cues across species, and opens avenues for future work to untangle these as-yet-undefined regulatory networks and determine the extent and diversity of true circadian phenotypes in hypersaline environments. This work was conducted as part of a larger exploration of brine lakes by the NASA Oceans Across Space and Time team11,38, which surveys diverse environments to better understand hypersaline microbial communities on Earth and the potential habitability of ocean world brines. Our findings demonstrate the dynamic stability of halophilic communities facilitated by their metabolic flexibility, and the degree to which microbial and geochemical processes are intertwined. Halophiles not only adapt to the challenges of their world but also play an active role in creating the conditions under which they thrive.

Responses