Comprehensive genomic dependency landscape of a human colon cancer organoid

Introduction
Colon cancer development often follows activating mutations in oncogenes like CTNNB1, BRAF, KRAS, or PIK3CA1,2. However, the majority of colon cancers are initiated by the loss of function of tumor suppressor genes, such as APC, mismatch repair genes and TP53. Targeting the loss of function of tumor suppressor genes has been challenging, as the absence of something is often considered ‘undruggable’3. However, this notion is evolving, especially with the sensitivity of homologous recombination-deficient cancers to PARP inhibitors like Olaparib4. These developments, alongside advancements in synthetic lethality screening and CRISPR-based gene editing, offer new avenues for identifying novel targets that can be elucidated when tumor suppressor genes are lost. For example, functional genetic screening identified that the loss of mismatch repair in cancer cells create dependencies on specific proteins like WRN helicase5,6,7. This success encouraged us to search for additional genetic dependencies exploitable as therapeutic targets in colon cancer.
A cancer genetic dependency generally refers to a gene essential for the proliferation and/or viability of cancer cells8. Genome-wide CRISPR dropout screening in human cancer cell lines can reveal dependencies that could be therapeutically exploited9. CRISPR/Cas9 knockout screening on two-dimensional model systems provides valuable insights into genetic dependency for tumor cell lines10,11. CRISPR/Cas9 knockout screening on three-dimensional organoid models12 may reveal additional insights not apparent in 2D cell lines. Organoids are self-organizing mammalian adult stem cells and are strong tools for ex vivo tissue morphogenesis and organogenesis simulations13. If used in CRISPR/Cas9 knockout screens, organoids could lead to the discovery of personalized synthetic lethal interactions tailored according to the somatic mutations present in specific colon cancers. Results obtained from colon organoids may better predict what can be translated into real human tumors14. We used colon cancer organoids to perform a genome-wide CRISPR dropout library screen and to validate select candidate genes dependencies. During a CRISPR knockout library screen, the appearance of gene dependency might be influenced by the other genetic characteristic of the cell line15. One example of this phenomenon is the functional state of TP53 in a cell. When TP53 is wild-type, cells can undergo apoptosis or arrest in response to the double-strand breaks caused by the Cas916,17,18,19. This can lead to difficulties in detecting true gene essentiality in TP53 wild-type (TP53-WT) cells because double-strand breaks are more toxic and lead to gene-independent effects16,20,21. To overcome this confounding factor, we created isogenic pairs of colon tumor organoids using a two-vector system strategy22 to generate TP53 knock-out (TP53-KO) in situ during the library screen. In this system, the anchor vector construct expresses guides for TP53 but has no Cas9 gene. Anchor vector-dependent TP53 knockout only occurs upon delivery of the library (Brunello)23 of guides a vector that also encodes the Cas9 nuclease. This allowed us to interrogate gene dependencies within the contexts of both TP53-WT and TP53-KO backgrounds. We used comprehensive gene expression analysis to focus dependency mapping on genes that were expressed in the model system and whose dependency did not depend on the presence of wildtype TP53. This strategy enabled us to exclude the gene-independent, TP53-mediated apoptosis response to double strand breaks.
Using our screening platform, we were able to identify several expected synthetic lethal interactions between WNT, MAPK, PI3K and mismatch repair pathway mutations and we also found 13 novel targets likely unique to mutations present in the organoid model. We validated 5 targets in an additional organoid model. These findings support the potential use of functional genomic screening of patient-derived cancer organoids to determine personalized treatment strategies.
Results
Human colon cancer organoid model system
We characterized the somatic mutation landscapes of two colon cancers by whole exome sequencing of tumor-derived organoids and their matched normal organoids. We selected a tumor organoid (F147T) for library screening that had high microsatellite instability (ProPath) indicative of mismatch repair deficiency. This tumor has notable somatic mutations in the DNA-repair pathway24,25,26 genes MLH3, MSH3 and in RNF4327, BRAF28, and PTEN genes29 (Table 1 and Supplementary Data 5). We selected another tumor (F130T) for validation studies that was microsatellite stable indicative of mismatch repair proficiency. This tumor had notable somatic mutations in different driver genes (Table 1 and Supplementary Data 5). We prepared a genome-wide CRISPR dropout library screening (Brunello)23 system in F147T organoid using a two-vector strategy to generate TP53 knockout isogenic derivatives in situ during the library screen22. In this system, an anchor vector construct expresses dual guides for TP53 but has no Cas9 gene. Anchor vector-dependent TP53 knockout only occurs upon delivery of the library (Brunello) of 78,000 unique guides in lentiCRISPR v2.0, encoding Cas9 (Fig. 1a, b)30. We first created stable derivatives of the F147T organoid harboring either a TP53 anchor vector (TP53AV) expressing dual TP53 gRNAs or an empty anchor vector (EAV) negative control. To test the efficiency of the anchor vector system to generate TP53 Knockouts, we transduced each derivative with a lentiviral vector expressing Cas9 (empty lentiCRISPR v2.0) and measured the acquisition of nutlin resistance, and the changes to the gene expression landscapes (Fig. 2a–d). The interaction between TP53AV and lenti-CRISPR v2.0 efficiently converted nutlin-sensitive organoids to nutlin resistance, whereas the interaction between the EAV and lenti-CRISPR v2.0 did not convert to nutlin resistance (Fig. 2d). Out of 21,451 annotated genes detected by RNA-Seq, 3974 were significantly different between TP53-WT and TP53-KO in the presence of nutlin AND significantly different between control and nutlin treatment in TP53-WT organoids (Fig. 2a, b, f, and Supplementary Data 1). Figure 2c shows the loss of nutlin-responsiveness of known TP53 target genes upon TP53-KO. A list of the top 334 most TP53-dependent genes are show in Supplementary Data 1.

a The two vector used for the Brunello library screen. The anchor vector was used to create isogenic organoids. b Schematic of the two-vector approach in the Brunello library screen. Anchor perturbation is shown in red and library perturbations are shown in other colors (Created with BioRender.com).
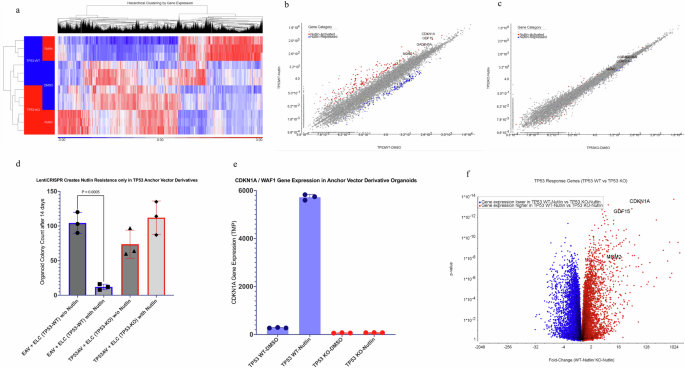
a Heatmap of 3974 genes showing differential expression between TP53-WT and TP53-KO in the presence and absence of nutlin (20uM). Red color represents a higher expression level. Blue color represents a lower expression level. b, c Nutlin-activated (red) and nutlin-repressed (blue) genes (FDR p < 0.05) in the presence and absence of nutlin (20uM) in TP53-WT (b) and TP53-KO (c) derivatives of F147T. Nutlin activated and repressed genes are tabulated in Supplementary Data 1. d Colony formation assay for TP53-WT and TP53-KO derivatives of F147T organoids grown in the presence and absence of nutlin (20uM) for 14 days. e Gene expression level (TMP) of a known TP53 response gene, CDKN1A (WAF1), in both TP53-WT and TP53-KO organoids after 14 days in presence and absence of nutlin (20uM). f Volcano plot representing the expression distribution of TP53 response genes.
As expected, nutlin-treated EAV derivatives showed robust activation of known TP53 response genes like CDKN1A (WAF1)31 whereas TP53AV derivatives failed to activate TP53 response genes in the presence of nutlin (Fig. 2e, f).
Genome-wide CRISPR-Cas9 screen
We screened the Brunello library in quadruplicates for each anchor vector derivative with at least 50X coverage for each replicate. Cultures were sampled at Day7, Day21, and Day36. At each time point, we prepared genomic DNA and PCR amplified the guides and sequenced the amplicon on the Illumina platform (BROAD Genomics Perturbation Platform). The abundance of each guide was determined by counting each unique gRNA sequence. We visualized gRNA depletion over time as the log fold change relative to Day7 (Fig. 3a) As expected, gRNAs targeting DepMap common essential genes were under significant negative selection. Overall, a greater percentage of DepMap common essential genes (19%) (https://depmap.org) were under negative selection than were those not known to be common essential genes (5%) (Fig. 3b and Supplementary Data 2). Overall, we identified 8523 guides from 6897 genes that were significantly depleted in both TP53-WT and TP53-KO and were not classified as DepMap common essential genes (Fig. 3c, green data points). Several gene dependencies were related to cancer gene pathways and were located downstream of somatic mutations observed in the tumor. These dependencies are opportunities for highly specific targeted therapeutic interventions (Fig. 3e)32. Select tumor-dependent candidates subjected to validation studies are shown in Fig. 3c, red data points.
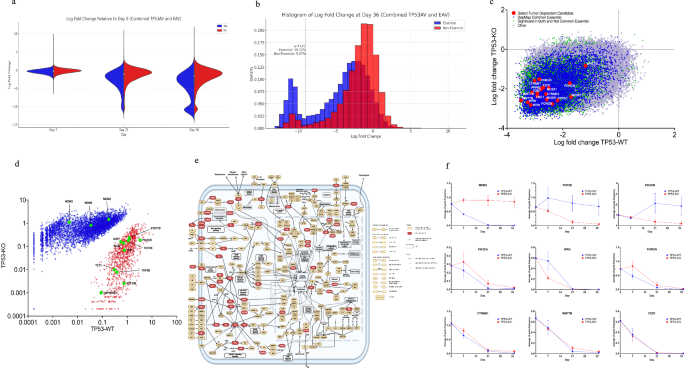
a The distribution of essential guides (blue) vs non-essential guides (red) over time, shown by the average log-fold change of guides frequency relative to Day0. At the early time point (Day 7), essential and non-essential guides are equally distributed, whereas at the later time point (Day 36), their distribution differs significantly. b Histogram of the distribution plot. c Select tumor-dependent candidates. Shown is the comparison of average log-fold change of guide frequencies at late time points vs early time points. The colors represented different categories; blue are guides targeting DepMap common essential genes, green are guides significantly depleted in both TP53-WT and TP53-KO, red are select significant and interesting tumor-dependent guides targeting WNT or WRN pathway genes. PPP6C was marginally significant but was included in validation because it was in the WRN pathway. d TP53-dependent plot conducted by comparison of average of guides frequency at late time points (D21 and D36) between TP53-WT and TP53-KO background (p < 0.05). Red color shows 3412 guides significantly depleted in the TP53-KO compared to the TP53-WT. Blue color shows 6116 guides significantly depleted in the TP53-WT compared to the TP53-KO. e Cancer pathways showing CRISPR screen dependencies in red (Created with BioRender.com). f Dot plot of select significantly depleted guides (p value < 0.05). MDM2 (three significant guides, CAACATCTGTTGCAATGTGA; TACCATGATCTACAGGAACT; GAGAACATTACCGGATTCGA), TOP2B (two significant guides, ATGATTATGACCGATCAGGT; ATCAACGTGTAGAGCCTGAG), PIK3CB (two significant guides, TGTAGCGTGGGTAAATACGA; AAAAATGCGCAAATTCAGCG), PIK3CA (one significant guides, GGATTTAGCTATTCCCACGC), WRN (two significant guides, ATCCTGTGGAACATACCATG;TAGCATGAGTCTATCAGATG), PORCN (three significant guides, GGAGCTGCCTCGGTCAATGG; TAGCTGTGGAAGGATATCCA; GTGACATGGCACAAGATGCG), CTNNB1 (two significant guides, AAGGTTATGCAAGGTCCCAG; CAACTGGTAGTCCATAGTGA), WNT7B (three significant guides, GAAGACGGTCTTCTCGCCGA; GTCGATGCCGTAACGCACGT; CAAGGGAACCTGAGCAACTG), FZD7 (two significant guides, TCGCACAGAGAACGACACGG; CTGCGTGGGCCAGAACACGT). X-axis shows days in the culture. Y-axis shows Average of significant guide frequencies in 4 replicates of each derivative.
We observed several WNT pathway dependencies, including PORCN33, FZD734,35, WNT7B34,36, DVL37,38, CTNNB139,40,41, and TCF7L240,41,42. These dependencies likely resulted from RNF43 inactivating somatic mutation38 and subsequent hypersensitization of the tumor to its own endogenously-produced WNT ligand. RNF43 encodes an E3 ubiquitin-protein ligase that negatively regulates the Wnt signaling pathway by reducing the membrane level of Frizzled43. Inactivating somatic mutations to RNF43 occur most frequently in microsatellite-unstable colorectal tumors27. LGK974 is a drug that targets the Wnt-specific acyltransferase porcupine (PORCN) and blocks maturation of endogenous WNT ligand38. In this study, our RNF43-mutated organoid model (F147T) grown without external Wnt supplementation demonstrated significant dependency on PORCN. This indicates that this tumor has the capability to activate the Wnt pathway using its own WNT ligand, thereby operating through an autocrine instead of paracrine mechanism33 .Targeting PORCN with small molecule inhibitors such as LGK974 or wnt-c59 could be a new therapeutic option for RNF43-mutant colorectal tumors. Elevated expression of FZD7 and WNT7B in pancreatic cancer tissues correlates negatively with survival, and their knockdown inhibits pancreatic cancer stem cells’ proliferative capacity34,35. We found that knocking out FZD7, WNT7B, DVL, CTNNB1, or TCF7L2 (a member of the TCF/LEF family of transcription factors) proves fatal to an RNF43-mutant colon tumor (Fig. 3f). This suggests that targeting any of these elements in the Wnt pathway could offer a viable therapeutic approach for treating RNF43-mutant human colon tumors.
Tumor F147T has inactivating somatic mutations to the PTEN tumor suppressor gene, which normally negatively regulates the activity of the PI3K/AKT/mTOR pathway29,44,45. To initiate this signaling cascade, three p110 lipid kinase subunits, p110α (encoded by PIK3CA), p110β (encoded by PIK3CB), and p110δ (encoded by PIK3CD), phosphorylate PIP2 to produce PIP3 which then enhances cell proliferation29. In our study, we observed a dependency on PIK3CA and PIK3CB in our PTEN-deficient tumor organoids (Fig. 3f). We also noted a heightened dependency on PIK3CB in TP53-KO derivatives (Figs. 3d, f, 4c, d). This observation suggests that targeting PIK3CB in PTEN/TP53-double mutant tumors could be therapeutically effective.
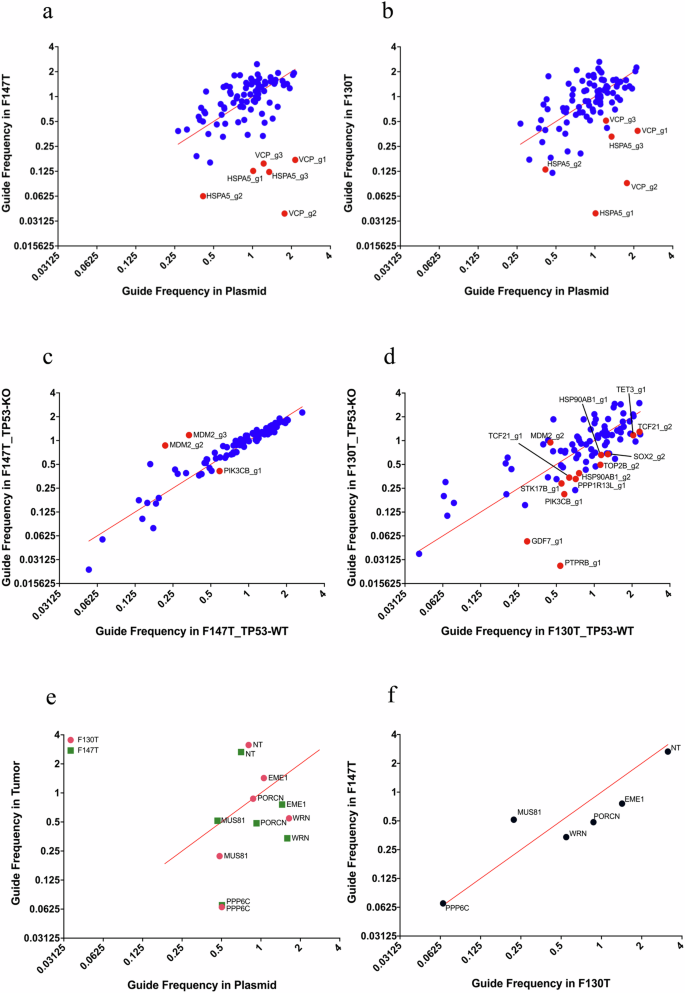
a, b Library-1 guides depletion effect in F147T and F130T compared to the plasmid. X-axis shows guide frequencies in pDNA. Y-axis shows guide frequencies in tumors. Red color represents gRNAs targeting DepMap common essential genes included in the mini library. Blue color represents gRNAs targeting all the other genes in the mini library. c, d Comparison of library-1 guides depletion effect in TP53-KO vs TP53-WT in F147T (MSI) and F130T (MSS). X-axis shows guide frequencies in TP53-WT tumors. Y-axis shows guide frequencies in TP53-KO tumors. Red points are significantly depleted guides, defined as those that were more than one standard deviation away from the diagonal line of identity. e, f The data from same experiment are plotted in two different ways. Guides depletion effect in both tumors compared to the pDNA (e), and comparison between two tumors (f).
Consistent with recent reports5,6,9, we noted significant Werner’s gene dependency, which likely resulted from mismatch repair deficiency. Published studies also revealed a critical mechanistic role of EME1 activity in facilitating chromosome shattering associated with WRN deficiency in MSI tumors46. Interestingly, our results show EME1 loss alone proves fatal to MSI tumors under conditions of WRN proficiency while PPP6C knockout was found to be lethal to both MSI and MSS tumor models (Figs. 3c, 4e, and f).
TP53 synthetic lethal interaction
The above dependency landscape focused on guides under significant negative Darwinian selection in both TP53-WT and TP53-KO derivatives. To detect potential synthetic lethal genetic interactions with TP53 loss, we identified guide knockouts with TP53-dependent effects on Darwinian fitness (Fig. 3d, f and Supplementary Data 2). Notable examples are highlighted in Fig. 3f, and include PIK3CB and TOP2B. Type II topoisomerases (TOP2), catalyze reversible DNA double-strand breaks (DSBs)47,48. TOP2B is one of the TOP2 isoforms and may be a promising target for additional studies focused on understanding the mechanistic interactions and potential therapeutic implications for TP53-mutant tumors using the existing small molecules inhibitors.
Overall, our data suggest that genome-wide CRISPR knockout library screening on human colon cancer organoids could serve as a promising platform for discovering personalized or pathway-based therapeutic targets.
Genetic validation of the Brunello CRISPR knockout screening
We tested select dependency candidates by creating two focused mini libraries (library 1 and library 2). Library 1 was a single guide oligonucleotide pool22 of 90 clones, and Library 2 used a dual guide collection49 of 15 clones (Supplementary Data 3). Both libraries consisted of the best Brunello guides in lentiviral constructs30. We introduced these mini libraries into two colon tumor organoids (F147T and F130T) in triplicate selected with puromycin for 7 days and maintained the population for an additional 7 days. Time point samples were taken at Day 7 and Day 14 after transduction. We collected cells and prepared genomic DNA and counted the library guides using PCR and Nanopore amplicon sequencing. The gRNA depletion was determined by unique gRNA sequence counting and normalizing these counts to the average counts from all guide sequences within each sample (frequency). The frequencies of all guides in the plasmid library were also determined and used as a control (Fig. 4a–f). Knockout of DepMap-known common essential genes and MDM2 both had the predicted effects. Validated TP53-synthetic lethal interactions include TOP2B, PIK3CB, GDF7, PTPRB, STK17B, PPP1R13L, HSP90AB1, TCF21, SOX2, and TET3, as shown in Fig. 4c, d. From Library 2, we verified that knocking out selected genes downstream of the somatic mutations present in these tumors results in tumor-specific synthetic lethality (Fig. 4e and f), including PORCN (interacting with RNF43 mutation), and WRN and EME1 (interacting with microsatellite instability.
Pharmacological validation of the Brunello CRISPR knockout Screening
To investigate pharmacological interactions with TP53, we engineered a screening platform to query TP53-WT and TP53-KO simultaneously and screened the NCI Approved Oncology Drug Set VI of small molecule cancer therapeutics, which included 9 topoisomerase inhibitors. This experiment was done on a mixture of TP53-WT (created by transduction Empty Anchor Vector (EAV) with Empty lenti-Crispr (ELC)) and TP53-KO (created by transduction TP53 anchor Vector (TP53AV) with Empty lenti-Crispr (ELC)). These organoids were derived from the same F147T anchor derivatives that were used for the Brunello library screen and RNA-sequencing experiments. We applied a simple high-throughput organoid plating method50 of a 50/50 mixture of TP53-WT and TP53-KO organoids. Mixtures were then treated with four different drug concentrations over a span of 10 days, refeeding every two days. After the treatment was completed, we prepared genomic DNA used multi-color qPCR targeting unique sequences in the two different anchor vectors to determine TP53-WT and TP53-KO quantities in each well (see drug data analysis in method). Figure 5a shows the different drugs responses on both TP53 backgrounds, emphasizing topoisomerase inhibitors. We discovered that out of 127 FDA-approved drugs, only 34 of them had a noticeable effect (Fig. 5a). The sunburst chart in Fig. 5b shows the categorization of these 34 therapeutic agents, stratifying them initially based on the maximal effect relative to TP53 status, revealing a distinct difference between TP53-KO and TP53-WT responses categorized according to their respective targeted mechanisms of action. Microtubule disruptors and proteasome inhibitors selectively affected TP53-WT organoids, while ribonucleotide reductase inhibitors and topoisomerase inhibitors selectively affected TP53-KO organoids. Among the 34 drugs showing any negative effects, 9 were topoisomerase inhibitors showing selectivity toward the TP53-KO organoids relative to their TP53-WT analogs. To further investigate the effects of topoisomerase inhibitors, we performed a second screen using seven different drug concentrations to cover a wider dose-response range. This confirmed that topoisomerase inhibitors Etoposide, Teniposide, Topotecan, and Daunorubicin disproportionately affect TP53-KO organoids, while nutlin and cisplatin both showed the expected selective effect on TP53-WT organoids (Fig. 5c)51, These results support the conclusion that genetic knockout of TOP2B (Fig. 4d) is phenocopied by several small molecule inhibitors of Topoisomerase.
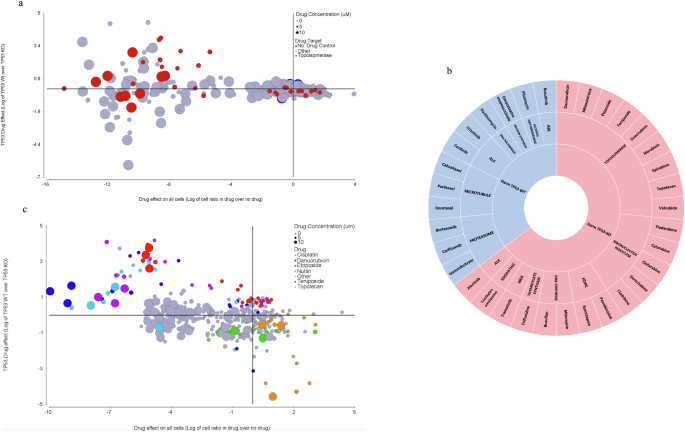
a Drug screen of 127 FDA approved therapeutic agents in TP53-WT and TP53-KO background of F147T organoid, topoisomerase inhibitors are highlighted in red, and no drug controls are in blue. Circle sizes correlate with different drug concentrations. On the X-axis, a negative number means fewer total cells in the presence of drug compared to DMSO. On the Y-axis, a positive number means more TP53-WT cells than TP53-KO cells (or fewer TP53-KO cells compared to TP53-WT cells). b Sunburst chart of 34 out of 127 therapeutic agents by their maximal effect on TP53 status and their mechanism of action. c Validation effect of topoisomerase inhibitors Etoposide, Teniposide, Topotecan, and Daunorubicin that mainly affected TP53-KO organoids. Nutlin and Cisplatin showed expected effects on TP53-WT organoids shown in yellow and green respectively. Selected drugs are color-coded, and circle sizes correlate with different drug concentrations. On the X-axis, a negative number means fewer total cells in drug compared to DMSO. On the Y-axis, a positive number means more TP53-WT cells than TP53-KO cells (or less TP53-KO cells compared to TP53-WT cells).
Discussion
Colorectal cancer remains a significant challenge in oncology, with a complex landscape of somatic mutations and resulting pathway dependencies influencing tumor progression and response to therapy. Therefore, a comprehensive understanding of these genetic dependencies and vulnerabilities can aid in identification of appropriate treatments or the development of new targeted therapies. In this study we found several synthetic lethal interactions between cancer driver gene somatic mutations and therapeutic targets by using a genome-wide CRISPR-Cas9 knockout Brunello library screen23 in human colon cancer organoid. This specific colon tumor organoid (F147T) is mismatch repair deficient with mutations in important colorectal cancer genes, including RNF43, BRAF, and PTEN. We created derivatives of this organoid that generate TP53 knockouts in situ22, which allowed us to investigate gene dependencies in both TP53-WT and TP53-KO backgrounds without the confounding effect of TP53-mediated apoptosis in response to DNA double-strand breaks. We identified the known synthetic lethal interaction between mismatch repair-deficiency and WRN and we found new druggable dependencies in genes like EME1 and PPP6C. We also found a unique connection between RNF43 mutations and CTNNB1, WNT7B and PORCN dependencies. PORCN dependency suggests a role for self-stimulating (autocrine) WNT pathway activation in this tumor. We discovered that PTEN mutations lead to a reliance on PIK3CA, and the co-occurrence of PTEN and TP53 mutations resulted in a combined dependency on PIK3CB. TP53 mutations create dependencies on TOP2B and several novel targets. Finally, we showed that topoisomerase inhibitors are more inhibitory to TP53-KO than TP53-WT organoid derivates. We generalized key genetic targets in two genetically distinct colon tumor organoids, F147T and F130T, prioritizing synthetic lethal candidates related to the WNT, PI3K pathways and the MSI status. Comprehensive dependency mapping with CRISPR/Cas9 knockouts in patient-derived human organoids can identify tumor-specific vulnerabilities, illuminating opportunities for pharmacological intervention.
Methods
Organoid isolation and culture
Organoids were created from surgically resected colorectal cancers52. Small pieces (1 cm square) of mucosal tissue were separated and washed in 1X PBS (Corning) supplemented with 0.1% Amphotericin B (Gibco) and 0.2% Primocin (InvivoGen) to remove bacteria. Crypts were isolated with digestion and incubation in 1X PBS supplemented with 10% Collagenase A (Sigma) and 10 μM Y-27632 RhoKinase inhibitor (Selleckchem) on shaker at 37 °C for 40 min following with adding 5% FBS (Gibco), and incubation for few min at room temp. Crypts were dislodged mechanically from tissue by pipetting up and down, separated into a new tube for additional wash and were centrifuged at 500 x g for 5 min. The isolated stem cells were embedded in 75ul of ice-cold RGF BME Matrigel (R&D systems) per well in 12-well plates. The Matrigel was polymerized for 10–15 minutes at 37 °C humidity-controlled incubator with 5% CO2 and covered with 2 ml per well of human colon organoids medium (ENRA) containing 10 μM Y-27632 RhoKinase inhibitor (Selleckchem. The ENRA medium contained Advanced DMEM/F-12 (Gibco) supplemented with 10% R-Spondin, 10% Noggin (all CM produced in-house), 1x N2, 1x B27, 10 mM HEPES, 1x Glutamax, 1% Penicillin/Streptomycin, 0.25 ugmL−1 Amphotericin B, 50 ngmL−1 human Epidermal Growth Factor EGF (all from Gibco), 10 mM Nicotinamide, 1.25 mM N-acetyl-cysteine, 10 nM Gastrin (all from Sigma), 0.5 μM TGF-β type I receptor inhibitor A83-01 (Tocris Bioscience), 100 ugmL−1 Primocin (InvivoGen). Medium was changed every other day. For the first two changes of medium after culturing, medium contained 10 μM Y-27632 RhoKinase inhibitor (Selleckchem). Organoids were passaged 1:4 every 10–14 days. For passaging, organoids and matrigel were covered with 2 ml/well of TrypLE (Gibco) plus 10 μM ROCK inhibitor (Selleckchem), dissociated by incubation at 37 °C for 5–7 min, then spun down at 500 g for 5 min and were mechanically disrupted using a P1000 pipette and transferred into a 15-ml conical tube. Centrifuged at 500x g for 5 min. The pellet was resuspended and plated in ice-cold fresh Matrigel (R&D systems) and covered with ENRA medium. Organoid lines were constantly tested for mycoplasma contamination and resulted negative.
Cell culture
HEK293T cell lines were routinely tested for mycoplasma contamination and were maintained in the medium supplemented with 1% penicillin/streptomycin and 10% heat inactivated FBS. Cells were kept in a 37 °C humidity-controlled incubator with 5% CO2 and were maintained in exponential phase growth by passaging every 2–3 days. All colon tumor organoids were grown as described before52. Organoids were maintained in ENRA medium containing 1% Penicillin/Streptomycin, 100 μgmL−1 Primocin, 0.25 ugmL−1 Amphotericin B. Organoids were kept in a 37 °C humidity-controlled incubator with 5% CO2 and were maintained in exponential phase growth by passaging every 10-14 days and medium was changed every other day. For viral transduction, 6 μgmL−1polybrene was added during spinfection. After viral transduction, 2 μgmL−1 puromycin or 20 μgmL−1 blasticidin were used for selection.
Vectors
Individual gRNA sequences are provided in Supplementary Data 2. The following vectors were used in the study and are available on Addgene:
pRDA_186 (Spyo-only anchor vector): U6 promoter expresses customizable Spyo-guide; PGK promoter expresses blasticidin resistance and 2 A site provides EGFP (Addgene 133458).
lentiCRISPRv2 (pXPR_023): EF1a promoter expresses SpyoCas9 and 2 A site provides puromycin resistance; U6 promoter expresses customizable Spyo- guide (Addgene 52961).
Designing and generating TP53 dual-gRNA anchor vector using pRDA_186 vector
For generating TP53 anchor vector (TP53AV), two best TP53 gRNAs was chosen from the Brunello library. Two individual synthetic double-stranded DNA molecules (gBLOCKS) [U6 promoter-TP53gRNA1-trcRNA-tRNA] and [tRNA-TP53gRNA2-trcRNA-LinkerA] were synthesized by IDT. TP53 gRNA1 and TP53 gRNA2 were linked through their shared tRNA sequence to form a single molecule using 10 μL of 10X KAPA SYBR FAST qPCR master mix (Roche), 1 μL of gBLOCK DNA (1nguL−1), 2 μL of the forward and reverse PCR primer mix at a final concentration of 0.5 μM each, and 7 μL of water to adjust the volume for 20 ul reaction. Assembly PCR cycling condition: 3 min at 95 °C for 1 cycle; 05 s at 95 °C, 30 s at 68 °C for 5 cycles; 05 s at 95 °C, 30 s at 60 °C for 40 cycles; association curve from 95 °C to 45 °C.
Primers used for assembly:
Forward primer, 5′–3′; TGTACAAAAAAGCAGGCTTTAAAGG
Reverse primer, 5′–3′; CCTTTAGTGAGGGTTAATTGC
The resulting dual gRNA amplicons were PCR-purified (Agencourt AMPure XP Bead). Next, the linked dual-gRNA cassettes were amplified by qPCR and then bead cleaned up (Agencourt AMPure XP Bead) to use for cloning. Amplification PCR cycling condition: 3 min at 95 °C for 1 cycle; 05 s at 95 °C, 30 s at 68 °C for 5 cycles; 05 s at 95 °C, 30 s at 60 °C for 40 cycles; association curve from 95 °C to 45 °C.
Primers used for amplification:
Forward primer, 5′–3′; GACTATCATATGCTTACCGT
Reverse primer, 5′–3′; CATCATGAATTCCCTTTAGTGAGGGTTAATTGC
The resulting TP53-dual guide gblock was blunt-ended using Quick Blunting Kit (NEB E120S). the process is as follow: used 2 μg PCR purified gblock in a 25uL reaction contained 10X blunting buffer (2.5 μL) (New England Biolabs), 1 mM dNTP (2.5 μL), blunt enzyme mix (1 μL), adjusted the volume to 25 μL with water. Incubated at room temp for 15 min and then inactivated by incubating at 70 °C for 10 min. Used the product in the ligation reaction.
The pRDA_186 vector (Anchor Vector) was pre-digested with kflI (New England Biolabs) and EcoR1(New England Biolabs) enzymes. The digested vector was T4 blunted to remove 3’ overhang end using T4 DNA Polymerase kit (NEB M0203S) as follow: digested vector (90 μL), 10×2.1NEB buffer (10 μL), 10 mM dNTP mix (1 μL), and 3000U mL−1 T4 DNA polymerase enzyme (2 μL). Incubated at 12 °C for 15 min, then reaction was stopped by 0.5 μM EDTA (2 μL) and incubated at 75 °C for 20 min. Ran on 1% agarose gel, and the product was gel purified (Monarch DNA Gel Extraction Kit T1020S) and used in ligation.
To ligate the dual guide cassette into the anchor vector (pRDA_186), we used 2X quick ligation reaction buffer (10 μL), digested anchor vector (2 μL), blunted insert (2 μL), quick ligase (1 μL), with the volume adjusted to 20 μL using water. Incubated at room temp for 5 min. Then the ligated product was transformed into One Shot Top10 chemically competent cells (Invitrogen) and grown at 37 °C for 16h-19h on agar with 100 μgmL−1 ampicillin. Colonies were picked and plasmid DNA was prepared (Qiagen Plasmid Maxi Kit). pDNA was confirmed by sanger sequencing (GENWISE). Anchor vector viruses were made by Duke Viral Vector Core. F147T organoids were transduced with anchor vector viruses separately. Anchor vector organoids were selected with blasticidin (20μgmL−1) and monitored for EGFP expression for 14 days.
Designing and generating dual-guides candidates in lentiCRISPR v2
For cloning the dual gRNA candidates into lentiCRISPR vector for validation purpose, two best guides for each gene were chosen from the Brunello library gRNAs. Dual-gRNA gblocks were synthesized by IDT. The dual gRNA sequences were engineered to include BsmBI recognition sites, along with the appropriate overhang sequences (bold italic), for cloning into the gRNA expression plasmids, as well as primer sites to allow amplification of each oligo. The oligonucleotide sequence was:
5′[ForwardPrimer]CGTCTCACACCG[TP53sgRNA1,20nt][sgRNAscaffold][tRNA][TP53sgRNA2,20nt]GTTTCGAGACG [Reverse Primer]. Forward and reverse primers were used to amplify dual-guide gblocks using 10 μL of 2X KAPA HiFi HotStart qPCR master mix (Roche) containing EvaGreen (20x), 1 μL of oligonucleotide (~0.05 ng), 2 μL of primer mix at a final concentration of 0.5 μM, and 7 μL water to adjust the volume to 20 μL per reaction. Each gblock was amplified in ~12 reactions and then PCR products were pooled. PCR cycling conditions: 30 s at 98 °C, 30 s at 53 °C, 30 s at 72 °C, for 24 cycles.
Primers used for amplification:
Forward primer, 5′–3′; AGGCACTTGCTCGTACGACG
Reverse primer, 5′–3′; ATGTGGGCCCGGCACCTTAA
The resulting amplicons were PCR-purified (Agencourt AMPure XP Bead)) and cloned into the library vector (lentiCRISPR v2) via Golden Gate cloning with BsmBI v2 (New England Biolabs). 5:1 molar ratio of insert to vector was used. The ligation product was transformed into One Shot Stbl3 chemically competent cells (Invitrogen) and grown at 37 °C for 16 h-19 h on agar with 100 μg mL−1 ampicillin. Colonies were picked and plasmid DNA (pDNA) was prepared (Plasmid Maxi Kit, Qiagen). The pDNA was confirmed by sanger sequencing (Eton BioScience). Viruses were made by Duke Viral Vector Core.
Brunello CRISPR dropout library screen
Brunello library was purchased from Addgene (73179-LV). Prior to screening-scale transduction, organoids expressing pRDA_186 (Anchor derivative organoids) were selected with blasticidin and followed by a 14-day monitoring for EGFP expression. Organoids expressing pRDA_186 were then transduced with the secondary library (Brunello) in lentiCRISPR v2 in four biological replicates at a low MOI ( ~ 0.25). Transduction for the Brunello library screen was performed with enough single cells to achieve a representation of at least 200X coverage for each replicate (quadruplicate), taking into account a 20–30% transduction efficiency. Throughout the screen, cells were plated into Matrigel domes in 150 mm dishes. Replicates and each anchor vector were kept separate through the whole screen. At each sampling time point, organoids were split at a density to maintain a representation of at least 200 library copies and cell counts were taken at each sampling time point to monitor growth. Puromycin selection was added 2 days post-transduction and was maintained for 7 days. After puromycin selection was complete, organoids were digested to single cell in TrypLE at 37 °C bead bath for 30 min, pelleted by centrifugation, resuspended in PBS and divided in half. One half was plated back in Matrigel to grow for later time points and the other half was used for genomic DNA isolation.
Designing and generating mini-library 1 (a pool of single-guide candidates in lentiCRISPR v2.)
For cloning a pool of single gRNA candidates into lentiCRISPR vector for validation purpose, two or more guides for each gene were chosen from the Brunello library gRNAs. The oligonucleotide pools were synthesized by TWIST BioScience. The single gRNA oligo sequences were engineered to include BsmBI recognition sites, along with the appropriate overhang sequences (bold italic), for cloning into the gRNA expression plasmids, as well as primer sites to allow amplification of each oligo. The oligonucleotide sequence was:
5′[Forward Primer]CGTCTCACACCG[sgRNA,20nt]GTTTCGAGACG [Reverse Primer].
Designing and generating mini-library 2 (a pool of dual-guides candidates in lentiCRISPR v2.)
For cloning a pool of dual gRNA candidates into lentiCRISPR vector for validation purpose, two best guides for each gene were chosen from the Brunello library gRNAs. Dual-gRNA gblocks were synthesized by IDT. The dual gRNA sequences were engineered to include BsmBI recognition sites, along with the appropriate overhang sequences (bold italic), for cloning into the gRNA expression plasmids, as well as primer sites to allow amplification of each oligo. The oligonucleotide sequence was:
5′[ForwardPrimer]CGTCTCACACCG[sgRNA1,20nt][sgRNAscaffold][tRNA][sgRNA2,20nt]GTTTCGAGACG [Reverse Primer].
*The mini-library 2 was made of an artificial pool of the plasmid candidates mixed at the same ratio and a pooled lentivirus was prepared by Duke Viral Vector Core.
The resulting amplicons were PCR-purified (Agencourt AMPure XP Bead) and cloned into the library vector (lentiCRISPR v2) via Golden Gate cloning with BsmBI v2 (New England Biolabs). 5:1 molar ratio of insert to vector was used. The ligation product was transformed into One Shot Stbl3 chemically competent cells (Invitrogen) and grown at 37 °C for 16 h-19 h on agar with 100 μg mL−1 ampicillin. Colonies were picked and plasmid DNA (pDNA) was prepared (Plasmid Maxi Kit, Qiagen). The pDNA was confirmed by sanger sequencing (Eton BioScience).
Primer was used to amplify dual-gRNA gblocks using 10 μL of 2X KAPA HiFi HotStart qPCR master mix (Roche) containing EvaGreen (20x), 1 μL of oligonucleotide (~0.05 ng), 2 μL of primer mix at a final concentration of 0.5 μM, and 7 μL water to adjust the volume to 20 μL per reaction. Each gblock was amplified in ~12 reactions and then PCR products were pooled. PCR cycling conditions: 30 s at 98 °C, 30 s at 53 °C, 30 s at 72 °C, for 24 cycles.
Primers used for amplification:
Forward primer, 5′–3′; AGGCACTTGCTCGTACGACG
Reverse primer, 5′–3′; ATGTGGGCCCGGCACCTTAA
Lentivirus production
For individual candidates, a small-scale lentivirus production was made in-house as follow: 18 h before transfection, HEK293T cells were seeded in six-well dishes at a density of 1.2e6 cells per well in 2 mL of OPTI-MEM + 1% Sodium Pyruvate (100 mM) + 5% FBS. Transfection was performed using lipofectamine 3000 transfection reagent (Invitrogen) according to the manufacturer’s protocol. Briefly, one solution of Opti-MEM (Gibco, 250 μL) and Lipofectamine 3000 reagent (7 μL) and another solution of Opti-MEM (Gibco, 250 μL), P3000 reagent (6 μL) with a DNA mixture of the packaging plasmid pMD2.G (Addgene 12259, 0.562 μg), psPAX2 (Addgene 12260, 1.687 μg), and the transfer vector (e.g., pLentiGuide, 750 ng) were combined. The solutions were incubated at room temperature for 20–30 min. After this incubation, 50% of medium was removed from the HEK293T cells and the transfection mixture was added dropwise to the surface of the HEK293T cells and incubated at 37 °C incubator for 6 h. Following 6 h incubation, the medium was removed and replaced with 2 mL of pre-warmed OPTI-MEM + 1% Sodium Pyruvate (100 mM) + 5% FBS. The plate was incubated at 37 °C humidity-controlled incubator with 5% CO2 overnight. 24 h post transfection, the first harvest was collected, stored at 4 °C and the medium was replaced with pre-warmed OPTI-MEM + 1% Sodium Pyruvate (100 mM) + 5% FBS, incubated at 37 °C incubator with 5% CO2 overnight. 52 h post-transfection, the second harvest was collected and combined with the first harvest. Centrifuged at 2000 rpm for 10 min. The supernatant was filtered through a 0.45 μm pore size filter. The virus was aliquoted, and store at -80 °C for long-term storage. All lentivirus titers were determined by Duke Viral Vector core.
Viral transduction
Prior to viral transduction, organoids were digested to dissociate them into single cells by incubation in TrypLE contained 10 μM ROCK inhibitor at 37 °C for 20–30 min. Then, the cell suspension was passed through a 40 um Nylon Mesh cell strainer to segregate any cell clumps present. Following this, cells were counted to separate the required number of cells for transduction and resuspended in 1X human colon tumor organoids medium (ENRA) contained 10 μM ROCKi and Polybrene (6 μg mL−1). Next, the relevant viral particles, determined based on the desired multiplicity of infection (MOI), were added to the cell mixture. The mixture was then transferred to a tissue culture plate, and it was spun at 1000x g for 2 h at 30 °C. Post-spinfection, the plate incubated at 37 °C incubator with 5% CO2 for additional 3 h (total of 5 h). Following the incubation period, virus was washed out by ice-cold PBS contained 10 μM ROCKi from the organoids. Organoids then were embedded in ice-cold Matrigel and covered with ENRA medium contained 10 μM ROCKi inhibitor for the first two medium changes. For all the other feedings, the organoids were maintained in ENRA medium without ROCKi. The selection was started 2 days after the viral transduction.
Mini library screen
Transduction for mini library was performed with enough single cells to achieve a representation of at least 1000 cells per gRNA in each replicate (triplicate), taking into account a 10–20% transduction efficiency (MOI ~ 0.1). Throughout the screen, cells were plated into Matrigel domes in 150 mm dishes. Replicates were kept separate through the whole screen. At each sampling time point, organoids were split at a density to maintain a representation of at least 1000 copies of the library and cell counts were taken at each sampling time point to monitor growth. Puromycin selection was added 2 days post-transduction and was maintained for 7 days. After puromycin selection was complete, organoids were digested to single cell in TrypLE at 37 °C bead bath for 30 min. Pelleted by centrifugation, resuspended in PBS and divided in half. One half was plated back in ice-cold Matrigel to grow for later time points and the other half was used for genomic DNA isolation.
Drug screen
First, equal cell numbers of TP53-KO (TP53AV + ELC) and TP53-WT (EAV + ELC) organoids were mixed to achieve an approximate starting ratio of 50:50. Organoid mixtures were suspended in a slurry of ENRA:Matrigel (3:4 ratio) and plated in rings (doughnuts) around the outer edge of each well of a 96-well tissue culture plate (~1000–2000 total cells per well). The Approved Oncology Drug set VI were screened at maximum of 10uM and four to eight serial dilutions (Supplementary Data 4). After the treatment was completed, a multi-color fluorescent probe-based real-time PCR assay (Taqman) was done to deconvolute the TP53-KO viability signal from the TP53-WT viability signal within the mixture. The primers and probes targeted unique regions specific to each anchor vector (TP53AV and EAV) which allowed us to quantify each anchor vector within a mixture and detect the effect of any drug concentration on anchor vector separately. A primer/probe set targeting common Blast-marker sequences was used to internally normalize. The assay used 4 μL of 5x PerfeCTa Multiplex qPCR ToughMix (Quantabio), 6 μL of triplex Primers and Probes mix, gDNA as template and water to adjust the reaction volume to 20 μL. PCR cycling conditions: 1 min at 95 °C for 1 cycle; 10 s at 95 °C, 30 s at 69 °C for 4 cycles; 10 s at 95 °C, 30 s at 66 °C for 4 cycles; 10 s at 95 °C, 30 s at 63 °C for 4 cycles; association curve from 95 °C to 62 °C.
primers and probes used for qPCR assay:
EAV_forward primer, 5′–3′; CCCATGATTCCTTCATATTTGC
EAV_reverse primer, 5′–3′; CGGTCGTCTCCGGTGTTT
EAV_probe; /56FAM/CTTGGCTTT/ZEN/ATATATCTTGTGGAAAGGACG/3IABkFQ/
TP53AV_forward primer, 5′–3′; ACCAGTGGTCTAGTGGTAGAATA
TP53AV_reverse primer, 5′–3′; CTTCACCGTACTAACCAGGTG
TP53AV_probe; /5HEX/CGGTA CAGA/ZEN/CCCGGGTTCGATT/3IABkFQ/
Blast_forward primer, 5′–3′; TATCGTCGCGATCGGAAATG
Blast_reverse primer, 5′–3′; CCATCACTGTCCTTCACTATGG
Blast_probe; /5Cy5/CGACAGGTG/TAO/CTTCTCGATCTGCAT/3IAbRQSp/
The following 10x primer and probe mix was made for each pair:
5 μM forward primer; 5 μM reverse primer; 1.25 μM probe
The triplex primers/probes mix was made as follow:
1x EAV mix; 0.25x TP53AV; 0.25x Blast
Drug data analysis
X-axis: For every drug-treated well, we calculated the average of the cy5 Ct (Blast) for all the DMSO wells minus the cy5 Ct (Blast) of the drug treated well. This produced a number which is a mathematically equivalent to the log fold change (LFC) of cell count in drug-treated normalized to DMSO. A negative number means fewer total cells in the presence of the drug compared to DMSO.
Y-axis: For every drug treated well, we calculated the difference between the FAM-ct (Empty Anchor vector, TP53-WT) and HEX-ct (TP53 Anchor Vector, TP53-KO). This produced a number, which is a mathematically equivalent to the log fold change (LFC) of TP53-WT cell count normalized to TP53-KO cell count. A positive number means more TP53-WT cells than TP53-KO cells (or less TP53-KO cells compared to TP53-WT cells).
Genomic DNA isolation for library screening
Genomic DNA (gDNA) was isolated using the Blood & Cell Culture DNA Midi and Mini Kits (Qiagen) as per the manufacturer’s instructions. The gDNA for donut organoids were isolated using DNAdvanced kit (BeckmanCoulter). The gDNA concentrations were quantitated by Qubit.
Sequencing
The gDNA of Brunello samples were PCR amplified with primers that flank the Gecko guide RNA insert sequences (Gecko_F and Gecko_R) and sequenced the PCR products by illumine platform (BROAD Genomics Perturbation Platform). The representation of at least 200X coverage was kept. For mini library validations, gDNA was PCR amplified with primers that flank the guide RNA insert sequences (tRNA_F and lentiCRISPR_R and sequenced by Oxford Nanopore platform in-house using the Q20+ kit and kept a representation of at least 1000X coverage. All reads were counted by aligning the sequence reads to a reference file of all possible gRNAs present in libraries. This process made it possible to count all the gRNA inserts, setting the stage for further detailed examination and analysis.
Gecko primers used for Brunello library amplification:
Forward primer, 5′–3′; TCTTGTGGAAAGGACGAAACACCG
Reverse primer, 5′–3′; TGTGGGCGATGTGCGCTCTG
Primers used for mini library amplification:
tRNA_forward primer, 5′–3′; AGAATAGTACCCTGCCACGG
lentiCRISPR_reverse primer, 5′–3′; GCCAATTCCCACTCCTTTCA
Brunello screen analysis
The abundance of each guide was determined by unique gRNA sequence counting and normalizing these counts to the average counts from all 1000 non-targeting guide sequence (Supplementary Data 2). Log fold changes (LFC) were computed for each replicate as log (Day21 or Day36/Day7) and averaging these LFCs for TP53-KO or TP53-WT separately. To compute the significance of the depletion over time we performed a T-test comparing the normalized frequencies at Day21 and Day36 to normalized frequencies at Day7 and Day0. The gRNA distribution in the library plasmid DNA was used as a Day0 time point for these early vs late statistical calculations. Guides with P value smaller than 0.05 are shown as significant in both. To compute the significance of the difference between TP53-WT and TP53-KO we performed a T-test comparing the normalized frequencies at TP53AV D21 and D36 to EAV D21 and D36. Guides with P value smaller than 0.05 are shown.
Mini library screen analysis
Following deconvolution, the abundance of each guide was determined by unique gRNA sequence counting and normalizing these counts to the average counts from all guide sequences within each sample. For library 1, we conducted a comparative study of the gRNA depletion between plasmid and tumors, as well as contrasts in both TP53-WT and TP53-KO organoids. For library 2, we conducted a comparative study of the gRNA depletion between plasmid and tumors, as well as contrasts the two different tumors. Significantly depleted guides were defined as those that were more than one standard deviation below the diagonal line of identity.
Reporting summary
Further information on research design is available in the Nature Portfolio Reporting Summary linked to this article.


Responses