Structural basis for the asymmetric binding of coactivator SRC1 to FXR-RXRα and allosteric communication within the complex

Introduction
Metabolic dysfunction-associated steatohepatitis (MASH) is a chronic liver disease that progresses from metabolic associated fatty liver disease (MAFLD), becoming the main cause of liver cirrhosis and cancer1,2. Due to the intricate pathogenesis of MASH, only one drug has been officially approved for its treatment very recently3. The agonist of farnesoid X receptor (FXR, NR1H4), obeticholic acid (OCA), was the first MASH drug to enter phase III clinical trials worldwide4, as FXR being one of the most promising targets for the treatment of MASH. However, extensive activation of FXR by OCA may disrupt cholesterol homeostasis and cause side effects. Partial agonists of FXR are expected to address this issue5,6,7. Additionally, the observed side effects may be linked to the recruitment of specific cofactors induced by the ligands8. Thus, there is an urgent need to explore the molecular mechanisms underlying FXR transcriptional regulation in greater detail to design more effective drugs with fewer side effects.
FXR is a ligand-dependent activated type II nuclear receptor (NR) that shares a common structure with classical NRs, consisting of an N-terminal domain (NTD), a DNA-binding domain (DBD), a hinge region, and a ligand-binding domain (LBD)9,10,11. Typically, FXR functions as a heterodimer alongside the retinoid X receptor (RXR)9,12. The FXR-DBD regulates gene transcription by binding to specific DNA sequences called farnesoid X receptor response elements (FXREs), which consist of a repeated pattern of G/AGGTCA with one base pair in-between (IR1)9,13. The LBD of FXR consists of 12 α-helices, in which houses not only an LBP (ligand-binding-pocket) but also a dimerization surface and a binding site for cofactor, serving multiple functions14,15,16. Various crystal structures of FXR-LBD with ligands have been resolved17,18,19. We previously reported the structure of the FXR-RXRα-LBD heterodimer in complex with coactivator peptides and agonists, demonstrating communication between FXR-LBD and RXR-LBD, and highlighting the roles of FXR’s H10 histidine and RXR’s H10 glutamate at the heterodimer interface15. Of late, the crystal structure of FXR-RXRα-DBD in complex with DNA has also been reported20. However, how the individual domains work together in a multi-domain NR is still poorly understood. Studies have shown that there is extensive allosteric communication in NRs, i.e. the structural and dynamic changes between different domains affect each other to achieve the functional regulation of NRs21,22,23,24,25. Therefore, structural study of the full-length FXR-RXRα protein is crucial for in-depth understanding of the interaction, allosteric communication, and signal transduction mechanisms of the multi-domain NRs.
To achieve full activity, FXR-RXRα must associate with coactivators that connect FXR-RXRα to the basal transcriptional machinery to remodel the chromatin and alter gene transcription26,27,28. SRC1, a primary coactivator directly binding to FXR-RXRα and further mediating the recruitment of secondary coactivators such as p300 and CARM1, is essential for the formation of the FXR transcriptional activation complex26,28,29. SRC1 binds to the LBD of FXR-RXRα via a nuclear receptor interaction domain (NRID) containing three highly conserved α-helical LXXLL motifs (NR-box)30,31,32,33,34. The crystal structure from our previous study reveals that each monomer in FXR-RXRα-LBD heterodimer recruits one SRC1 peptide, with only one LXXLL motif, to the corresponding coactivator binding surface12. The leucine residues from the LXXLL motif are embedded in a hydrophobic groove in LBD and locked by a charge clamp composed of lysine (K) from H3 and glutamate (E) from H1215,35,36. However, all crystal structures reported up to date only contain a single LXXLL motif peptide due to the disordered feature in SRC1-NRID37. Interestingly, small molecule inhibitors have recently been developed targeting SRC3 and SRC1 to disrupt their interactions with NRs, resulting in inhibition of their transcriptional activation functions and further anti-tumor activity38,39,40.
In this study, we used integrative approaches to investigate the structure and function of the complex between FXR-RXRα and SRC1. We constructed the first multi-domain model of the FXR-RXRα with an IR1 sequence and revealed the interaction between the DBD and LBD of FXR. Furthermore, we revealed an asymmetric recruitment of SRC1 by FXR-RXRα. Through identifying NR-box2 and NR-box3 of the SRC1-NRID as key players in binding to FXR-RXRα, we put forth a structure model for the complex of SRC1 with FXR-RXRα-hSHP-1. These results will greatly advance our understanding on the molecular organization and allosteric communication within the FXR transcriptional activation complex and offer insights for the development of FXR-related drugs.
Results
FXRE and ligands co-regulate SRC1 binding to FXR-RXRα
To investigate the effects of FXRE and agonists on SRC1 binding to FXR-RXRα, we expressed and purified SRC1630-987 and FXR120-RXRα98. SRC1630-987 includes an NRID containing three NR-boxes and a p300-interacting domain (Fig. 1A). The DNA used in this study was the FXRE (IR1) locating in the promoter region of the human small heterodimer chaperone 1 (hSHP-1) gene41 (Fig. 1B). Biofilm interferometry (BLI) was employed to assess the binding affinity of SRC1630-987 for various states of FXR120-RXRα98.

A Schematic diagram of the domain architecture of SRC1, FXR and RXRα. Truncations utilized in the experiments are indicated. B The FXR response element in the promoter of the FXR target gene hSHP-1 used in the experiment, comprising AGGTCA inverted repeats separated by a nucleotide. C Binding profiles of different states of FXR120-RXRα98 to SRC1630-987 in a concentration gradient. Biotin-labeled SRC1630-987 was immobilized on the sensor, and the effects of FXR and RXRα agonists, as well as FXRE (hSHP-1), on its binding affinity to FXR120-RXRα98, were examined. The KD values are also presented in the table.
The binding experiments showed that FXR120-RXRα98 binds to SRC1630-987 with a KD value of 49.0 nM without an agonist. However, when FXR120-RXRα98 is first associated to hSHP-1, it fails to bind with SRC1630-987 without an agonist (Fig. 1C). This suggests that the presence of hSHP-1 alters the conformation of the LBD of FXR-RXRα, preventing its binding to SRC1630-987. Furthermore, when 4-fold molar excess of RXRα agonist 9cRA (9-cis-Retinoic Acid) to FXR120-RXRα98 is present, FXR120-RXRα98-hSHP-1 can bind to SRC1630-987 with a KD value of 49.0 nM (Fig. 1C). This indicates that agonist binding changes the conformation of DNA-bound FXR-RXRα, enabling it to recruit SRC1630-987. Remarkably, in the presence of 4-fold molar excess of FXR agonist GW4064 to FXR120-RXRα98, the complex binds to SRC1630-987 at a KD value of 23.7 nM, demonstrating a stronger effect for FXR agonist binding (Fig. 1C). These findings suggest that both hSHP-1 and agonists influence the binding of SRC1 to FXR-RXRα. Additionally, we also found that further addition of 9cRA in the presence of GW4064 only slightly increases the affinity of SRC1630-987 for FXR120-RXRα98, indicating that FXR may play a dominant role in recruiting SRC1 (Fig. 1C).
We then assessed the affinity of FXR-RXRα-hSHP-1 for SRC1630-987 in the presence of the corepressor peptide NCOR (GHSFADPASNLGLEDIIRKALMGS), finding that NCOR decreases the binding affinity of FXR-RXRα-hSHP-1 for SRC1630-987 (Fig. S1). Interestingly, GW4064 reduced the effect of the NCOR peptide slightly more than 9cRA. Additionally, molecular dynamics simulations using FXR agonists featuring diverse scaffolds converged and showed a plateau in root mean square deviation (RMSD) values (Fig. S1B and Table S1). Notably, the per-residue root mean square fluctuation values revealed that the cofactor binding interface of FXR, including helices H3, H4, and H12, exhibited varying degrees of alteration upon binding of FXR agonists with different scaffolds (Fig. S1C), suggesting a structural basis for the recruitment of distinct cofactors. In contrast, the RXR cofactor binding interface showed minimal changes. In summary, these findings further underscore the dominant role of FXR in SRC1 recruitment, indicating that SRC1 binding to FXR-RXRα is co-regulated by FXRE and ligands, thereby revealing a complex interrelationship.
Integrative modelling of the FXR-RXRα heterodimer binding to hSHP-1
To gain insight into the molecular mechanisms by which FXRE and agonists co-regulate the binding of SRC1 to FXR-RXRα, we constructed an FXR-RXRα-hSHP-1 model by integrating various biophysical approaches. Bis (sulfosuccinimidyl) suberate (BS3, to cross-link lysine–lysine) and 1-ethyl-3-[3-dimethylaminopropyl] carbodiimide hydrochloride (EDC, to cross-link carboxyl group and amino group) were used to cross-link FXR120-RXRα98-hSHP-1, respectively. The complex band at 80 kDa was excised for mass spectrometry analysis (Figs. S2A and S15A). Both BS3 and EDC produced similar cross-linking results (Fig. S2B, C). The multi-domain structural model of FXR-RXRα-hSHP-1 was constructed by docking the crystal structures of FXR-RXRα-LBD (PDB ID: 5Z12) and FXR-RXRα-DBD-IR1 (PDB ID:8HDM) using the LZerD web server42,43, together with distance constraints obtained from XL-MS (Fig. 2A). Supplementary Tables 2 and 3 present the cross-linking constrains employed during the model construction, as well as the quality assessment of the model. We also collected SAXS data of FXR120-RXRα98-hSHP-1. The theoretical profile calculated based on the model of FXR-RXRα-hSHP-1 is consistent with the experimental SAXS profile, with a χ2 value of 2.76 (Fig. S2D). The FXR-RXRα-hSHP-1 model also fits well with the ab initio envelope (Fig. S2E).
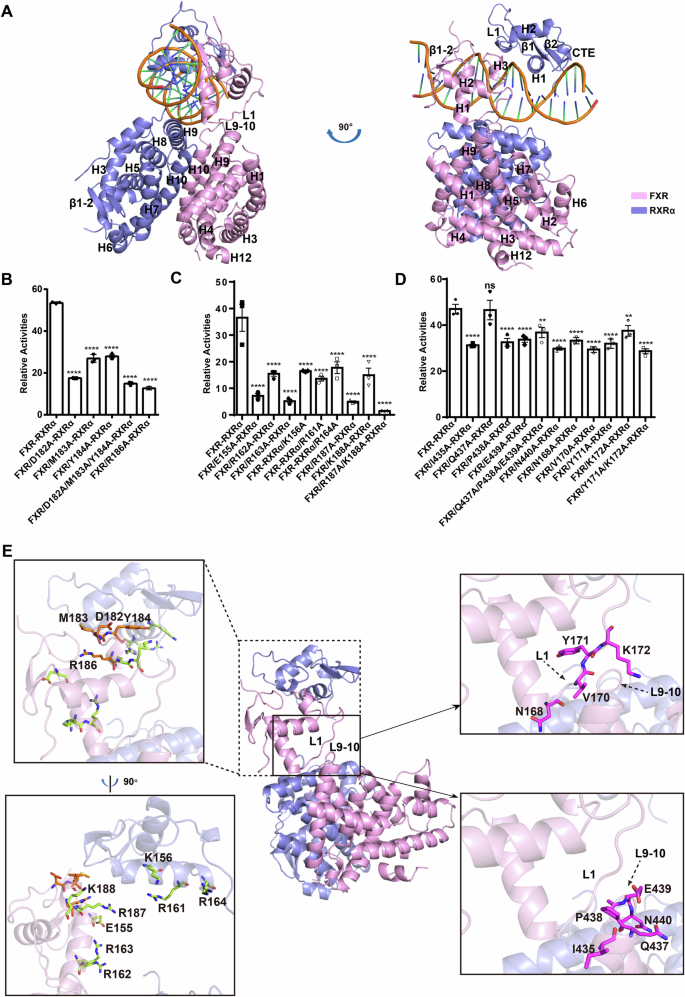
A Multi-domain model of FXR120-RXRα98-hSHP-1 (FXR, pink; RXRα, slate). Luciferase reporter gene assay was used to detect the effect of FXR and RXRα mutations in B the FXR-DBD and RXRα-DBD interface, C the putative DNA binding interface of the FXR-DBD and RXRα-DBD and D the FXR-LBD and FXR-DBD interface on the transcriptional activity of FXR120-RXRα98 on hSHP-1 in the presence of GW4064(100 nM) and 9cRA (100 nM). Data represents mean from n = 3 experiments, Error bars represent SEM, ns represent no significance (P > 0.05). *P < 0.05, **P < 0.01, ***P < 0.001, ****P < 0.0001 by one-way ANOVA. E The mutated residues mapped to the FXR-RXRα-hSHP-1 model. The amino acids mutated at the interface between FXR-DBD and RXRα-DBD are highlighted in orange. The limon color represents the mutant residues at the DNA-binding interface of FXR-RXRα-DBD. The magenta color indicates the mutated residues located at the interface between FXR-LBD and FXR-DBD.
To assess the impact of domain interfaces in the model on the transcriptional activity, cellular functional experiments were conducted. The cross-linking data of FXR120-RXRα98-hSHP-1 were consistent with the corresponding distances in crystal structure of FXR-RXRα-LBD (Fig. S2F), and our model aligned well with other FXR-LBD crystal structures6,44. Therefore, no mutation experiments were performed on the dimerization interface between LBDs. On the other hand, the cross-linking data did not agree completely with those in FXR-RXRα-DBD-IR1 crystal structure (PDB ID: 8HBM, Fig. S2G). A luciferase reporter gene assay was used to evaluate the impact of those amino acid mutations on FXR-RXRα transcriptional activity. Results revealed that all mutations (K158A/K145A/K165A), except K167A, affected the activity. (Fig. S2H, I and S8). This may be attributed to the presence of different conformations of the DBD in the full-length nuclear receptor in solution.
To verify whether the binding mode of FXR-DBD, RXRα-DBD, and hSHP-1 in the FXR120-RXRα98-hSHP-1 complex matches the configuration observed in the FXR-RXRα-DBD-IR1 crystal structure, we introduced amino acid mutations at each interaction interface of FXR-DBD, RXRα-DBD, and hSHP-1. The mutations at the FXR-DBD and RXRα-DBD interface (D182A, M183A, Y184A, D182A/M183A/Y184A, R186A) are shown in Fig. 2E. Mutations at these sites resulted in a significant decrease in the transcriptional activity of FXR-RXRα on hSHP-1 (Fig. 2B). We also generated the mutations on the residues in H1, which is inserted into the major groove of DNA, on the DBD of FXR (E155A, R162A, R163A) and RXRα (K156A, R161A, R164A) (Fig. 2E). Results showed that these residues are critical for the binding of FXR-RXRα-DBD to DNA (Fig. 2C). Moreover, we mutated the residues in H3 of the FXR-DBD in the model (R187A, K188A, R187A/K188A) that is shown to have contacts with the DNA minor groove (Fig. 2E). These mutations also significantly reduced the transcriptional activity of FXR-RXRα on hSHP-1 (Fig. 2C). Western blot analysis indicated no significant difference in the protein expression levels (Figs. S2J, K, S9 and S10), while circular dichroism (CD) and native PAGE demonstrated that the conformation was preserved without aggregation (Figs. S3 and S15B). Collectively, the results demonstrated that the binding of FXR-RXRα-DBD to hSHP-1 in FXR120-RXRα98-hSHP-1 agrees with those in the FXR-RXRα-DBD-IR1 crystal structure.
More important, there is also an interface between the FXR-LBD and DBD in our model. Specifically, the interface is between L9-10 (H9-H10 loop) of FXR-LBD and L1 (the loop following H1) of FXR-DBD (Fig. 2E). We designed mutations on the critical residues (I435A, Q437A, P438A, E439A, Q437A/P438A/E439A and N440A of FXR-LBD; N168A, V170A, Y171A, K172A, Y171A/K172A of FXR-DBD) (Fig. 2E). The results showed that mutants, except Q437A, reduced the transcriptional activation of FXR-RXRα when compared with the wild-type FXR (Figs. 2D, S2L and S11).
Altogether, these results demonstrated that these three interfaces presented in the model are important for the transcriptional activity of the FXR-RXRα.
Allosteric communication between the LBD and DBD of FXR-RXRα
To investigate the molecular mechanism by which FXRE and agonists influence the recruitment of SRC1 by FXR-RXRα, we utilized HDX-MS to examine the allosteric communication between LBD and DBD of FXR-RXRα induced by agonists and DNA binding. By integrating the HDX data with the FXR-RXRα-hSHP-1 model, we were able to gain a more comprehensive understanding of the HDX results (Fig. 3A, B).
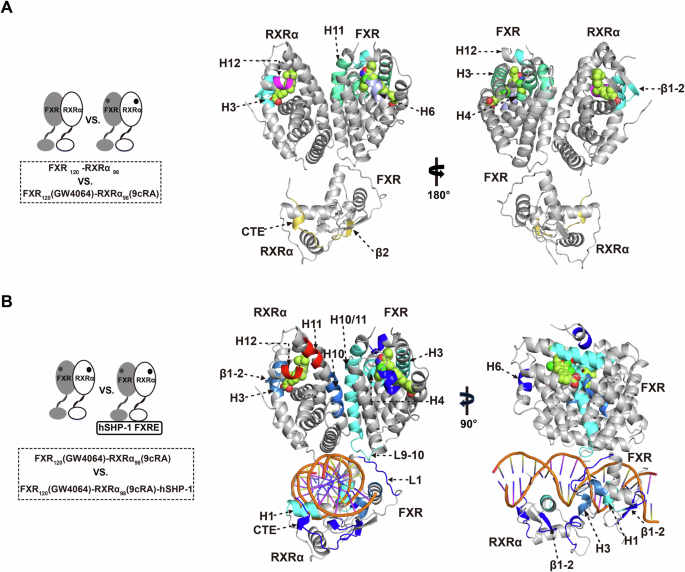
A, B Schematic diagram of the HDX-MS experiment, left. Right, Comparison of A FXR-RXRα and FXR120(GW4064)-RXRα98(9cRA) as well as B FXR120(GW4064)-RXRα98(9cRA) and FXR120(GW4064)-RXRα98(9cRA)-hSHP-1, peptides with reduced or elevated deuterium uptake in HDX-MS were mapped to the FXR120-RXRα98 model (GW4064 in FXR and 9cRA in RXRα are shown in space-filling representation colored by atom type: oxygen as red, nitrogen as blue, sulfur as yellow, chlorine as green, and carbon as pink). Gray, no change in HDX between compared conditions; green to blue, slower rates of HDX between compared conditions; yellow to red, faster rates of HDX between compared conditions.
First, we studied the conformational changes of FXR-RXRα upon binding with their agonists (Fig. 3A). Comparing the HDX results of FXR120-RXRα98 and FXR120(GW4064)-RXRα98(9cRA) demonstrated that the regions in FXR-RXRα-LBD with reduced solvent exposure upon ligand binding are comparable to those directly interact with the ligand in the crystal structure (Figs. 3A, S4A, B). Specifically, regions such as H3, H4, H6, and H12 in FXR-LBD, as well as H3 and β1-2 in RXRα-LBD, exhibited significant reductions in HDX rate (Figs. 3A and S4A, B). In addition, H11 of FXR-LBD and the loop between H11 and H12 (L:H11-H12) exhibited a significant decrease in the HDX rate following agonist binding (Figs. 3A and S4A). It has been established that FXR agonists can stabilize both H11 and L:H11-H12 (AF-2 region), and this stable AF-2 region is capable of recruiting coactivators6,44. Consequently, agonists binding stabilizes the LBP and the dimerization interface of FXR and subsequently creates a surface that facilitates the recruitment of coactivators, as shown in Fig. 3A. Surprisingly, upon agonist binding, H12 within the RXRα-LBD exhibits an accelerated rate of HDX (Figs. 3A and S4B), suggesting that agonist binding increases the dynamics and flexibility of H12 within the RXRα-LBD. The DBD region of FXR-RXRα also exhibits obvious HDX changes. As shown in Figs. 3A and S4D, the HDX rates of the N-terminal β2 and CTE of RXRα-DBD are significantly higher, suggestive of increased flexibility in these regions.
Then, we investigated the impact of FXR-RXRα conformational dynamics upon its interaction with hSHP-1, in the presence of GW4064 and 9cRA agonists (Fig. 3B). Comparison of the HDX between FXR120(GW4064)-RXRα98(9cRA) and FXR120(GW4064)-RXRα98(9cRA)-hSHP-1 revealed that the DBD, LBD, and hinge region of both FXR and RXRα underwent significant HDX changes (Figs. 3B and S4). Upon DNA binding, there is a reduction in deuterium uptake in H3, H4, H6 and H12 of the FXR-LBD, as well as in H3 and the β1-2 of the RXRα-LBD (Figs. 3B and S4A, B). These findings suggest that DNA binding enhances the stability of the coactivator binding surface in FXR, which can facilitate the coactivator recruitment. Furthermore, H10 of both the FXR-LBD and RXRα-LBD and H11 of FXR-LBD, which are located at the FXR-RXRα-LBD dimerization interface, exhibit a significant decrease in HDX upon DNA binding (Figs. 3B and S4A, B). Additionally, our XL-MS results (Fig. S5A, B) show that DNA binding significantly increases the number of cross-links between the LBDs of the FXR and RXRα. These findings suggest that DNA binding stabilize the dimerization between the FXR-LBD and RXRα-LBD. And it has been reported that the dimerization of FXR-RXRα-LBD increases its affinity for SRC115. Our data indicate that the binding of DNA may promote the recruitment of SRC1 to FXR-RXRα-LBD via the dimerization of FXR-RXRα-LBD. Surprisingly, a significant increase in the HDX rate of H11 in the RXRα-LBD was observed following DNA binding (Figs. 3B and S4B). Furthermore, this was accompanied by an additional increase in the HDX rate of H12 in the RXRα-LBD when compared to FXR120 (GW4064)-RXRα98 (9cRA) (Fig. S4B). In the DBDs, the HDX reduction observed in H1 of both FXR-DBD and RXRα-DBD is consistent with their insertion into the major groove of DNA (Figs. 3B and S4C, D). When compared to RXRα-DBD, H1 in FXR-DBD exhibits stronger solvent exchange protection, suggesting a stronger FXR-DNA interaction (Figs. 3B and S4C, D). The H3 in FXR-DBD and L1 (the loop following H1) of RXRα-DBD peptides also exhibited significant solution protection, further confirming the interface between FXR-DBD and RXRα-DBD as presented in the model (Figs. 3B and S4C, D). Furthermore, the deuterium uptake of the N-terminal β1-2 of FXR-DBD was significantly reduced, indicating its involvement in DNA binding (Figs. 3B and S4C). Additionally, mutating key amino acids in this region led to a significant reduction in FXR-RXRα transcriptional activity (Figs. S5C, D and S12). Overall, besides the recognition helix of DBD, the NTDs of both FXR and RXRα participate in DNA binding and play a crucial role in transcriptional activation of target genes by FXR-RXRα.
Interestingly, the L9-10 of FXR-LBD and L1 of FXR-DBD, locating at the interface between FXR-LBD and DBD, showed reduced deuterium uptake (Figs. 3B and S4A, C). This strongly supports the interaction between FXR-DBD and FXR-LBD (Fig. 2B). Moreover, significant solution protection was observed in the hinge region of FXR (Fig. S4A). And our XL-MS results indicated a significant increase in the number of cross-linking pairs between the DBD and LBD of FXR upon binding of hSHP-1 to FXR120(GW4064)-RXRα98(9cRA) (Fig. S5A, B). These results suggest that the distance between FXR-DBD and LBD may become closer. Based on these findings, we speculate that binding of hSHP-1 induces conformational changes in FXR, leading to signal transmission between the DBD and LBD of FXR-RXRα through the dynamic allostery of L9-10 of FXR-LBD and L1 of FXR-DBD.
In summary, these results suggest that DNA can facilitate allosteric communication and stabilize the coactivator binding surface of FXR with the help of agonists, leading to enhanced recruitment of coactivators such as SRC1.
Binding of SRC1 to FXR asymmetrically in the transcriptional activation of FXR-RXRα
We performed a transient transfection assay using a reporter gene under the control of three copies of FXRE (3× hSHP-1-luc) (Fig. 1B) and demonstrated that SRC1 significantly increased the activity of the reporter gene with agonists (Fig. S6A).
Then we purified the proteins SRC1630-987 comprising the entire NRID of SRC1 (Fig. 1A) and FXR120-RXRα98. In vitro, we assembled the SRC1630-987-FXR120-RXRα98-hSHP-1 complex. The formation of FXR120-RXRα98 and SRC1630-987 complex was confirmed by both size exclusion chromatographic analysis (SEC) (Fig. S6B) and SDS-PAGE analysis (Figs. S6C and S15C). To accurately determine the stoichiometric ratio within the complex, we employed SEC coupled with Multi-Angle Light Scattering (SEC-MALS) to measure the molecular weight of SRC1630-987-FXR120-RXRα98-hSHP-1. The SEC-MALS analysis demonstrated that the measured molecular weight of the complex closely matched the theoretical molecular weight of the complex formed by SRC1630-987 bound to FXR120-RXRα98-hSHP-1 at a 1:1 stoichiometric ratio (Fig. 4A). These findings strongly lead to the conclusion that the ligand activated FXR-RXRα heterodimer recruits only one molecule of SRC1.
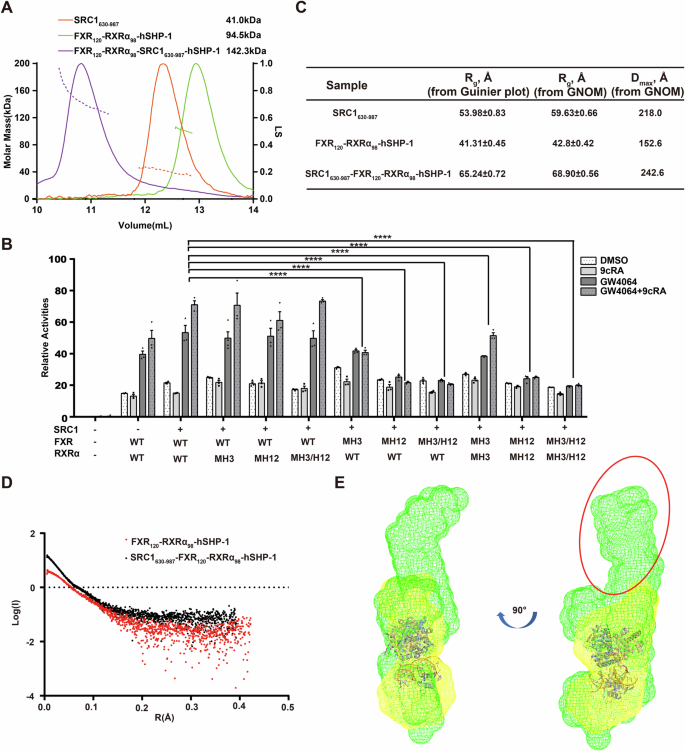
A SEC-MALS of SRC1630-987, FXR120-RXRα98-hSHP-1, and SRC1630-987-FXR120-RXRα98-hSHP-1 complexes. Their elution profiles on Superdex 200 10/300 GL (GE Healthcare) and the directly measured molar mass of each elution peak were shown. B Luciferase reporter gene assay testing the transcriptional ability of different charge-clamp mutants for FXR and RXRα. The cells were treated with 0.1% DMSO, RXR agonist 9cRA (100 nM in 0.1% DMSO), and FXR agonist GW4064 (100 nM in 0.1% DMSO) for 24 h. Data represents mean from n = 3 experiments, Error bars represent SEM, ns represent no significance (P > 0.05), ****P < 0.0001. C SAXS parameters. Rg and Dmax as determined from Guinier plot or p(r) distribution. D The Guinier plot for SAXS analysis of FXR120-RXRα98-hSHP-1 and SRC1630-987-FXR120-RXRα98-hSHP-1. E Overlay of the ab initio envelope of FXR120-RXRα98-hSHP-1 (yellow mesh) with the SRC1630-987-FXR120-RXRα98-hSHP-1 complex (green mesh) after fitting with cartoon model of FXR120-RXRα98-hSHP-1 (FXR, pink; RXRα, slate). The part circled in red is the extra electron density.
To further investigate the binding mode of SRC1 to the FXR-RXRα heterodimer, mutations were introduced in the conserved coactivator binding charge clamp residues: lysine (K) residue in H3 of FXR and RXRα (mH3 mutant) and the glutamate (E) residue in H12/AF2 (mH12 mutant) (Fig. S6D, E). These mutated forms of FXR and RXRα were overexpressed in HEK293T cells. The transcriptional activity of the mutants upon SRC1 stimulation was assessed by co-expression of SRC1 (Figs. 4B, S6F and S13). Interestingly, mutations in the charge clamp on H3 of RXRα did not have any impact on the transcriptional activity of FXR-RXRα stimulated by SRC1. Meanwhile, mutation of H12 in RXRα resulted in a slight reduction in transcriptional activity, possibly through weakening the agonist binding to RXRα. Whereas, mutations in the charge clamp on either H3 or H12 of FXR had a significant effect on SRC1 enhanced transcriptional activity of FXR-RXRα. Most importantly, the double mutation of the FXR charge clamp completely reduced the level of transcriptional activation of FXR-RXRα to that observed without SRC1, demonstrating the critical role of the FXR charge clamp in mediating the interaction with SRC1. Furthermore, the results presented in Fig. 4B indicate that 9cRA enhances SRC1 stimulation of FXR-RXRα transcriptional activity only in the presence of GW4064. Additionally, HDX-MS data showed that FXR is more protected on its coactivator binding surface when bound to DNA and agonists, which would be more favorable for its binding to SRC1 (Fig. S4A). Conversely, H11 and H12 of RXRα-LBD displayed increased flexibility after agonist and DNA binding (Fig. S4B), potentially suggesting a more dynamic feature for RXRα-LBD in the context of the SRC1 interaction with the heterodimer. Collectively, these results strongly suggest that SRC1 enhanced transcriptional activation of FXR-RXRα primarily results from the binding of SRC1 to FXR, not RXRα.
To delve deeper into the overall organization of the SRC1630-987-FXR120-RXRα98-hSHP-1 complex, SAXS data (Table S4) were collected for SRC1630-987, FXR120-RXRα98-hSHP-1, and SRC1630-987-FXR120-RXRα98-hSHP-1 complex using SEC-SAXS technique. The structure parameters are shown in Fig. 4C, and the SAXS patterns of FXR120-RXRα98-hSHP-1 and SRC1630-987-FXR120-RXRα98-hSHP-1 are shown in Fig. 4D. The ab initio structure envelope of FXR120-RXRα98-hSHP-1 after fitting with FXR-RXRα-hSHP-1 model was overlaid with the ab initio structure envelope of SRC1630-987-FXR120-RXRα98-hSHP-1 complex. There is an additional electron density at the top of FXR, which is just enough to accommodate one SRC1630-987 molecule, further confirming that one SRC1 is asymmetrically bound to FXR-RXRα-hSHP-1 (Fig. 4E).
Collectively, these results indicate that one SRC1 molecule binds asymmetrically to the coactivator binding surface of FXR in FXR-RXRα complex.
NR-box2 and box3 of the SRC1-NRID interact with FXR-RXRα heterodimer
To identify which NR-box of SRC1 is directly involved in the interaction with FXR-RXRα, we generated various mutants in the NRID domain, including single (M1, M2, M3), double (M1/2, M2/3, M1/3), or triple (M1/2/3) NR-box mutations (Fig. 5A).
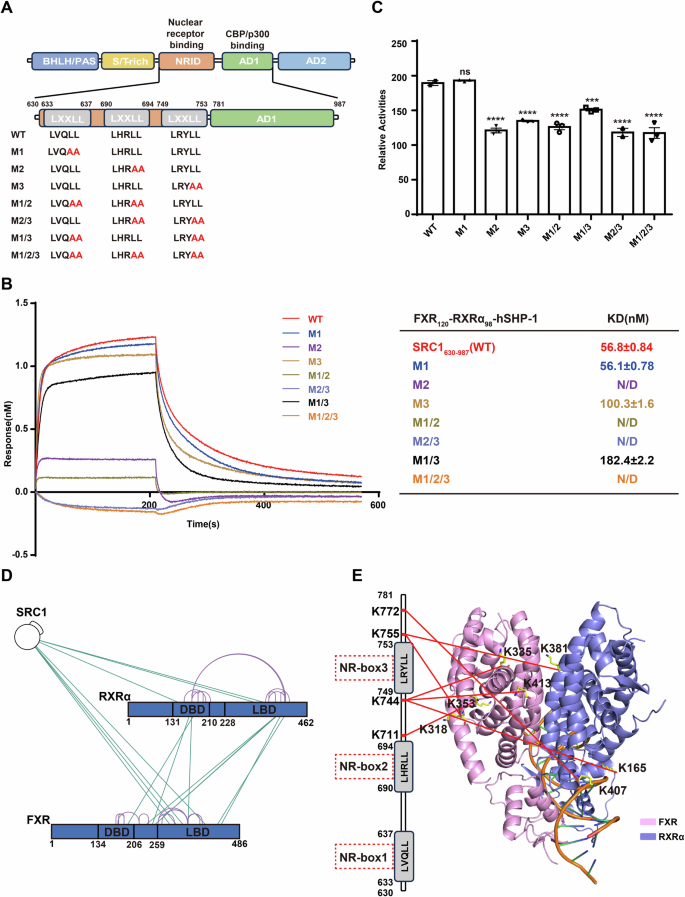
A Schematic diagram of mutations for different NR-boxes of SRC1 used in this study. B In the presence of GW4064 and 9cRA, BLI experiments were conducted to investigate the binding affinity of biotinylated SRC1630-987 and various NR-box mutants of SRC1630-987 with FXR120-RXRα98-hSHP-1. The calculated KD value is indicated on the right. C Luciferase reporter assay was used to test the effect of different mutants of the NR-box of SRC1 on FXR-RXRα promoting hSHP-1 transcription in the presence of GW4064 (100 nM in 0.1% DMSO) and 9cRA (100 nM in 0.1% DMSO). Data represents mean from n = 3 experiments, Error bars represent SEM, ns represent no significance (P > 0.05). ***P < 0.001, ****P < 0.0001. D High confidence (score ≥10) BS3 cross-linked residues shown on the sequence schematic of FXR and RXRα, with green lines representing cross-links and purple representing self-links. E Cross-linking between the NRID domain of SRC1 and FXR-RXRα is depicted in our model. The left side of the panel shows a schematic representation of the three NR-boxes in the NRID domain of SRC1, indicating the specific amino acids involved in cross-linking with FXR and RXRα. On the right, the residues in FXR-RXRα cross-linked to SRC1 were shown, and the connections were represented by red lines (FXR, pink; RXRα, slate).
We performed BLI assay in vitro to test the binding affinity of the SRC1630-987 with NR-box mutants to FXR120-RXRα98 (Fig. 5B). The results revealed that the M2 single mutant completely abolished the binding ability of SRC1630-987 to FXR120-RXRα98. Similarly, the M1/2, M2/3, and M1/2/3 mutants also showed a complete loss of binding ability to FXR120-RXRα98. The M3 mutant exhibited an approximately two-fold reduction in its affinity to FXR120-RXRα98. The M1/3 double mutant displayed a further decrease in affinity compared to the M3 single mutant. Interestingly, the M1 single mutant did not show significant affinity change compared to the wild type SRC1630-987. These findings demonstrate that NR-box2 of the NRID domain of SRC1 plays a crucial role in binding to FXR-RXRα, directly interacting with the complex. Additionally, NR-box3 is also important for the interaction, potentially assisting the binding of NR-box2 to FXR-RXRα.
We then employed a luciferase reporter gene system to assess the effects of SRC1 mutants on FXR-RXRα transcriptional activity in cell (Figs. 5C, S7A and S14). The results demonstrated that the M1 mutant of SRC1 did not show a significant difference in their ability to enhance FXR-RXRα transcriptional activation compared to the wild type SRC1. However, both the M2 and M3 mutants led to a notable decrease in FXR-RXRα transcriptional activation. In agreement with the binding assay, the M2 mutant exhibited a more pronounced reduction in FXR-RXRα transcriptional activity compared to the other mutants. These findings highlight the importance of NR-box2 and NR-box3 within the NRID of SRC1 for the transcriptional activation function of FXR-RXRα.
To gain further insights into the specific binding details between SRC1 and FXR-RXRα, we utilized XL-MS experiments with BS3 to analyze the SRC1630-987-FXR120-RXRα98-hSHP-1 complex (Figs. S7B and S15D). The XL-MS analysis of the SRC1630-987 and FXR120-RXRα98 complex resulted in the identification of 7 cross-links with high confidence (score ≥ 10) (Fig. 5D). Among these cross-links, three were observed between SRC1630-987 and RXRα98 (Fig. 5D). However, within these, the amino acids cross-linked to SRC1630-987 were all located outside the RXRα coactivator binding surface (Fig. 5E). This suggests that SRC1630-987 is not bound to the coactivator binding surface of RXRα-LBD. The remaining four cross-linking sites identified by XL-MS were located between SRC1630-987 and FXR120 (Fig. 5D). Three of these pairs were found to be located on the coactivator binding surface of FXR-LBD and the NR-box3 of SRC1630-987. The other pair was also located near the coactivator binding surface of FXR-LBD (Fig. 5E). This suggests that NR-box3 of SRC1 is in close proximity to the coactivator binding surface of FXR. These findings corroborate well with that both NR-box2 and NR-box3 of SRC1 are involved in mediating the function and interaction of SRC1 with the FXR-RXRα heterodimer.
Discussion
Given the significant therapeutic potential of FXR in treating MASH45,46, it is essential to comprehend the molecular mechanisms underlying FXR transcriptional regulation to aid in the rational drug design. In this study, we generate the first model for the complex formed by agonist/DNA-bound FXR-RXRα heterodimer and the complete SRC1-NRID domain. Using this model, we propose a mechanism elucidating how agonists and DNA co-regulate the recruitment of SRC1 by FXR-RXRα (Fig. 6).
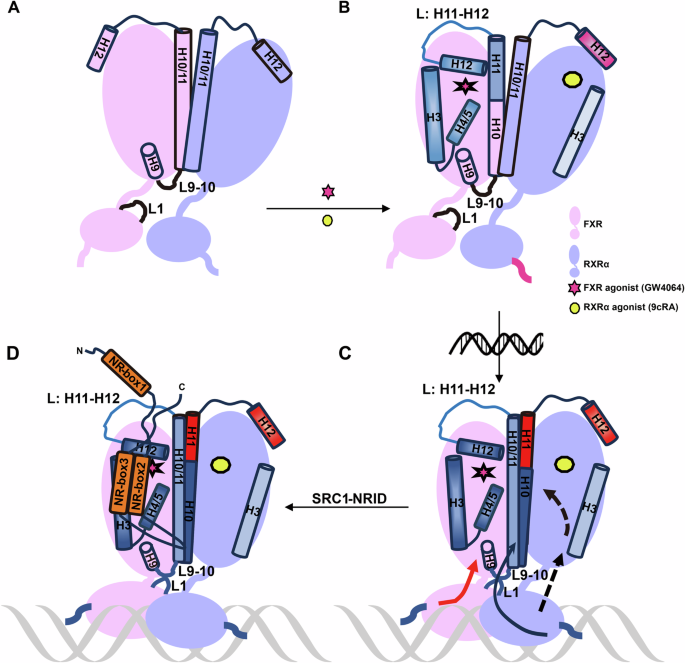
A Model of FXR-RXRα without agonist binding. B Schematic of FXR-RXRα binding with agonists. Upon agonist binding to FXR-RXRα (red stars for FXR agonist GW4064; yellow circles for RXRα agonist 9cRA), the cofactor binding surface of FXR, including H3, H4, H12, L:H11-12, and H11, was stabilized and ready for coactivator recruitment. In contrast, the H12 of RXRα-LBD becomes more flexible upon agonist binding, impeding coactivator recruitment (blue indicates structural stability; red indicates flexibility, with color intensity showing the degree of stability or flexibility). The DBD of RXRα also becomes more flexible upon agonist binding, potentially aiding its binding to DNA response elements. C Schematic of FXR-RXRα binding with agonist and FXRE. FXRE binding signals are transmitted at FXR and RXRα, respectively. On one hand, the binding of FXRE compacts the structure of FXR-RXRα, bringing FXR-LBD and FXR-DBD closer together. The L9-10 of FXR-LBD and the L1 of RXRα-DBD transmit signals from the DNA to the FXR-DBD and then to the FXR-LBD, further stabilizing the coactivator binding surface (red arrow). On the other hand, FXR and RXRα communicates through its DBD, enhancing the dimerization of the LBD of FXR and RXRα through the allosteric effect of RXRα (black arrow). This joint action promotes the stabilization of the coactivator binding region on the surface of FXR-LBD, which is conducive to the recruitment of coactivators. For RXRα-LBD, FXRE binding further enhances the flexibility of H12 and significantly increases the HDX rate of H11, thereby impeding the binding of the coactivator to the RXRα-LBD cofactor binding surface. D Schematic representation of the asymmetric recruitment of SRC1 to FXR-RXRα-FXRE. NR-box refers to the α-helix formed by the LXXLL motif.
Interestingly, an interaction interface formed by the L9-10 of FXR-LBD and the L1 of FXR-DBD was found in our model, and this interface is important for the transcriptional activation activity of FXR-RXRα (Fig. 2). The similar interface has been observed in other solved crystal structures of NR multi-domain protein and DNA complexes47, such as PPARγ-RXR (PDB: 3DZU), LXR-RXR (PDB: 4NQA), RAR-RXR (PDB: 5UAN). Our findings reveal a novel insight that DNA binding is the key factor that brings the DBD and LBD of FXR closer together, facilitating the formation of DBD-LBD interface (Fig. S5A, B). Additionally, DNA binding stabilizes the heterodimer interface formed by the LBDs (Fig. S4). In our previous work, we emphasized the critical roles of FXR’s H10 histidine and RXR’s H10 glutamate in mediating communication between FXR-LBD and RXR-LBD. Therefore, it is suggested that FXR’s H10 histidine and RXR’s H10 glutamate may also significantly contribute to transmitting the FXRE binding signal from the DBD to the LBDs (Fig. 6C).
Our HDX-MS studies have revealed that agonists binding to FXR-RXRα heterodimer not only protects the LBP of FXR but also stabilizes its coactivator binding surface (Fig. 3A). Whereas agonists binding increases the flexibility of RXRα-DBD within the heterodimer, a similar phenomenon was also observed in VDR-RXR21. The increased RXRα-DBD flexibility after ligands binding may be a common feature among NR heterodimers, which can facilitate rapid recognition of specific DNA sequences.
In contrast to the crystal structure using only short peptides, our biochemical and cellular findings demonstrate that only one SRC1, containing the complete NRID, asymmetrically binds to FXR in FXR-RXRα through its NR-box2 and box3 (Fig. 6D). We note that in the crystal structure of PGC-1α (with the complete NRID domain) bound to HNF4α-LBD, only one LXXLL motif is observed, but electron density analysis implies the potential presence of multiple LXXLL motifs48. Previously, one crystal structure of FXR-LBD (PDB ID: 1OSV) showed its capability to interact with two LXXLL peptides, with one peptide in the conventional coactivator binding region and another in the region directly next to the first14. These results imply that the interaction between NRs and coactivators is intricate, and the coactivator binding interface may not exclusively recruit coactivators through a single LXXLL motif.
Furthermore, we note that the pattern of asymmetric coactivator binding to one monomer of the RXR heterodimer was also observed in RAR-RXR, VDR-RXR, PPARγ-RXRα, and TR-RXRα49,50, and even between PGC-1α and ERRα/ERRγ homodimers51. Although studies have demonstrated that each monomer in the CAR-RXR heterodimer can recruit SRC1, it is important to highlight that the protein used in these studies only consisted of the LBD domain52. Our findings showed that DBD and DNA have a significant impact on the binding of coactivators to NR (Fig. 1C). Studying multi-domain NR can provide more physiologically relevant results. The asymmetric binding of coactivators to NR dimers we proposed here for FXR may suggest a common feature for NR. However, the molecular mechanisms underlying this phenomenon are still not fully understood. Our HDX-MS results demonstrated that agonists binding increase flexibility of H12 in RXRα-LBD, and this effect is further enhanced by DNA binding (Fig. 3). Moreover, we find that the HDX rate of RXR-H11 significantly increased upon DNA binding (Fig. 3B). Simulation data from Diaz-Holguin et al. indicated that antagonist binding would destabilize H11, L:H11-H12 as well as H12 of FXR, thereby preventing its recruitment of coactivators44. Therefore, we speculate that the increased flexibility of one monomer of the NR dimer in H11-H12 of its LBD may account for the extensive asymmetric binding of the coactivator to the NR dimer.
Studies by Maletta et al. have shown that different DNA can induce different conformations in NR, directly affecting the spatial arrangement of NR cofactors53. And there is a correlation between the asymmetry of the NR complex structure and the spatial localization of proteins involved in chromosome remodeling, as this localization could potentially impact the transcriptional activity of downstream genes49,53. So, we speculate that in ligand-dependent activated nuclear receptors, conformational changes induced by specific small molecule binding facilitate the binding of DBD to specific DNA motifs, followed by recruitment of coactivators and coregulators. The specific combinations of NRs, coactivators, and coregulators, as well as their positioning and interactions within the gene regulatory network, confer a highly specific impact on the transcriptional activity of genes. This will provide valuable insights for the design of gene-selective agonists. And these results also shed light on the NRs HTRF assays, as it may not be sufficient to rely solely on isolated LBD domains or a monomer within a heterodimer for screening purposes.
Our work not only enhances the comprehension of the structure and function of the FXR transcriptional regulatory complex, but also adds to the increasing body of evidence highlighting the intricate nature of coactivator binding to NR.
Methods
Protein expression and purification
The FXR120-486 and RXRα98-462 were cloned into the pET-Duet-1 vector. Plasmids were transformed into E. coli Rosetta2 (DE3) cells and cultured in lysogeny broth (LB) medium at 37 °C until the optical density at 600 nm reached 0.6–0.8. Recombinant protein was induced by the addition of 0.1 mM isopropyl β-d-1-Thiogalactopyranoside (IPTG) and incubated at 16 °C for 20 h. Cells were harvested by centrifugation at 4000g for 10 min, lysed in buffer containing 20 mM Tris pH8.0, 300 mM NaCl, 1 mM TCEP, and 1 mM PMSF, and then subjected to ultracentrifugation at 13,400g for 40 min at 4 °C. After centrifugation, the supernatant was loaded onto a Ni-NTA agarose resin, and proteins were eluted with the addition of 300 mM imidazole. The FXR and RXRα heterodimer were further purified using a Source Q anion exchange column and a gel filtration column. The final elution buffer for the Superdex 200 10/300 GL column (GE Healthcare) was 20 mM HEPES pH 7.5, 150 mM NaCl, and 0.5 mM TCEP.
To investigate the truncation containing three LXXLL motifs within the SRC1 protein (630-987), the corresponding fragment was cloned into the pET28a vector. The plasmids were transformed into E. coli BL21 (DE3) cells. Recombinant protein expression was induced by the addition of 0.1 mM IPTG, and the cells were incubated at 16 °C for 20 h. The cells were then collected as previously described. The cells were lysed in a solution of 20 mM Tris pH 7.5, 300 mM NaCl, and 6 mM β-Mercaptoethanol (β-Me), and the supernatant was purified by Ni-NTA column. Subsequently, the SRC1630-987 protein was further purified using Source Q and gel filtration chromatography columns according to the previously described protocol.
The human SHP-1 sequence (5′-GATCCCTGAGTTAATGACCTTGT-3′) and its corresponding antisense strand were synthesized by Azenta Life Science. The two strands were solubilized in a buffer containing 20 mM HEPES, pH 7.5, 150 mM NaCl, and then diluted to a concentration of 1 mM. Subsequently, the two strands were annealed by combining equal amounts of each strand and heating them to 95 °C, followed by a slow cooling to 25 °C.
To purify SRC1630-987-FXR120-RXRα98-hSHP-1, purified SRC1630-987 and FXR120-RXRα98 were combined at a molar ratio of 1:4, along with the FXR agonist GW4064 and RXRα agonist 9cRA. Subsequently, hSHP-1 was added to the mixture at a molar ratio of 1:1.5 relative to FXR120-RXRα98. The mixture was thoroughly mixed and incubated on ice for 2 hours. Afterward, it was centrifuged at 12000 rpm for 10 min at 4 °C, followed by purification using Superdex 200 10/300 GL with a buffer containing 20 mM HEPES pH 7.5, 150 mM NaCl, and 0.5 mM TCEP.
BLI kinetic assay
The binding affinities of SRC1630-987 and hSHP-1 towards FXR120-RXRα98 were determined using BLI on an Octet R8 (Sartorius). All experiments were performed at 25 °C in a buffer containing 20 mM HEPES pH 7.5, 150 mM NaCl, 0.02% Tween-20. Purified 6× His-tagged FXR-RXRα protein was diluted with HEPES buffer into different concentrations (i.e., 1000 nM, 500 nM, 250 nM, 125 nM). Streptavidin biosensors were pre-equilibrated in the buffer for at least 10 min before use in experiments. The biotinylated SRC1 and hSHP-1 proteins were loaded onto the streptavidin biosensors for durations of 60 s and 40 s, respectively. Following a period of association for 210 s, the biosensors were transferred to the HEPES buffer to measure dissociation over a period of 420 s. Results were analyzed by ForteBio Data Analysis software.
Cross-linking mass spectrometry
Crosslinking reactions were conducted in 100 µL protein solutions in 20 mM HEPES pH 7.5, 150 mM NaCl, 1 mM TCEP. FXR-RXRα samples with and without ligands and SRC1630-987 were crosslinked in HEPEs buffer using Bis[sulfosuccinimidyl] suberate (BS3, ThermoFisher) and 1-(3-Dimethylaminopropyl)-3-ethylcarbodiimide hydro (EDC, ThermoFisher). For BS3 crosslinking, freshly prepared 12.5 mM stock solution of BS3 in sterilized distilled water were added in 30-, 50- and 70-fold molar ratio to protein samples. Crosslinking reactions were conducted during 30 min at room temperature and further quenched during 15 min using Tris pH7.5 to a final concentration of 50 mM. For EDC crosslinking, freshly prepared 60 mM solution of EDC were added in 30- 50- and 70-fold molar ratio to protein samples. Then activator Sulfo-NHS was adding 2.5-fold molar ratio to EDC, mixed evenly, and reacted at room temperature for 2 hours or overnight on ice. The cross-linking reaction was terminated using a final concentration of 50 mM Tris pH 7.5 and 20 mM β-Me at room temperature for 15 min.
The gel band stained with Coomassie Brilliant Blue was fragmented and subjected to a series of washing steps, including water, 50 mM NH4HCO3 in 50% acetonitrile, and 100% acetonitrile. Following this, the protein was treated with 10 mM TCEP (ThermoFisher Scientific) in 100 mM NH4HCO3 at room temperature for 30 min for reduction and then alkylated with 55 mM iodoacetamide (Sigma) in 100 mM NH4HCO3 in the dark for 30 min. Subsequently, the gel pieces were washed with 100 mM NH4HCO3 and 100% acetonitrile, followed by drying with a SpeedVac. The dried fragments were then digested with trypsin by adding 12.5 ng/μL trypsin (Promega) in 50 mM NH4HCO3 for 16 h at 37 °C. The resulting tryptic peptides were extracted twice with 50% acetonitrile/5% formic acid and dried using a SpeedVac. The sample was reconstituted with 0.1% formic acid, desalted with a MonoSpinTM C18 column (GL Science, Tokyo, Japan), and dried once more with a SpeedVac.
Utilizing a custom-made 30 cm-long pulled-tip analytical column (75 μm ID containing ReproSil-Pur C18-AQ 1.9 μm resin from Dr. Maisch GmbH, Germany), the peptide mixture underwent analysis. Subsequently, the column was integrated with an Easy-nLC 1200 nano HPLC (ThermoFisher Scientific, San Jose, CA) for mass spectrometry investigation. Maintaining a temperature of 55 °C, the analytical column was used throughout the experiments.
Analysis of MS/MS data was carried out using a Q Exactive Orbitrap mass spectrometer (ThermoFisher Scientific). Control of MS scan functions and LC solvent gradients was managed by the Xcalibur data system provided by Thermo Scientific.
The identification of peptides with isopeptide bonds was performed using the pLink2 software (pFind Team, Beijing, China) according to previously established methods54,55. Parameters for the pLink search included: enzyme: trypsin; maximum missed cleavages: 3; tolerance for precursor and fragment ions: 20 ppm. Carbamidomethylation of cysteine was specified as a static modification, while oxidation of methionine was considered as a dynamic modification. The final results were refined using a 5% false discovery rate threshold at the spectral level.
Small-angel X-ray scattering (SAXS) data collection and processing
SAXS data is collected by SEC-SAXS on the BL19U2 beamline station of National Facility for Protein Science in Shanghai (NFPS) and Shanghai Synchronous Radiation Facilities (SSRF). The Superdex 200 Increase 10/300 GL column was equilibrated with a buffer solution comprising 20 mM Tris-HCl pH 7.5, 150 mM NaCl and 0.5 mM TCEP. Subsequently, a 15 mg/ml solution of FXR120-RXRα98-FXRE was loaded onto the column. The data collection wavelength was set at 1.033 Å. Use BioXTAS RAW software56 to take the average value of the scattering data, and then convert the 2D scattering image to a 1D SAXS curve. Use the GNOM57 in the ATSAS software package to calculate the particles P(r) and the maximum sizes D max based on the 1D SAXS curve, and use the DAMMIF to determine Low-resolution shapes from solution scattering data58,59. The fitting model’s quality was assessed by computing the χ2 value using CRYSOL57, and the fit of the docking model to the Ab initio modeling model computed from the experimental SAXS data is done by CIFSUP. SAXS parameters were shown in Supplementary Table 4.
Size-exclusion chromatography coupled to multi-angle light scattering (SEC-MALS)
The absolute molecular weights of protein complexes in solution were determined using size exclusion chromatography (SEC) coupled with multi-angle light scattering detection (SEC-MALS). Samples at a concentration of 3 mg/ml were loaded onto GE Healthcare Superdex 200 10/300 GL pre-equilibrated using buffer containing 20 mM HEPES pH 7.5, 150 mM NaCl and 1 mM TCEP. The samples separation and subsequent detection were performed using an Agilent HPLC system and a MALS instrument (DAWN + ECLIPSE; Wyatt Technologies, USA) at a flow rate of 0.5 ml/min. Data were processed using ASTRA 8 software.
Structural modelling of FXR-RXRα binding to hSHP-1
Atomic models of FXR-RXRα-IR1 were constructed by leveraging crystal structures from FXR-RXRα-LBD (PDB: 5Z12,6A5Z) and FXR-RXRα-DBD-IR1 (PDB: 8HBM) using DISVIS60,61, and the LZerD Web server42,43 in combination with distance constraint information provided by XL-MS. Initially, crosslinking pairs’ data in the protein complexes were analyzed with DISVIS, eliminating pairs exceeding the crosslinker’s distance limit and those exhibiting unreasonable configurations. This analysis also helped identify potential active residues. Through DISVIS analysis of 26 high-intensity cross-linking peptides (pLINK2 calculated score ≥ 10), information on active residues on the surface interface between FXR-RXRα-LBD and FXR-RXRα-DBD-IR1 was extracted. Subsequently, utilizing this data, protein models were docked employing the LZerD web server, resulting in a series of composite models.
Hydrogen/deuterium exchange (HDX) mass spectrometry experiments
All three samples (FXR120-RXRα98, FXR120(GW4064)-RXRα98(9cRA), FXR120(GW4064)-RXRα98(9cRA)-hSHP-1) were prepared in a buffer composed of 20 mM HEPES at pH 7.4 and 150 mM NaCl, resulting in a final complex concentration of 3 mg/ml per reaction. The automated processing of samples was facilitated by a LEAP Technologies Hydrogen Deuterium Exchange PAL system located in Carrboro, NC. Chromatographic separation was conducted using a U3000 RSLC nano HPLC system. Hydrogen Deuterium Exchange (HDX) measurements were recorded at various time points (0 s, 10 s, 30 s, 120 s, 600 s, and 1800 s) while maintaining a temperature of 4 °C. In the chromatography process, mobile phases A and B consisted of 0.1% formic acid in H2O and 0.1% formic acid in an acetonitrile solution, respectively. Following deuteration with D2O, all samples were quenched using a buffer solution (200 mM citric acid, 4 M guanidine-HCl, 500 mM TCEP in H2O, pH 2.5). Subsequently, the samples were digested with pepsin, trapped on a C18 trap, and separated on C18 analytical chromatography columns. For peptide identification, a Thermo LTQ Orbitrap-Elite mass spectrometer (San Jose, CA) was used for detection and analysis. HDX experiments were realized in triplicate for each time point. Mass spectra was adopted data-dependent acquisition (DDA) mode at the m/z range of 300–1500 to provide Peptide Source for data analysis. The spectra generated were searched in PEAKS online with a home-made protein sequence library to screen Peptide Source. Retention time and sequence information for each peptide was carried out using HDExaminer 2.0 (Sierra Analytics Inc., Modesto, CA). Using DDA data as reference, deuterium uptake of peptides and predicted amino acids was calculated. The uptake of deuterium was calculated using the software algorithm via matching the best theoretical isotope distribution pattern to the observed isotope distribution pattern. Statistical significance for the differential HDX data is determined by t-test for each time point.
Luciferase assay
Luciferase reporter gene assays were conducted using HEK293T cells (Cell Bank of Chinese Academy of Sciences, China). The cells were seeded at a density of 25,000 cells/well in a 96-well plate and cultured in DMEM supplemented with 10% fetal bovine serum at 37 °C, 5% CO2 for 24 h. Co-transfection was performed using Lipofectamine 2000 (Thermo Fisher Scientific) and Opti-MEM, with a mixture containing 70 ng of hSHP-1-luciferase reporter gene, 70 ng of pcDNA3.1-human FXR, RXRα, and SRC1, and 10 ng of Renilla internal reference control. After 6–8 h of transfection, the Opti-MEM medium was replaced with DMEM. Concurrently, ligands for nuclear receptors (GW4064 for FXR and 9cRA for RXRα) were added at a final concentration of 100 nM. After 24 hours of treatment, the cells were lysed, and the transcriptional activity was quantified using the dual luciferase assay system from Promega.
Circular dichroism (CD) to determine the secondary structure experiment
CD was performed as previously described62. The purified protein is prepared into a sample solution of 0.4 mg/mL using PB buffer. Nitrogen values are collected directly using a constant flush of nitrogen without any objects in the sample cell. The PB buffer is then loaded into a 1 mm diameter cuvette for assay. Finally, use the same cuvette from the previous test PB buffer to place the sample solution to be tested. The sample solution was measured using a circular dichroic, the data acquisition method was set to Time-per-point to 2.0 s, the bandwidth was set to 1 nm, the scanning range was set to 190–250 nm, and each sample was scanned in three replicates.
Statistics and reproducibility
Luciferase reporter gene assays was repeated for two or three times. Statistical analyses were performed using GraphPad Prism 7 software.
Reporting summary
Further information on research design is available in the Nature Portfolio Reporting Summary linked to this article.


Responses