Diminished contribution of spring phenology to early-season carbon uptake in a changing climate

Introduction
Climate change has led to an earlier start of the growing season (SOS) in temperate and boreal regions, and continued warming is expected to further advance SOS in the future1,2,3. Previous studies have reported that earlier SOS has increased terrestrial carbon uptake by extending the duration of carbon uptake4,5. Recent research indicates that vegetation physiological processes, such as daily photosynthesis rates, also play a crucial role in regulating terrestrial carbon uptake6,7. The early growing season (EGS), defined as the period from SOS to the peak of the growing season when photosynthetic rates are highest, impacts plant growth, ecosystem productivity, and carbon storage5,8. The effects of an earlier SOS on annual forest carbon uptake have been estimated to be twice as influential as delayed foliar senescence in autumn9. However, the specific influence of an earlier SOS on vegetation carbon uptake during the EGS and the underlying mechanisms involved remain poorly understood.
Interannual variation in total gross primary productivity (GPPtotal) during the EGS is determined by the duration of the EGS and the mean daily rate of carbon uptake (GPPrate) during this period: GPPtotal = EGS × GPPrate6,7. Recent research has indicated that climatic warming leads to advances in both the start (SOS) and peak-of-season10,11. If the rate of advancement of SOS exceeds the advancement of the peak-of-season, the EGS will extend, potentially increasing GPPtotal12. However, it remains unclear whether this is the case and how large the impact of an earlier SOS on GPPrate during the EGS is. An earlier SOS may increase GPPrate during the EGS by increasing foliar area13,14. Conversely, an earlier EGS due to advances in both the SOS and peak-of-season may increase late frost damage to leaves, and reduce the mean daily air temperature and the availability of soil water during the EGS, leading to a decrease in GPPrate15,16. Yet, it remains unclear whether an earlier SOS increases vegetation carbon uptake during the EGS via extending EGS and what role changes in GPPrate play in this process.
Temperature and soil-water availability play pivotal roles in determining the variation in vegetation phenology and carbon uptake across regions17,18,19. The aridity index is a useful metric for assessing regional environmental differences because it identifies simultaneous changes in temperature and water availability. Temperature acts as the primary factor limiting vegetation carbon uptake in cold and humid regions. Climatic warming could advance the SOS in these regions, and increase EGS GPPrate by increasing enzyme activity, ultimately leading to higher vegetation GPPtotal14,19,20. Conversely, in hot and dry areas, limited water availability becomes the dominant constraint on vegetation carbon uptake21. Rising temperatures and advancing SOS may thus exacerbate soil moisture deficits through increased evapotranspiration, which in turn reduces stomatal conductance and limits evaporative cooling, resulting in lower GPPrate and GPPtotal in regions with high aridity22,23,24. The mechanisms driving changes in vegetation carbon uptake due to an earlier SOS should therefore differ among regions with varying aridity levels25. An earlier SOS could also affect early-season carbon uptake through intrinsic developmental processes. For example, in humid regions, elevated vegetation photosynthesis (source activity) caused by earlier SOS under climatic warming may downregulate subsequent photosynthetic processes due to sink limitation and trigger an earlier peak-of-season26,27, affecting the duration, mean daily GPPrate, and GPPtotal during the EGS. These variations emphasize the complexity of the interactions between temperature, water availability, and vegetation growth28. The specific effects of an earlier SOS on the duration and mean daily GPPrate during EGS, and how these factors collectively regulate GPPtotal in different arid areas, however, remain areas of uncertainty that require further investigation.
Our objective was to quantify the impacts of an earlier SOS on EGS length and GPPrate and how this affects the overall vegetation carbon uptake during the EGS across different aridity levels in the Northern Hemisphere (>30°N). Specifically, we tested three main research questions. (1) Does an earlier SOS lead to an extension of the EGS, potentially increasing GPPtotal, considering that the peak-of-season likely advances more slowly than the SOS10? (2) If so, does an earlier SOS lead to a reduced daily GPPrate, due to possibly lower air temperatures and/or soil-water availability during an earlier and extended EGS11,15,22? (3) Does a lower daily GPPrate offset the potential increases in GPPtotal during the EGS, particularly in arid areas20? To achieve these objectives, we used 20-year (2000-2019) satellite-based GPP (Modis_GPP and FluxSat_GPP) and clear-sky solar-induced chlorophyll fluorescence (CSIF) data, and 442 year-site carbon-flux measurements from 37 sites. We used various approaches, including structural equation models (SEMs) and empirical equations (see Methods), to quantitatively assess the direct and indirect effects of an earlier SOS on both mean daily GPPrate and GPPtotal during the EGS along aridity gradients.
Results
Response of early-season carbon uptake to changes in spring phenology
For the 20-year Modis_GPP data set, an earlier SOS was correlated with an extension of the EGS in more than 87% of the studied sites (Figs. 1A and S1A). Consistent results were obtained for the FluxSat_GPP and CSIF observations (Fig. S2A, B), and carbon-flux measurements (Figs. 1B and S3A). We also explored the relationship between SOS and peak-of-season and found that the advances in peak-of-season were slower than SOS advances (Figs. S1B, S3B, S4A, B, and S5A, B). Peak-of-season advanced by an average of 0.3 days for each day earlier SOS. These findings demonstrate asynchronous changes in SOS and peak-of-season, such that an earlier SOS results in a longer EGS.

A–F Spatial patterns (Modis_GPP data), frequency distributions (flux data), and overall regression (Modis_GPP and flux data) of pixel/site-level correlations between SOS, and duration of the early growing season (EGS, A, B), total carbon uptake during EGS (GPPtotal, C, D) and mean daily rate of carbon uptake during the EGS (GPPrate, E, F). The black dots in A, C, and E indicate significant correlations at P < 0.05. The percentages of areas of positive (P) and negative (N) correlations between SOS and each corresponding variable are shown, and the significant percentages are displayed in parentheses. The bottom-left panels in A, C, and E, and the bottom panels in B, D, and F show the overall regression between the two variables. Time-series data for each variable from each pixel/site of the Modis_GPP/flux data were detrended and standardized using Z-scores.
The satellite-based GPP and CSIF observations, and ground-based carbon-flux measurements indicated that an earlier SOS increased GPPtotal during EGS in more than 73% of the studied sites (Figs. 1C, D and S2C, D). We obtained similar results across vegetation types (Figs. S1C and S3C), and the correlation was particularly pronounced at high latitudes with high water availability (Figs. 1C, D and S2C, D). However, an earlier SOS was associated with a lower mean daily GPPrate during EGS in more than 67% of the studied sites (Figs. 1E, F and S2E, F). Similar results were obtained across vegetation types for both the Modis_GPP and carbon-flux data (Figs. S1D and S3D). An earlier SOS was also associated with a lower GPPmax (Figs. S1E, S3E, S4C. D, and S5C, D).
Effects of spring phenology on early-season carbon uptake depend on aridity
The Modis_GPP data indicated that the effects of SOS on EGS, GPPtotal, and mean daily GPPrate during EGS depend on aridity (Fig. S6A–C). Specifically, the extension of the EGS due to an earlier SOS increased with aridity (Fig. S6A), whereas the increase in GPPtotal with an earlier SOS decreased with increasing aridity (Fig. S6B). These results indicate that while EGS extensions are less pronounced in humid regions compared to arid areas, EGS GPPtotal shows a stronger increase. Linear mixed-effects models and SEMs produced similar results (Table S1, Figs. S7–S9).
The reduction in mean daily GPPrate during the EGS under an earlier SOS was smaller in humid than arid areas (Table S1, Figs. S6C and S10). This pattern is attributed to the fact that water availability has only minor effects on GPPrate during EGS in humid regions, whereas air temperature is the primary limiting factor (Figs. S11 and S12). The results for the effects of SOS on GPPmax were similar (Table S1, Fig. S6E). An earlier SOS reduced mean daily air temperature and soil-water content during the EGS (Figs. S1F, G and S3F, G).
Biotic and climatic drivers of early-season carbon uptake
Structural equation models (SEMs) using Modis_GPP, FluxSat_GPP, CSIF, and carbon-flux data indicated that SOS indirectly affected GPPtotal via EGS and GPPrate (Figs. 2 and S13–S21). Specifically, we found that an earlier SOS enhanced GPPtotal during the EGS by extending the EGS (Figs. 2 and S13). Interestingly, an earlier SOS indirectly reduced EGS GPPrate via mean daily air temperature and soil-water content during the EGS (Figs. 2 and S13). We obtained consistent results for different vegetation types across varying aridity levels in the Modis_GPP data set (Figs. S14–S21).
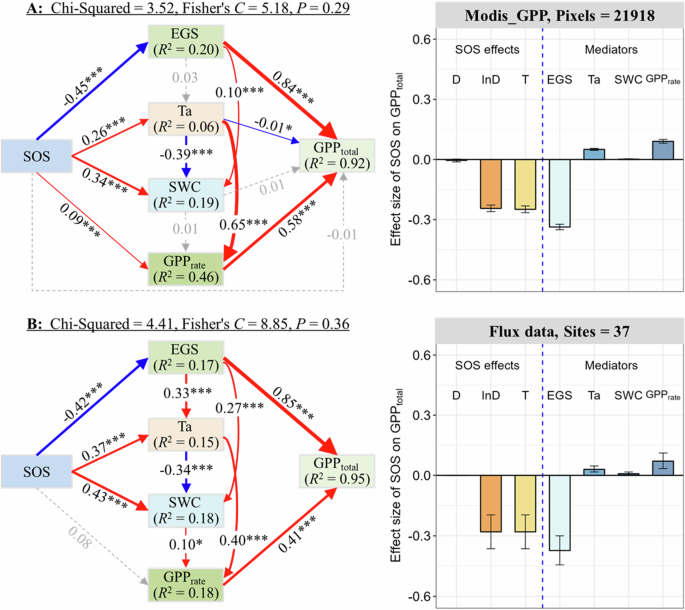
A, B SEMs are shown in the left panels for the Modis_GPP data (A) and the flux data (B). The right panels show the effect sizes of SOS on GPPtotal through direct effects (SOS effects) and indirect effects via ‘mediator’ variables (mediators). Ta mean daily air temperature during EGS, SWC mean soil-water content during the EGS, GPPrate mean daily rate of carbon uptake during the EGS, GPPtotal total carbon uptake during the EGS, D direct effect, InD indirect effect, T total effect. The statistical parameters of the SEMs are shown at the top of each SEM. The error bars in the histograms represent 95% confidence intervals. *, P < 0.05; ***, P < 0.001. Time-series data for each variable from each pixel/site of the Modis_GPP/flux data were detrended and standardized using Z-scores.
We further examined the relationship between EGS duration and mean daily GPPrate during the EGS, and found that EGS duration was not significantly (P > 0.05) related to the GPPrate during the EGS in more than 85% of the studied sites in the Modis_GPP and flux data (Fig. S22A, B). Furthermore, the results from the SEM in the Modis_GPP data indicated that the EGS had little influence on the mean daily GPPrate during the EGS via direct and indirect effects (Fig. S22C).
Importantly, an earlier SOS reduced the mean daily GPPrate during the EGS, offsetting increases in EGS GPPtotal due to EGS extensions by an average of 30%, ranging from ~85% in arid areas to ~15% in humid areas (Figs. 3 and S23). These findings were further supported by empirical equations (Fig. S24), suggesting that the contribution of an extended EGS caused by an earlier SOS to carbon uptake was substantially smaller.
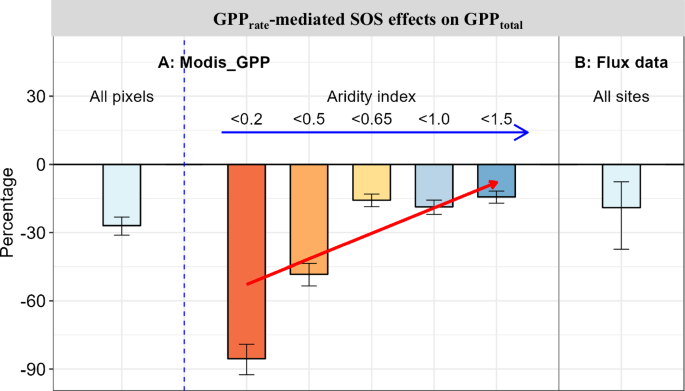
These results are derived from the structural equation models in Figs. 2 and S7. A, B The bars show the mean percentages of the GPPrate-mediated SOS effects relative to the total SOS effects on GPPtotal during the EGS for the Modis_GPP data across all pixels (left bar) and in different aridity zones (A), and for the flux data (B). The error bars in the histograms represent 95% confidence intervals. Note that lower aridity-index values correspond to drier climatic conditions.
Discussion
Due to an extended early growing season (EGS) under climate change, total carbon uptake (GPPtotal) during this period has increased over recent decades across northern ecosystems. In this study, we demonstrate the offsetting effect of a decreased mean daily carbon uptake rate (GPPrate) – driven by an earlier start of carbon uptake (SOS) – on the overall increase in GPPtotal during the EGS. Recent studies have shown that climatic warming advances the onset of spring, thereby increasing early-season GPP through an extended duration of carbon uptake4,9,12, but did not test the effects of SOS-induced changes in vegetation physiology in comparison to phenological effects on EGS GPPtotal and the underlying mechanisms. The changes in GPPtotal during the EGS are jointly controlled by EGS duration and GPPrate6,7, while other predictors, such as SOS, temperature, and soil moisture, indirectly regulate the GPPtotal via EGS duration and GPPrate (Figs. 2 and S13). Here, we show that earlier SOS-induced reductions in mean daily GPPrate during the EGS driven by lower temperatures and soil-water content during this period offset, on average, 30% of the increases in EGS GPPtotal due to extended EGS duration (Fig. 3). This suggests that if we only consider the changes in EGS caused by earlier SOS and ignore the mean daily GPPrate, GPPtotal during the EGS may be overestimated. Notably, the offsetting effect of decreased GPPrate on EGS GPPtotal is more severe in arid regions (~85%) compared to humid ones (~15%), suggesting that the current increase in northern ecosystem carbon uptake could be substantially offset by ongoing global warming and drought conditions.
Previous studies have reported that early-season GPP plays a crucial role in determining annual ecosystem productivity and carbon storage5,8. Here, we show that an earlier SOS increased GPPtotal during the EGS using satellite-based GPP and CSIF data, and ground-based carbon-flux measurements (Figs. 1C, D and S2C, D). Two mechanisms may have driven the response of GPPtotal to changes in SOS: (1) an earlier SOS may have extended the EGS period during which carbon could be taken up by plants13, and (2) an earlier SOS may have increased the mean daily GPPrate during the EGS and/or maximum daily GPP (GPPmax) if SOS advances are associated with increases in GPPrate and GPPmax1,6,29. Our data supported the first possibility, showing asynchronous changes in SOS and peak-of-season, with each day of an earlier SOS leading to an, on average, 0.7 days longer EGS (Figs. 1A, B and S2A, B). Conversely, our data did not support the second possibility (Figs. 1E, F and S2E, F).
Temperature and soil-water availability are important factors in mediating vegetation carbon uptake. An earlier SOS advances the peak-of-season timing due to intrinsic self-regulation mechanisms in the life cycle of plants30,31, leading to an overall earlier EGS. Given that the average peak-of-season date occurs before the maximum temperature in northern ecosystems10,11, it is no surprise that an earlier SOS can lead to a lower mean daily air temperature during the EGS, and then reduce the GPPrate during the EGS (Fig. S11). Moreover, an earlier SOS could decrease soil-water availability through increasing transpiration16,22, which results in a lower GPPrate during the EGS (Fig. S10). These may also explain why the effects of SOS on GPPrate are more pronounced in arid regions, where water availability is a more significant constraint (Fig. S12). These findings suggest that increased soil-water stress due to an earlier SOS is the main factor limiting GPPrate in arid areas17,21, whereas decreased temperatures due to an earlier SOS and peak-of-season limit GPPrate in humid areas11,19.
The effects of an earlier SOS on vegetation carbon uptake and the underlying mechanisms likely vary across aridity gradients due to the distinct primary factors in limiting vegetation carbon uptake in these regions32. We found that the effects of SOS on EGS, GPPtotal, and GPPrate depended on aridity (Fig. S6A–C). Specifically, while earlier SOS induced greater extensions in EGS in arid areas compared to humid areas, the increase in GPPtotal during the EGS was more pronounced in humid regions due to an earlier SOS. Previous research had suggested that an earlier SOS led to increased vegetation carbon uptake in humid areas19,20, which in turn induced an earlier end of the growing season due to sink limitation on plant growth26. Our results, demonstrated that the SOS-induced increase in GPPtotal during the EGS drove an earlier peak-of-season and a shorter EGS across varying aridity levels (Table S1, Fig. S6D)27.
Our findings support the general trend of earlier vegetation activity and enhanced carbon uptake (Fig. S25)1,10. However, our study provides additional insights by directly exploring the specific effects of SOS on GPPrate and GPPmax. Therefore, our results which focus on the interannual variation of SOS differ greatly from long-term temporal trends32. We found that an earlier SOS was consistently associated with a lower daily GPPrate during the EGS, contrasting with the general increases in GPPrate and GPPmax over time. These results imply that the ongoing advance of SOS, despite its association with increased vegetation carbon uptake in the long term, has a dampening effect on the daily GPPrate during the EGS. Furthermore, the GPPrate during the late season (e.g., the period from the peak to the end of the growing season) may be also lower due to restrictions of temperature and soil moisture on photosynthesis in this period under ongoing climatic warming and an earlier SOS19,22, which may offset the potential increases in early-season and annual carbon uptake8. However, whether this is the case, and to what extent changes in mean daily GPPrate during the late season affect late season and annual carbon uptake compared to phenological effects, remain to be explored in future studies. Overall, our findings suggest that the potential gains in total carbon uptake during the EGS, driven by its extended duration, may be partially counteracted by the lower GPPrate during the EGS under future climatic warming2,3.
A recent study demonstrated that an earlier SOS increased vegetation growth in cold humid areas but not in arid areas20. Our results indicat that reduced GPPrate due to increased soil-water stress diminished the positive effects of an earlier SOS on GPPtotal in arid areas (Figs. S7–S9 and S26). The potential mechanism may be that water availability is a primary factor limiting vegetation carbon uptake in arid areas21. Advances in SOS exacerbate soil moisture deficits through increased evapotranspiration, which in turn reduces stomatal conductance and increases cuticle thickness to minimize water loss, resulting in a lower CO2 diffusion and GPPrate22,24,33. In contrast, the negative effects of decreased GPPrate driven by an earlier SOS on GPPtotal were smaller in humid areas. Our findings emphasize the overall importance of early-season mean daily GPPrate in regulating the effects of vegetation phenology on vegetation productivity under warmer and drier climates22. However, given the potential impacts of ongoing climatic warming on vegetation phenology and physiology1,6,7, as well as the complexity of the interactions between climatic factors, canopy structure, and vegetation growth9,10,11, the specific effects of these factors on vegetation productivity during the early, late and entire growing season require further investigation using various analytical methods via distinguishing the spatial and temporal variations in these factors. Moreover, our results from the four data sets consistently indicated that the potential gains in GPPtotal during the EGS were partially counteracted by the reduced GPPrate during this period (Figs. 2, S13). Yet, the accuracy of current models in simulating vegetation physiological processes across various growing seasons—especially when incorporating limiting factors (e.g., soil moisture and temperature) and canopy structure data across different aridity levels—requires further validation in future studies.
In summary, we used a combination of satellite- and site-level observations across the Northern Hemisphere to demonstrate that an earlier SOS was accompanied by reductions in mean daily air temperature and soil-water content during the EGS, which subsequently led to a lower GPPrate during this period. This reduction in GPPrate tended to limit the expected increases in GPPtotal based only on the duration of carbon uptake (Fig. 4A). The GPPrate driven reductions of GPPtotal during EGS were more pronounced in arid areas, with reductions of approximately 85% compared to reductions of only 15% in humid areas (Fig. 4B). These findings indicate that the reductions in early-season rates of carbon uptake due to an earlier SOS may intensify under ongoing global warming. Our study provides important insights into the mediating effects of vegetation phenology on the terrestrial carbon cycle under global climatic warming. By highlighting the offsetting effects of an earlier SOS on early-season GPP and the subsequent overestimation of total vegetation carbon uptake, our findings emphasize the need to consider both the extension of the growing season and changes in photosynthetic rates to accurately assess the dynamics of carbon in response to climate change.
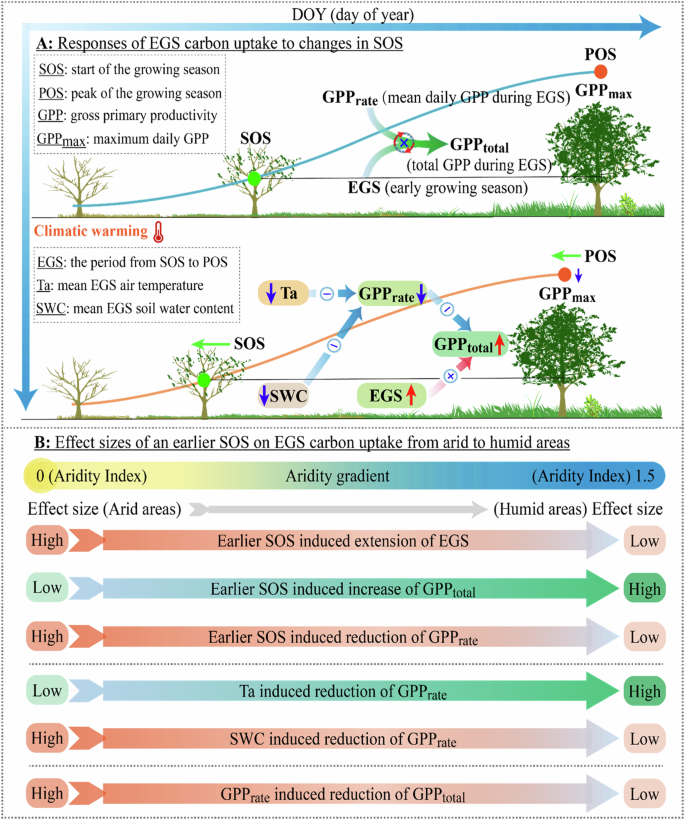
A, B The effects of an earlier SOS on GPPtotal during the early growing season (EGS) via biotic and climatic factors (A), and the effect sizes of an earlier SOS on vegetation carbon uptake during EGS along aridity gradients (B). Variation in EGS GPPtotal is determined by EGS duration and mean daily rate of carbon uptake (GPPrate) during the EGS. An earlier SOS extends the EGS and increases GPPtotal during the EGS but decreases the mean daily GPPrate during this period. Structural equation models indicate that an earlier SOS indirectly increases GPPtotal by extending the EGS. Reduced GPPrate due to decreased mean daily air temperature and soil-water content during the EGS, however, offsets the increases in GPPtotal during EGS by ~30% compared to scenarios where the EGS is extended but GPPrate remains constant. This offsetting effect depends on aridity, ranging from ~85% in arid areas to ~15% in humid areas (A). Notably, an earlier SOS has a smaller effect on the EGS extensions and GPPrate reductions in humid than arid areas, whereas its enhancing effect on GPPtotal is more pronounced in humid areas (B). The effect sizes of an earlier SOS on vegetation carbon uptake during the EGS from arid to humid areas, are derived from the results presented in Table S1 and Fig. S6. High and low effect sizes represent relative not absolute numbers.
Methods
Satellite observations
We used a data set of MODIS gross primary productivity (Modis_GPP) data for 2000–2019 in northern ecosystems (>30°N) with 8-day temporal and 500 m spatial resolution34 to determine the effects of vegetation phenology and physiology on carbon uptake. The Modis_GPP data is a product derived from the MOD17A2HGF (Version 6.1) product (https://lpdaac.usgs.gov/products/mod17a2hgfv061/) based on light-use efficiency theory, in which GPP is proportional to absorbed photosynthetically active radiation35. The MOD17A2HGF is the improved MOD17, which has cleaned the poor-quality inputs from 8-day Leaf Area Index and Fraction of Photosynthetically Active Radiation (FPAR/LAI) based on the Quality Control (QC) label for every pixel. It has been widely used to explore the seasonal dynamics of vegetation, including phenological events and the carbon cycle28,36.
To comprehensively unravel the effects of vegetation phenology and physiology on carbon uptake and validate our findings based on satellite-based Modis_GPP observations, we also utilized global gridded daily estimates of gross primary production (FluxSat_GPP) and clear-sky solar-induced chlorophyll fluorescence (CSIF) data. We employed the FluxSat_GPP (V2.0) for 2000–2019 in northern ecosystems (>30°N) with a daily temporal and 0.05° spatial resolution (https://daac.ornl.gov/cgi-bin/dsviewer.pl?ds_id=1835). The FluxSat is an empirical GPP product, which upscales global eddy covariance GPP estimates with a neural network based on MODIS multispectral surface reflectance and top-of-atmosphere radiation37. The time series of daily FluxSat_GPP were averaged at 8-day intervals to match the temporal resolution of the Modis_GPP for subsequent analyses. We used a data set of clear-sky solar-induced chlorophyll fluorescence (CSIF) for 2000-2019 in northern ecosystems (>30°N) with 4-day temporal and 0.05° spatial resolution (https://osf.io/8xqy6/). The CSIF data set is a product derived from machine learning techniques applied to raw orbiting carbon observatory 2 (OCO-2) SIF data, utilizing predictor variables from MODIS surface reflectance data38. These data can identify the seasonal dynamics of satellite-observed CSIF and are highly consistent with eddy covariance-based estimates of GPP39.
We focused on natural vegetation by eliminating pixels representing water bodies, permanent wetland, cropland, urban and built-up land, mosaics of cropland/natural vegetation, permanent snow and ice, barren land, and unclassified pixels based on the classification of the International geosphere-biosphere programme (IGBP) of the MODIS land-cover map derived from the MCD12C1 Version 6 data product with 0.05° spatial resolution (https://doi.org/10.5067/MODIS/MCD12C1.006)40. The spatial resolution of all data sets was aggregated to 0.1° using the mean method to match the climatic data set. The Modis_GPP, FluxSat_GPP and CSIF data sets were filtered by excluding pixels that did not contain natural or unchanged vegetation during 2001-2019 from the MCD12C1 data product (Fig. S27). We also excluded pixels that had GPP/CSIF values with low seasonality and/or where the GPP/CSIF values peaked during October to April. Specifically, we excluded pixels with a mean GPP/CSIF from July to August <1.2-fold the mean GPP/CSIF from December to February41 and pixels for which GPP/CSIF was highest between October to April every year11.
We reconstructed the Modis_GPP, FluxSat_GPP and CSIF time series to daily temporal resolution using three commonly used methods: HANTS, Spline, and Savitzky-Golay11,42. The combination of these three methods was used to reduce uncertainty and bias associated with any individual method. We estimated SOS using the relative-threshold method to determine the effects of changes in SOS on vegetation growth during the early growing season (EGS)43. The choice of the relative-threshold method did not affect the interannual variability of vegetation phenology4. SOS for each year and pixel was defined as the date when GPP/CSIF reached 20% of the annual amplitude of the fitted curve44, and the peak of the growing season (POS) was defined as the date when GPP/CSIF was highest in the fitted seasonal curve. For each pixel/site at a specific year, the length of EGS was then calculated as the interval between SOS and POS. Compared to seasonal descriptions based on temperature thresholds8 or fixed months22, the definition of the early growing season utilizing the timing of phenological events is more suitable for analyzing the differences among different years of SOS induced changes in GPP during EGS and the underlying mechanisms in the same early growing season. For each pixel/site at a specific year, total gross primary productivity (GPPtotal) and mean daily rate of gross primary productivity (GPPrate) were calculated as the sum and mean value of daily GPP during EGS in each fitted curve, respectively. Maximum daily gross primary productivity (GPPmax) was defined as the absolute maximum value of the fitted daily curve in a year11. Finally, SOS, POS, EGS, GPPtotal, GPPrate, and GPPmax from the three fitted methods were averaged to reduce uncertainties caused by any single curve-fitting algorithm45.
Ground observations
We used carbon-flux measurements from the FLUXNET2015 data set (https://fluxnet.org/data/download-data/)46 to validate the findings from the satellite-based observations. We used daily GPPs derived from the nighttime partitioning method with variable USTAR thresholds [GPP_NT_VUT_REF] for subsequent analyses47,48. We selected a total of 37 carbon-flux sites with 442 site-year records using the following criteria: (1) the sites were in the Northern Hemisphere (>30°N), and the observations had >300 daily records per year between 1992 and 2014, (2) the data for each site were high-quality with a quality-control tag >0.75 for each year, (3) the sites had at least seven years of available data, (4) the sites were in natural ecosystems where the vegetation had pronounced seasonality with only a single growing season per year. The vegetation of the selected sites was classified into four functional types of the IGBP classification: 16 sites of evergreen-needleleaf forest (ENF) (192 site-years), 10 sites of deciduous broadleaf forest (DBF) (127 site-years), 5 sites of mixed forest (MF) (68 site-years), and 6 sites of grassland (GRA) (55 site-years). Detailed descriptions of each site are provided in Table S2 and Fig. S27.
Four double-logistic models (Beck, Elmore, Klosterman, and Gu) were used to fit the seasonal curves of GPP to identify seasonal behavior and to reduce the influence of outliers49. Finally, the Klosterman and Gu models were selected based on the root mean squared error (RMSE) between the observed and fitted curves (Fig. S28). Mean SOS was thus extracted from the smoothed GPP curves based on the Klosterman and Gu models. Similar to the satellite-based approach, SOS was defined as the date when GPP had reached 20% of the GPP maximum for each site-year combination. We also extracted the POS dates, EGS durations, GPPtotal, GPPrate, and GPPmax from the two fitted GPP curves and averaged them.
Climatic data set
We obtained gridded information for air temperature (Ta) and soil-water content (SWC) at hourly steps during 2000-2019 with a spatial resolution of 0.1 × 0.1° for northern ecosystems from the ERA5-land data set (https://cds.climate.copernicus.eu/cdsapp#!/dataset/reanalysis-era5-land?tab=overview). We used the variables “temperature at 2 m” and “volumetric soil-water layers 1 and 2” (0-28 cm)50. The aridity index (AI), defined as the ratio of annual precipitation to annual potential evapotranspiration, is a widely used index to assess variation in aridity51,52. The index provides a measure of the availability of water for potential vegetation growth and allows for both spatial and temporal comparisons53,54. AI was obtained from the Global-AI_PET_v3 data set for 1970-2000 (https://figshare.com/articles/dataset/Global_Aridity_Index_and_Potential_Evapotranspiration_ET0_Climate_Database_v2/7504448/4), with a high resolution (30 arc-seconds)54. Lower AI values correspond to drier climatic conditions.
We converted hourly Ta and SWC to daily averages. AI was rescaled to a resolution of 0.1° to match the climatic data. For the carbon-flux data, daily Ta was provided by the FLUXNET2015 data set. SWC was extracted from the ERA5-land data set because of the absence of data for some flux sites in the FLUXNET2015 data set. AI for each flux site was derived from the Global-AI_PET_v3 data set. Mean Ta and SWC during EGS for each pixel/site were calculated as the mean value of daily Ta and SWC from SOS to POS, respectively.
Statistical analyses
Data were analyzed using MATLAB (R2022b, https://www.mathworks.com/products/matlab.html) and R version 4.2.3 (The R Project for Statistical Computing, https://www.r-project.org/). All outliers exceeding ±3 standard deviations of the multi-year mean for each variable were removed55, and all variables of the satellite-based data were aggregated to 0.5 × 0.5° spatial resolution by calculating the mean. We evaluated the slopes and significance levels of POS, EGS, GPPtotal, GPPrate, GPPmax, Ta, SWC, and SOS using the corrcoef function of MATLAB for each pixel/site to determine the effects of an earlier SOS on vegetation growth. All time-series for each pixel/site were detrended to eliminate the influence of long-term trends on the correlation analysis by removing the linear trend over years using least-squares fitting56. We then calculated the yearly anomalies (Z-scores) of all variables for each pixel/site. The correlations between the yearly anomalies of each variable and SOS (Z_SOS) were then calculated across all satellite-based pixels and carbon-flux sites. Recent research indicates that similar effects of an earlier SOS on vegetation growth can be estimated from univariate and partial correlations20, so we ran simple linear regression analyses, linear mixed-effects models, and structural equation models (SEMs) and found similar results.
We identified differences in the effects of an earlier SOS on each variable across various aridity levels by correlating the pixel-level slopes of the correlations between each variable and SOS with the aridity index using ordinary least-squares regression for each vegetation type in the Modis_GPP data set. We also divided the pixels in the Modis_GPP data set into five arid areas based on the United Nations Environment Programme51: arid areas (AI < 0.2), semi-arid areas (0.2 < AI ≤ 0.5), dry subhumid areas (0.5 < AI < 0.65), humid areas (0.65 < AI < 1), and highly humid areas (1 ≤ AI < 1.5). Pixels with an AI > 1.5 were excluded because these pixels accounted for <5% of all pixels. The effects of an earlier SOS on each variable vary among vegetation types. To remove the effects of vegetation types on the results, we then ran linear mixed-effects models (lme4 package in R) for all Modis_GPP data. The pixel-level slopes between SOS and POS, EGS, GPPtotal, GPPrate, GPPmax, Ta, and SWC were used as response variables. The aridity index of five arid areas (0.2, 0.5, 0.65, 1 and 1.5) was included as fixed effects, and vegetation type was included as a random effect. We did not identify differences across arid areas for the carbon-flux data, because all sites were in humid areas (Table S2).
We also ran SEMs to distinguish between direct and indirect effects using ‘mediator’ variables57. We did so by determining the direct effect of SOS on GPPtotal during EGS and its potential indirect effects using EGS, Ta, SWC, and GPPrate during EGS based on theoretical and empirical knowledge (Fig. S29) using the piecewiseSEM R package58. The time-series data for each variable from each pixel of the Modis_GPP, FluxSat_GPP and CSIF data and each site of the carbon-flux data were detrended and standardized using Z-scores before the analysis to eliminate the influence of long-term trends and exclude spatial differences across vegetation types and arid areas. Possible paths of the SEMs were tested based on model fit calculated using chi-squared and Fisher’s C. A nonsignificant Fisher’s C (P > 0.05) indicates that the model fits the data well. Based on the selected SEMs, the direct and indirect effects were estimated using the semEff R package (https://murphymv.github.io/semEff/), and the standardized effect sizes and confidence intervals were calculated by bootstrapping 10,000 times.
We conducted the SEMs based on all data in all data sets and data for specific vegetation types in Modis_GPP data set to ensure the robustness and consistency of the results. We also identified the differences of the effects of SOS on GPPtotal among the five arid areas in the satellite-based data sets using SEMs. Given the large sample size of more than 430,000 site-year combinations in the three satellite-based data, we estimated the SEM paths and the direct and indirect effects using a stratified random-sampling method to efficiently and accurately test for the effects of SOS on GPPtotal. Specifically, for data with >8000 site-year combinations, we randomly sampled ~6000 site-year combinations and sampled 20 times based on the stratification of vegetation type and aridity level (five arid areas) with a fixed sampling proportion using the strata function (srswor method) of the sampling R package. The final SEM paths and the direct and indirect effects of SOS on GPPtotal were then calculated by averaging the values from the 20 samplings. This procedure allowed us to estimate the direct effects of SOS on GPPtotal, Ta, SWC, and GPPrate and to calculate the indirect effect of SOS on GPPrate via Ta, SWC and EGS(Ta/SWC/EGS-mediated effects of SOS) and the indirect effect of SOS on GPPtotal via GPPrate (GPPrate-mediated effects of SOS)59. We used standardized coefficients to represent the effect sizes of all paths for the direct and indirect effects for each SEM57,58. To quantify the contributions of the Ta/SWC-mediated effects of SOS on GPPrate and the GPPrate-mediated effects of SOS on GPPtotal across the five arid areas, we calculated the percentage of the effect size of Ta/SWC (standardized effect) relative to the total effect of SOS on GPPrate and the percentage of the GPPrate effect size (standardized effect) relative to the EGS effect size on GPPtotal. This effect proportion was similar to the percentage of the GPPrate effect size relative to the total effect of SOS on GPPtotal, demonstrating that SOS indirectly affected GPPtotal by altering EGS and GPPrate.
We developed the following approach based on empirical equations to validate the contribution of changes in GPPrate-mediated SOS to GPPtotal (hereafter referred to as C_GPPrate) estimated by the SEMs. GPPtotal during EGS can be determined by the length of EGS and the mean daily GPPrate during EGS: GPPtotal = EGS × GPPrate6,7. For the time-series data for each pixel/site from the satellite-based and flux data, the change in GPPtotal caused by a one-day advance in SOS can thus be described by Eq. (1). We divided Eq. (1) into the sum of the EGS-induced change in GPPtotal and the GPPrate-induced change in GPPtotal (Eq. (2)).
where t represents the date of SOS for the time-series data for each pixel/site, which ranges from minimum SOS + 1 to maximum SOS, and t-1 represents a one-day advance in SOS (t). The percentage of the GPPrate-induced change in GPPtotal relative to the EGS-induced change in GPPtotal can thus be described by Eq. (3):
The variables EGS(t), EGS(t − 1), GPPrate(t), and GPPrate(t − 1) were derived by fitting a linear function between EGS/GPPrate and SOS. Specifically, the fitted lines for EGS ~ SOS and GPPrate ~ SOS for the time-series data for each pixel/site were obtained using ordinary least-squares regression. EGS(t), EGS(t-1), GPPrate(t), and GPPrate(t − 1) were then extracted from the corresponding regression lines. The means of all pixels/sites for the first term {[GPPrate(t − 1) − GPPrate(t)] × EGS(t − 1)} and last term {[EGS(t − 1) − EGS(t)] × GPPrate(t)} in Eq. (3) were estimated. C_GPPrate (Eq. (3)) was then calculated using the means.
Reporting summary
Further information on research design is available in the Nature Portfolio Reporting Summary linked to this article.

Responses