Internal volcano-magmatic structure of Öræfajökull volcano, Iceland

Introduction
Dormant and understudied ice-covered stratovolcanoes present one of the greatest threats to the global economy due to their extensive impact when they erupt. Hazards range from pyroclastic density currents1, lahars2, jökulhlaups3,4,5, and ballistic ejecta6 in local proximity, to far reaching gas plumes and ash clouds that can halt air travel and devastate regional agriculture7,8. Global warming has the potential to cause ice-covered volcanoes to become more hazardous by melting summit ice, resulting in decreased surface loading9,10 and by influencing decompression melting in the mantle, which may lead to more frequent and/or larger eruptions11,12, an increase in edifice collapse13, explosivity14, and/or shallow magma storage11,15. With an ever-increasing global economy and air-travel, large ice-covered volcanoes, especially those that are not monitored frequently and/or understudied must be investigated. Öræfajökull, often referred to as an “unknown sleeping giant” stands at 2100 m above sea level (asl) and is one of Iceland’s most dangerous volcanoes (Fig. 1). There has been very little geological or geophysical peer-reviewed published research conducted on Öræfajökull due to its upper half being completely covered in ice where the 3 × 5 km caldera at the summit contains ice up to 550 m thick16. Furthermore, Öræfajökull has only erupted twice (1362, 1727 CE) since the settlement of Iceland (c 871)17 and has been seismically quiet in modern times. This changed in 2017, when a 23 m deep cauldron within the ice-filled summit caldera formed due to an injection of thermal energy from below18 (Fig. S1). Further evidence of an injection of thermal energy was found in the glacier outwash chemistry, which indicated that there was an increase in geothermal activity19. During the 2017–2019 unrest period, 50–60 mm of inflation was measured, and seismicity increased from ~5 earthquakes greater than 1.5 magnitude per year on average to over 4000 per year. This first significant period of unrest in modern times provides the opportunity to better understand the subsurface structure beneath Öræfajökull, and to create a valuable benchmark against which future periods of unrest can be measured. Öræfajökull is one of several central volcanoes that lie in the off-rift (flank) volcanic zones of Iceland, known for their formation of large composite edifices that contain higher proportions of silicic and intermediate volcanic materials compared to the more active basalt-dominated volcanoes in the Icelandic rift zones20. The higher proportions of silicic and intermediate melts often lead to more explosive eruptions and longer quiescence periods14. Despite being mapped at a reconnaissance level21, the geological development of Öræfajökull remains poorly understood due to the lack of research. Nevertheless, a brief outline of the geological evolution of Öræfajökull can be summarized22,23,24,25. Pleistocene deposits comprise of an early sequence of subglacial mafic sheets and minor subaerial lavas resting on a highly eroded basement of subaerial mafic lavas (c. 2 Ma). Overlying this sequence are occasional subaerial rhyolite lavas, which are overlain by intermediate-silicic subglacial lavas (mostly rhyolite) and associated minor pyroclastic deposits. Furthermore, covering the past sequence are subaerial mafic-intermediate lavas, which most likely belong to either the last interglacial or are early Holocene timeframe21,22,25. Volcanic activity from the start of the Holocene up to the settlement of Iceland (c. 871) consists of several mafic-intermediate subaerial lavas, along with several small explosive silicic eruptions22,24. In 1362 CE Öræfajökull produced what is considered to be Iceland’s largest historic silicic eruption. The vent(s) of the eruption are not exposed and are assumed to be within the ice-filled summit caldera. The 1362 CE eruption produced large meltwater floods (jökulhlaups), pyroclastic density currents, and an extensive apron of airfall tephra17,26,27. In 1727 CE, Öræfajökull erupted again, but this time from a radial dyke on the southwest flank24 that fed a linear fissure, which then supplied intermediate magma to erupting scoria cones23. The Pleistocene-Holocene geological record suggests that Öræfajökull’s eruptions vary considerably in both location (e.g. radial fissures, summit caldera) and compositions (e.g. basalt to rhyolite) over short timescales spanning centuries. Given these dynamic geological environments and the looming threat of increased ice melt due to global warming, it is crucial to gather comprehensive data on the interactions between subsurface processes and surface dynamics at Öræfajökull. Such knowledge is essential for evaluating future eruption scenarios and devising effective hazard management protocols, particularly in anticipations of potentially catastrophic events akin to the scales of the 1362 CE eruption. In this study, we employ a multidisciplinary approach using seismic and geodetic datasets collected during the 2017-2019 unrest to unveil new insights into the internal structure of Öræfajökull. By integrating local earthquake tomography (LET) via seismology and geodetic modeling techniques, we construct a conceptual model illustrating how recent unrest may have reshaped Öræfajökull’s subsurface dynamics. These discoveries could play a pivotal role in comprehending and mitigating the potential impacts of future eruptions and associated hazards at Öræfajökull.

Map of Öræfajökull with earthquake locations between 2017 and 2019. Earthquakes shallower than 2 km bsl are shown as red circles; earthquakes between 2 and 6 km bsl are depicted as orange circles, and earthquakes deeper than 6 km bsl are represented with blue circles. Triangles represent locations of the 3-component broadband seismic stations (locations of all seismic stations see Fig. S5). Yellow lines represent the LET cross-section profiles shown in Fig. 2). Inset map shows the location of the study area in Iceland.
Local earthquake tomography
In order to conduct a LET inversion, earthquake source locations must be estimated (Methods). From the earthquake locations, first order details about the internal structure of the volcano may be examined. The distribution of all earthquake sources displays widespread locations and depths between the ice surface down to ~14 km below sea level (bsl). The majority of earthquakes occur beneath and around the central caldera between ~3 and 7 km bsl (Fig. 1). Notably, there are multiple linear features (e.g. Fig. 1, −16.7o), a seismic cluster at depth concentrating on the southeast side of the caldera, and an area of diffuse seismicity between ~1 and 4 km bsl that extends to depth on the west side of the seismic block. The formation of this diffuse zone can be seen more clearly through a time analysis of the earthquake source locations throughout 2018 (Fig. S2). Additionally, in map view there are few earthquake sources in the middle of the caldera compared to the flanks of the volcano.
The LET inversion results using pstomo_eq28 (Methods) are shown in Fig. 2. The velocity structure of Öræfajökull can be perceived as three regions directly below the volcano ( ~10−20 km distance on LET profiles, Fig. 2a−f), where there are contrasting velocities <2 km, 2−6 km, and >6 km bsl. Above 2 km bsl, the P- and S-wave velocities are higher than the starting model with P-wave velocities ranging from ~4.0 to 5.6 km/s and S-wave velocities between ~2.2-2.9 km/s. At these depths, the velocity starts to increase towards the north (Fig. 2d; S3) away from the central caldera. The Vp/Vs ratio <2 km bsl (Fig. 2c, f) is predominantly the same as the starting model (1.78) with some pockets of slightly higher values (~1.79−1.80). The LET velocity structure between 2 and 6 km bsl depicts a low velocity zone (LVZ) with P-wave velocities ~5.0−5.9 km/s (Fig. 2b, e) and S-wave velocity between 2.6 and 3.2 km/s (Fig. 2a, d) below the caldera. On either side of the LVZ, the velocity structure is equal to the starting model, with higher velocities towards the north (Fig. S3d, e). Between 2 and 6 km depth bsl there is a high Vp/Vs zone with ratios between ~1.84 and 1.88 (Fig. 2c, f). This high Vp/Vs region tends to be more stable near the southwest corner of the caldera (Fig. 2f; S3), where there is less seismicity (Fig. 1; S2). Furthermore, there are areas of lower Vp/Vs towards the northeast of the caldera at the same depths as the aforementioned higher velocities between 2 and 6 km depth bsl are located (Fig. 2f, ~20 km). The velocity structure below the LVZ contains velocities which are higher than the starting model. P-wave velocities below 6 km bsl are ~6.0−7.2 km/s (Fig. 2b, e) along with S-wave velocities between 3.4-4.0 km/s (Fig. 2a, d). While the majority of the velocity structure contains velocity values stated above, there are regions below 6 km bsl that have lower velocities. For example, in the southwest corner of Öræfajökull (Fig. 2d, e; S3), where P-wave velocities are ~5.6−5.8 km/s (S-wave, 3.0−3.2 km/s). The Vp/Vs ratios below 6 km depth bsl are mostly low (Fig. 2c, f) with pockets of higher Vp/Vs ratios to the southwest (Fig. 2c, f; S3c, f).
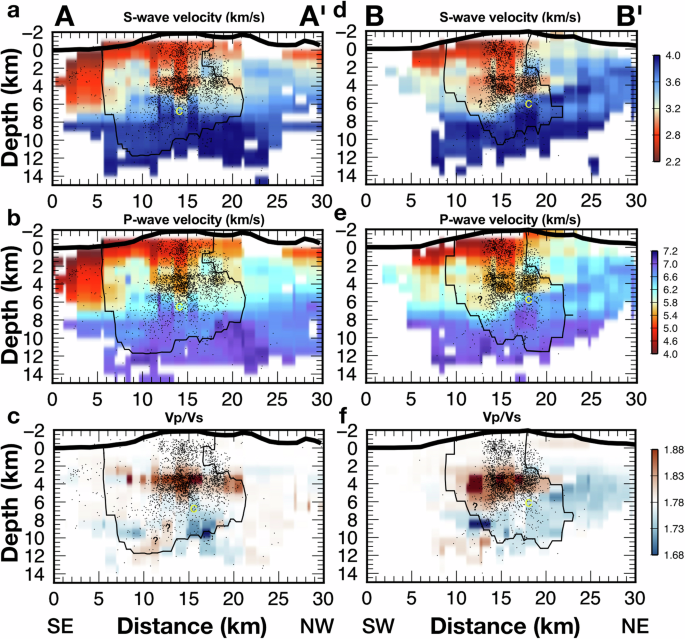
Cross-section LET inversion results for both S-wave (a, b) and P-wave (d, e) velocities, as well as Vp/Vs ratios (c, f). Profiles AA’ (a−c) and BB’ (d−f) can be viewed on Fig. 1. Black dots represent earthquake source locations, yellow “C” represents the area of the theorized chimney/core, and “?” may represent the source of heat influx (see text for more details). Note the zone of lower P- and S- velocities and high Vp/Vs ratios at depth (2−6 km bsl) representing the theorized area of a melt intrusion. Black contour line represents the 0.85 correlation boundary derived from the checkerboard reconstruction test (see Methods, Fig. S9).
Geodetic analysis
Coinciding with the seismic activity, Öræfajökull exhibited evidence of inflation during the height of the unrest period. To complement the LET interpretations, geodetic analysis using a combination of Interferometric Synthetic Aperture Radar (InSAR) analysis and GNSS observations was undertaken (Methods). Decomposition of four Sentinel-1 interferograms (two ascending/descending; Fig. S4) was used in order to create estimates of Near-East and Near-Up displacements (Fig. 3a, b). The geodetic analysis reveals during the time of increased activity, Öræfajökull was undergoing inflation with ~20 mm/yr of vertical displacement, which resulted in a total of ~50 mm of uplift during the entire unrest period. Geodetic inversions utilizing both InSAR and GNSS observations were conducted in order to estimate the size and location of a potential magmatic intrusion (Fig. 3c). Multiple source geometrics were tested (e.g. Mogi, McTigue, Okada), with the Mogi point source providing the best fit to the data. The resulting optimal model placed a potential magma body at ~3.7 km depth bsl (Fig. 3d), with a volume change of 8.1 x 10⁶ m3, which is comparable to intrusive volumes estimated beneath Eyjafjallajökull, Iceland in 1994 and between December 2009 and Febuary 201014. In order to obtain an estimate of the dimensions of the source, a McTigue model (spherical source29) was used to infer the radius of the potential intrusion. The McTigue model was chosen because the inversion produced a similarly good fit to the data compared to that of the Mogi result (Methods). The best-fit McTigue model produced a source with a radius of ~650 m (Fig. 4).
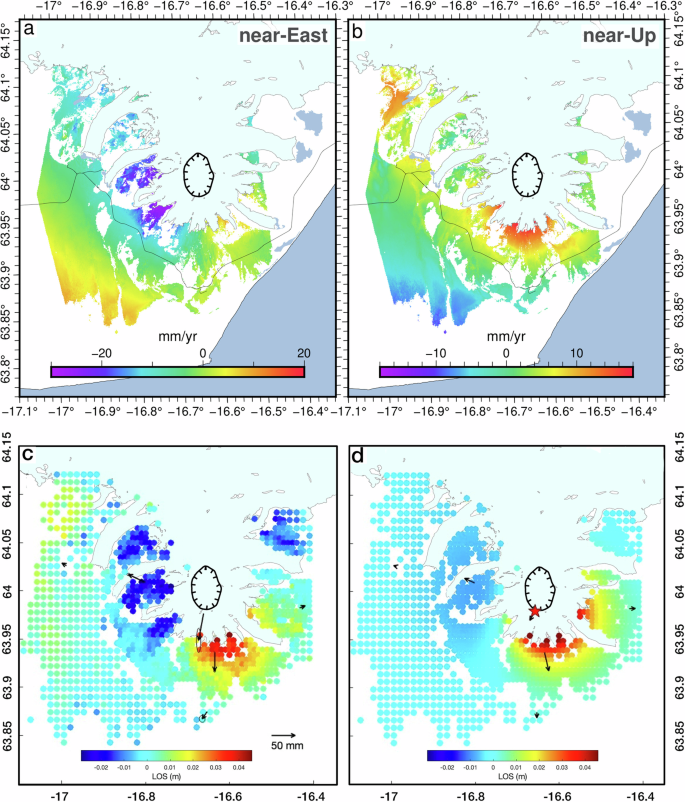
Decomposition result, using four Sentinel-1 interferograms as the input (2 ascending and 2 descending) providing Near-East (a) and Near-Up estimates (b). Line-of-sight (LOS) displacements derived from Sentinel-1 track 111 and GNSS displacements covering the periods of unrest at Öræfajökull (c), and the best-fit Mogi model results (d). Red star represents the estimated location of the optimal Mogi model source at approximately 3.7 km depth bsl.
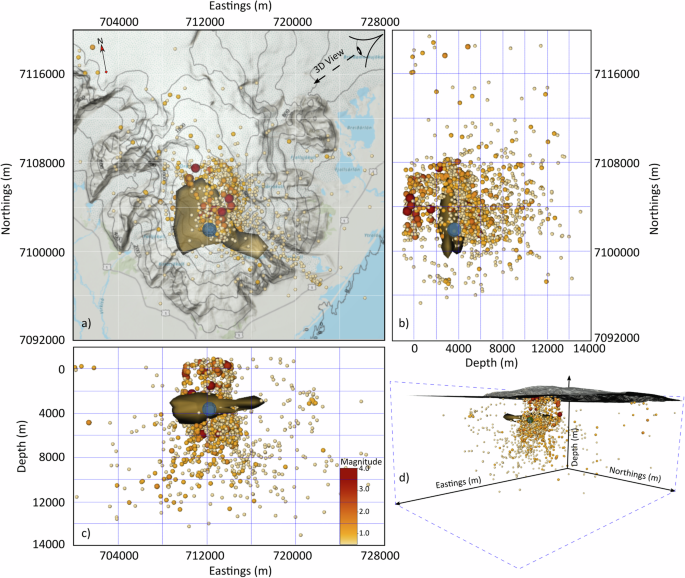
a Overhead view of the final earthquake locations during the 2017−2019 unrest at Öræfajökull along with the seismic (tan) and geodetic (InSAR and GNSS; blue) inversion sources. (b, c) are north-south and east-west representations of the modeled sources along with the earthquake location. d 3-dimentional rendering of the earthquake and modeled sources beneath Öræfajökull. The LET source is formed from the inversion area where Vp/Vs ratios are greater than 1.84. Earthquake source color and size are controlled by the magnitude of the earthquake. Note, earthquake locations that appear to be inside or covering the inversion source/high Vp/Vs locations occurred before and/or after the full injection of melt (Fig. S2).
Interpretations
The combined geodetic and seismic datasets for Öræfajökull can be used to interpret the structure beneath the volcano during the period of unrest (Fig. 4). Above 2 km bsl, the velocity profile depicts an area that could be a geothermally reactivated ring fault system, where heat from depth has propagated up creating radial fractures and an ice caldron on the glacial surface (Fig. S1). This can be seen through the concentration of seismic sources surrounding the caldera at shallow depths between −1 and 1 km bsl (Fig. 1; 4, overhead view). P-wave velocities ~4.0−5.6 km/s with ~1.78 Vp/Vs (Fig. 2) could indicate a region of more felsic material due to the fact that Öræfajökull is known to have silicic eruptions26 (e.g., 1362 CE). These velocity values may also represent a region of fractured and/or hydrothermally altered rocks30. At similar depths beneath Long Valley Caldera, California, P-wave velocities between 4−5 km/s31 along with Vp/Vs ratios of 1.7−1.8 are considered to be caused by pore fluid and fractures32,33. Likewise, at Krafla, Iceland in the top 2 km P-wave velocities of 4.82 km/s and Vp/Vs ratios averaging 1.72 are described as an area of hydrothermal alteration34. At Öræfajökull the Vp/Vs ratio at these depths is slightly increased from Krafla, which could be due to the amount of saturation35, since the values obtained at Krafla were from a borehole, in which no major fluid zones were drilled through34. The hydrothermal scenario is also supported by a recent Transient Electromagnetic (TEM) study conducted above the caldera at Öræfajökull, revealing a structure where a high-temperature alteration layer overlays a geothermally active zone beneath the ice cap36. Additionally, the outwash water chemistry from the glacier during the time of unrest was tested and showed that the outflow was of geothermal origin19.
Between ~2 and 6 km bsl the LET results depict a LVZ with a high Vp/Vs ratio ( ~ 1.84−1.88), which could indicate many different structures (Figs. 2, 4). High Vp/Vs ratios and lower velocities in the past have been attributed to an increase in temperature, a magmatic intrusion, or partial melt in volcanic settings37,38. At Öræfajökull, this could also be the case due to the fact that the S-wave velocities decreased more than the P-wave velocities (Fig. 2), which would indicate less solid rock. This same feature has been seen at other volcanoes throughout Iceland as well. For instance, at Krafla, a magma reservoir with low seismic velocity was hypothesized at ~3 km depth39. Moreover, at Askja, a high Vp/Vs zone at ~5 km depth was described as a magma storage region40,41. Likewise, a seismically active low velocity zone was thought to be the location of a magma body at Eyjafjallajökull42. Similarly in Alaska, a low P- and S-wave velocity area between 2 and 7 km underneath Redoubt was describe as a magma zone43, and an elevated Vp/Vs area beneath Akutan was hypothesized to be caused by partial melt44. This region beneath Öræfajökull corresponds with diffuse seismicity (Fig. 1, S2), especially on the southwestern side of the caldera. The lower amount of earthquake sources is presumably due to a decrease in brittle rock in this area from the introduction of hotter material inferred by the LVZ and high Vp/Vs ratios (Fig. 2; S3). Additionally, the geodetic data yields even more credence to the theory of an intrusive body or partial melt at this depth (Fig. 4). The modelled source depth of 3.7 km bsl for the optimal Mogi model (Fig. 3) fits well with the seismic results (Fig. 4). The southwestern location of the Mogi result combined with the McTigue model places the source of inflation within the diffuse seismic region that coincides with the LVZ and highest Vp/Vs ratios from the LET (Fig.4, S2b).
Outside and below the LVZ, there is an observed increase in seismic velocity (Fig. 2; S3) accompanied by a decrease in the Vp/Vs ratio. The higher velocities and low Vp/Vs ratio combined with the location and depth may indicate that these features could be locations of multiple cores/cumulates (areas of high velocity assumed to be fossil or solidified melt)45,46,47 or a chimney (broad high velocity structures that rise from lower depths toward an active melt zone)39,45,48 which have been observed before at Grensdalur45, Krafla39, Husmuli45, Askja41, and Katla49 in Iceland. Elsewhere, similar high velocity structures at depth beneath Etna, Italy have been described as high-strength magmatic rocks46,50. The higher velocity structures beneath the LVZ at Öræfajökull are thought to be from cumulates, intrusive crystalline rocks, or other melt zones that are not currently activated (Fig. 2; S3, yellow C). At Öræfajökull, outside of the caldera bounds, the higher velocities become shallower, reaching to ~2 km bsl (Fig. 2, BB’, starting at ~22 km distance), which could indicate the presence of old crystalline rock with little to no influence from melt. Additionally, lower seismic velocities extend into this depth region on the south side of the caldera (Fig. 2; S3, black ?), which could be evidence of where the heat from depth is originating. A radial dyke at this location is believed to have triggered the 1727 eruption23, and remnants of scoria cones on the southwest flank of Öræfajökull mark the site of the past eruptive activity25.
One of the prevailing issues with Öræfajökull is the fact that the volcano suffers from a significant lack of current or historical geological or geophysical data regarding the internal structure. Moreover, as a flank zone volcano, Öræfajökull is thought to experience heat input primarily from a plume source rather than from the spreading center typical of most active Icelandic volcanoes20 (e.g., Hekla). This unique heat source dynamic may contribute to Öræfajökull’s irregular activity history. Variations in plume activity could lead to episodic pulses of magma supply beneath the volcano. These longer quiescence periods may also be responsible for the abundance of older more brittle rock within Öræfajökull, where intermittent plume-driven heat rises to shallower depths, potentially triggering reactivation throughout the volcanic system, causing the diversity in earthquake locations (Fig. 1).
Although many past geophysical studies in Iceland have yielded similar structures to the data presented here14,39,49, we can only speculate on the actual composition of Öræfajökull (Fig. 4) due to the absence of recent eruptions, limited large geophysical studies, and challenges in data collection due to ice cover. During the 2017−2019 unrest, a pulse of new melt most likely propagated to and reactivated a pre-existing magma domain between ~2 and 6 km bsl. This intruding magma altered the overlying rocks, triggering geothermal activity that melted the icecap, which in turn created the radial fractures and cauldron on the ice surface (Fig. S1). Beneath the intrusion zone on the northeast side of the caldera, a high velocity zone at shallower depths indicates the location of an old or non-activated melt zone commonly referred to as a core or chimney. These interpretations and discoveries represent a critical initial step toward gathering essential information about the internal magmatic pluming system of Öræfajökull. This knowledge will enhance our ability to assess likely eruption scenarios and associated risk accurately, thereby facilitating informed hazard response plans. For instance, the impactful 2010 eruption at Eyjafjallajökull followed 18 years of intermittent volcanic unrest, during which data allowed for clear risk management and hazard assessments to be defined14.
Methods
Local earthquake tomography
Seismic data
The seismic data for this study was collected over a three-year span during the peak activity at Öræfajökull from 2016 through 2018 (Fig. 1). Increased earthquake activity started in September 2016 and within a few months decreased back to pre-unrest occurrences. In early 2017 seismic activity increased slightly again, but it was not until late November 2017 that the earthquake activity reached a significant level. From the beginning of 2018 there were several earthquake events per day, suggesting that the volcano was starting to enter a period of unrest. In a joint effort with the Icelandic Meteorological Office (IMO), four seismic stations from Uppsala University were installed around Öræfajökull in January 2018 to help capture the increased seismic activity (Fig. S5, magenta triangles). The data used in this study encapsulates the combination of the four Uppsala sensors with the 12 IMO stations (Fig. S5, green triangles) installed on Öræfajökull during the increased unrest. All the data used were from 3-component broadband stations, GPS timestamped and recorded at 100 samples per second. Data collected from 2018 were used in the LET portion of this study. Earthquake occurrences were identified by a seismic event detection algorithm51, where migration and stacking of seismic traces are used to determine earthquake occurrences. The reason this event detection method was used is due to the fact it can detect additional events and contain less false detections than the SIL automated system51. These factors are particularly useful for Öræfajökull, which does not produce abundant earthquakes. To obtain the most reliable earthquake phase arrival times for the LET, we used the iterative cross-correlation sorting algorithm52. This cross-correlation algorithm was used because it can use the SIL catalog as its base/comparison, and can improve upon hypocenter and phase arrival time estimations52. As a result, the events are categorized in four different categories based on the number of readings with high correlation coefficients ( > 0.8) with the existing events52. Keeping only the highest quality events (stack energy ≥ 4), this resulted in additional events being added to the IMO catalogue. Furthermore, after the process is complete, the new events and phase arrivals are manually inspected for maximum quality control measures52. In total, about 29,000 P- and S-wave traveltimes from 2310 local events were selected for the LET.
Inversion procedure
In order to complete the LET, the use of the LET algorithm pstomo_eq28, which is based on fdtomo_eq43 was used. Pstomo_eq conducts a simultaneous inversion of the P- and S-wave velocities along with the hypocentral parameters in three dimensions (3D) through the use of the P- and S-wave arrival times. The joint hypocenter and velocity problem is decoupled according to Pavlis and Booker53, in which traveltimes are computed on a cubic mesh using the time3d-algorith54,55. Rays are then computed in the resulting traveltime field by backpropagation perpendicular to the isochrons. Moreover, inversion cells are constructed from an integer number of forward modelling cubes in each direction and ray lengths are computed in each inversion cell, as well as, the take-off angles which were then used for the relocation of the earthquakes. After comprehensively testing for inversion parameters, such as inversion cell size, regularization and starting velocity models, both the real data and the synthetic data for a checkerboard reconstruction test is inverted using identical parameter settings. The 3D models are discretized in 1 km cubes, and forward traveltimes are computed on 0.25 km cubes to maintain sufficient travel time accuracy. In order to limit erratic velocity variations, model regularization is applied in the form of smoothness damping by gently forcing the Laplacian of the velocity fields towards zero. Moreover, consistency between the P- and S-wave models were obtained by requiring that the cross-gradients function of the two models equals zero everywhere56. A cross-gradients function of zero implies that the models are structurally similar (i.e. that changes in the P- and S-wave velocity models occur along the same model boundaries). This assumption is reasonable as, for example, the lithological boundaries are identical in the P- and S-wave models. Similarly, medium parameters such as pressure and temperature do not change between the models or only occur in one of the models. Note, that in this approach we are not placing any constraints on the Vp/Vs ratios, as the changes in the P- and S-wave velocity models may be in opposite directions57. Furthermore, the conjugate gradients solver LSQR58 is used to solve for the P- and S-wave velocity in each cell. For the LET, a starting one-dimensional (1D) P-wave velocity model is required. Here, we use a starting model similar to past LET studies in Iceland28,59, including one based on the Hengill region37, which is also used by the Icelandic Met Office in their routine earthquake location algorithm. The selected starting model shows a rapid velocity increase (P-wave velocity ~6.0 km/s at 3 km bsl) in the top 3 km of the crust (Fig. S6a). The S-wave model was obtained by dividing the P-wave velocity with a constant Vp/Vs ratio of 1.78 in accordance with a Wadati plot of all the traveltimes (Fig. S6b).
Smoothing constraints
The tomographic inversion was performed in a series of iterations (14) in order to account for the non-linearity of the problem, gradually relaxing the smoothing allowing smaller and sharper anomalies into the models as the raypaths and earthquake locations are stabilizing. To establish the “optimal” final weight of the Laplacian (k in equation 5)28, a series of tests were performed. Fig. S7 shows the mean squared residual as a function of the squared model length. The red star in Fig. S7 represents the preferred result (a final weight of the smoother of 3.9), yielding the simplest model explaining the data. Higher weights result in a larger data misfit, and a lower weight results in increased model length without significantly improving the data fit.
Hypocentral Parameter uncertainties
In order to understand the effects of earthquake source location on the results, standard errors for the hypocentral parameters are computed (Fig, S8). After 14 iterations, the RMS travel time misfit was reduced from 0.26 s to 0.11 s for the P-wave data and from 0.35 s to 0.12 s for the S-wave data, respectively. The standard errors (linear estimates ignoring the trade off with the seismic velocity model) show that the uncertainty in location is largest for the depth parameter, which is expected as there are no seismic stations directly above the events (due to logistics/terrain, Fig. 1; S5). 68.2% of the events had errors smaller than 0.4 km in the east-west direction, 0.4 km in the north-south direction and 1.1 km vertically. Furthermore, the origin time uncertainty was ~0.09 s.
Checkerboard reconstruction
The checkerboard reconstruction test was performed applying a pattern of checkers 5 km in size with velocity variations of ± 10%, to the starting models (Fig. S9). To test the geometry for Vp/Vs ratio variations, the P- and S-wave checkers were set opposite to each other. Synthetic travel times were computed from the sources to the receivers in the same combinations as for the real data, and the final earthquake locations after relocation in the final 3D seismic velocity models were used. Furthermore, “noise” was also added to the computed traveltimes commensurate with the estimated picking accuracy of 50 ms and 80 ms for the P- and S-wave travel times respectively. Additionally, the starting models used for the checkerboard reconstruction were the same as for the natural data. Similar to the inversion of the real data, the hypocentral parameters were also inverted in the checkerboard reconstructions, where the starting locations of the earthquakes were distinctive to the “true” final locations. As shown in Fig. S5, the possibilities to install seismometers at various offsets from the volcano is limited in the north by the Vatnajökull icecap, and in the south by the sea. In the checkerboard reconstruction the true event locations were also inverted in order to determine location error (Fig. S10). By inverting the true event location, the events were able to locate back to the “true” location, positioned within the estimated hypocentral parameter errors, where the seismicity is mostly confined to within the volcanic system (Fig. 1). Fortunately, although diffuse, some of the seismicity is distributed outside the main earthquake clusters and reaches depths of 14 km bsl or more. Due to these limitations, correlations between the true model and the reconstructions were estimated by creating 7 km3 cells in order to understand where the LET inversion can be constrained. Using a 0.85 correlation, the inversion resolves the area directly beneath the volcano (Fig. S9, black contour lines), with slight variations from side to side. The checkerboard reconstruction test demonstrates that the results and interpretations of the LET inversion can be trusted 5−10 km on each side of the summit caldera and to depths of ~12 km at Öræfajökull (Fig. S9).
Geodetic analysis
InSAR data
Interferograms were processed using SAR data from four Sentinel-1 tracks (T111, T118, T147, T9) using the InSAR radar Scientific Computing Environment (ISCE2) software60. These were multilooked by 6 in range and 2 in azimuth to improve the signal to noise ratio. Input SAR images only acquired during the summer months, between September 2016 to September 2018, were utilized in the processing due to snow cover resulting in incoherence outside this period. The IslandsDEMv110 m DEM from Landmælingar Islands (the National Land Survey of Iceland)61 was used to remove topographic fringes. Average velocity maps were formed using in-house small baseline subset (SBAS)62 software at the Icelandic Meteorological Office.
GNSS data
The Öræfajökull GNSS data were analyzed using GAMIT/GLOBK software, version 10.763 combined with data from over 100 IGS (International GNSS Service, https://igs.org/) reference stations and IGS satellite orbit information to constrain daily site positions in the ITRF2008/IGB0864 reference frame. Satellite orbits and earth rotation parameters were also solved for by estimating atmospheric zenith delay. Ocean loading was corrected by using the FES2004 model65, and the IGS08 azimuth and elevation dependent phase center variation model was applied to all antennas66,67,68. Linear, annual and semi-annual trends were estimated and removed for each GNSS station with sufficient length based on data collected prior to the beginning of the unrest period.
Modelling
Geodetic modelling was conducted by using geodetic Bayesian inversion software (GBIS)69, where the input data for the inversions included both InSAR average velocity maps (from four Sentinel-1 tracks) and data from 7 continuous GNSS stations. A series of simple source geometries were tested (including a point source70, spherical source29, cigar-shaped source71, and rectangular dislocation72). One million iterations were run to produce the joint probability density function for the combined source parameters and ensure they had full converge. Although the Mogi source provided the best-fit to the data (lowest weighted residual sum of squares (WRSS)73), the McTigue model was also used to infer the radius of the source, as the inversion result produced a similarly good fit to the data. The WRSS results for each model was 0.526, 0.526, and 1.061 for the Mogi, McTigue, and Okada respectively.


Responses