Context-dependent effects of grassland degradation on soil nitrogen cycling processes

Introduction
Grasslands are among the most widespread ecosystems on Earth’s land surface and support a variety of ecosystem functions and services1,2. During the last few decades, global environmental changes have rendered grasslands vulnerable to degradation and ~50% of the world’s grasslands are considered to be degraded3. Grassland deterioration largely alters the biogeochemical processes in the soils, particularly for the nitrogen (N) cycling processes, which impair the bioavailable N supply for key components of grassland functions (e.g., pasture production, biodiversity conservation, carbon sequestration, etc.) and enhance the emissions of nitrogenous gases (e.g., nitrous oxide)4,5. In its essence, the reactive N forms (e.g., ammonium and nitrate) for organism growth are governed by the microbial-mediated N transformation processes6,7. For example, the organic N degradation through mineralization process releases ammonium, which is subsequently oxidized to nitrate via nitrification process. In addition, the loss of nitrogenous gases through denitrification and other actions maintains the dynamic balance of N, which is essential for improving soil N availability, maintaining soil fertility and promoting plant growth8. Therefore, a systematic understanding of how grassland degradation influences soil N availability and the related N transformation processes is critical for development of effective strategies for grassland restoration.
The influences of grassland degradation on total soil N have been widely investigated, and degraded grasslands are reported to have a lower total N storage9,10,11. Nevertheless, changes in total N may not well represent soil N availability. How grassland degradation affects soil available N contents and related microbial-mediated N transformation processes remains limited. Recently a handful single-site studies have examined changes in soil inorganic N content and net N mineralization rate upon grassland deterioration, and their results revealed that these N-cycling parameters generally declined as grassland degradation intensifies5,12. To date, however, we still know little about the spatial heterogeneity of degradation effects on soil N cycling processes. Grassland degradation is reported to abruptly alter soil environments, substrates and microbial properties of N cycling5,11, which would influence the rate of N transformation processes and thus soil N availability for plant growth. For example, soils in degraded grasslands have higher pH and bulk density but lower moisture content13. Meanwhile, the available substrates, such as dissolved organic N for mineralization and ammonium for nitrification, also declined upon degradation5. In addition, the N-transforming microorganisms have been found to diversely respond to grassland degradation11,14,15. Considering that the sign and magnitude of degradation-induced changes in above factors vary substantially among sites, it remains poorly understood how changes in soil environments, substrates and microbial attributes shape the large-scale patterns of the degradation effects on soil N cycling processes.
The Tibetan Plateau is the largest alpine pastoral ecosystem worldwide, but suffered from serious degradation during past decades11,16. A recent work summarized published data and reported that 21–40% of the grasslands are facing degradation, and more degradation is predicted in the future as the stock rates in ~55% areas of the Tibetan alpine grasslands have exceeded half of the thresholds17. Application N fertilizer is an effective strategy for restoring degraded grasslands on the Plateau18; thus, a comprehensive assessment of soil N cycling processes would thus lay a theoretical base for improving fertilization management of the degraded grasslands. To this end, we performed a large-scale comparative study of soil N cycling parameters, including soil ammonium-N (NH4+-N), nitrate-N (NO3–-N), dissolved inorganic N (DIN; sum of NH4+-N and NO3–-N) and related microbial N transformation rates (including gross N mineralization, GNM; microbial immobilization, MIM; gross nitrification, GN), among non-degradation and three degradation levels (slight, moderate and heavy degradations) across the Tibetan alpine grasslands. Our objective is to address the following questions: first, how does grassland degradation influence soil N cycling parameters? Second, how do the degradation effects vary with climate, vegetation and soil environment gradients? Third, what are the main drivers of spatial variations in the degradation effects? We found that, although grassland degradation tended to decrease soil N cycling parameters across all sampling sites in most cases, the degradation effect shifted from positive to negative as the background N-cycling parameters increase. This context-dependent degradation effect was largely driven by changes in soil microbial attributes.
Results
Changes in soil N cycling parameters along the degradation sequence
Our field survey included 45 grassland degradation sequences across 15 study sites (see Fig. 1 for site location and reprehensive landscapes of different degradation stages). Among different sites, the soil N cycling parameters, including NH4+-N, NO3–-N, DIN, GNM, MIM and GN rates, exhibited divergent changes upon grassland degradation. Considering that the interactive effects of grassland type and degradation level on soil N cycling variables were significant for most cases (Supplementary Table 1), we explored the degradation effects for different grassland types. In alpine steppe, soil NH4+-N, DIN, GNM and MIM rates showed a decreasing trend despite not statistically significant (Fig. 2a–e), while GN significantly dropped down from non-degraded to heavily degraded stages (Fig. 2f). In alpine meadow, soil NH4+-N, DIN, GNM and MIM rates significantly declined (Fig. 2a, c–e), while NO3–-N content significantly increased (Fig. 2b) but GN remained unchanged along the degradation gradient (Fig. 2f). The N cycling variables exhibited similar trends as the degradation aggravates in alpine swamp meadow as those in alpine meadow, but the changes were not statistically significant in some cases likely owing to the limited data points (Fig. 2).

a Map of the sampling sites; (b) photos showing typical status of different degradation levels in alpine meadow. ND non-degradation, SD slight degradation, MD moderate degradation, HD heavy degradation. Photos were taken by Xiaoxia Gao. The map images was created in ArcGIS Desktop 10.8 (ESRI, 34 Redlands, CA, USA). https://www.geodoi.ac.cn/doi.aspx?doi=10.3974/geodb.2014.01.12.v1.
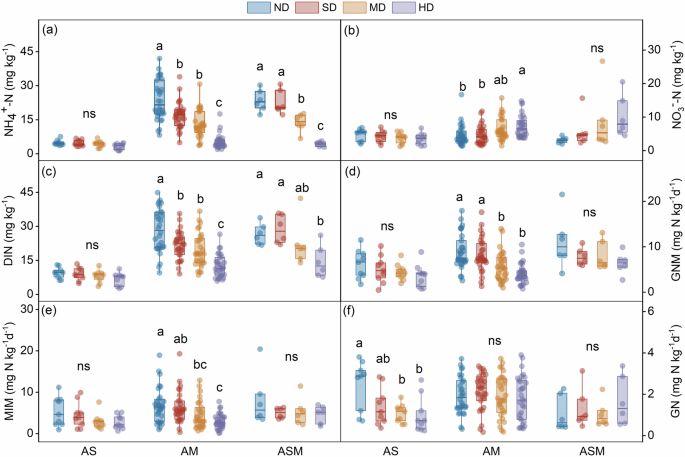
a Ammonium nitrogen (NH4+-N); (b) nitrate nitrogen (NO3–-N); (c) dissolved inorganic nitrogen (DIN); (d) gross nitrogen mineralization (GNM); (e) microbial immobilization (MIM); (f) gross nitrification (GN). Box shows the interquartile range and whiskers show the data range. The horizontal line in each box indicates the median. The sample sizes in each degradation level for alpine steppe, alpine meadow and alpine swamp meadow are 9, 30 and 6, respectively. Significant difference is shown by different letters (P < 0.05) while ns signifies non-significance (P > 0.05). ND non-degradation, SD slight degradation, MD moderate degradation, HD heavy degradation, AS in alpine steppe, AM alpine meadow, ASM alpine swamp meadow.
Dependency of degradation-induced changes in soil N cycling parameters on biotic and abiotic factors
To assess the degradation effects on soil N cycling parameters, the response ratio (RR) was calculated. Here, the RR was defined as the natural log-transformed ratio between degraded plots and non-degraded plots in the same degradation sequences for each site. We found that across various sampling sequences, there was a high spatial heterogeneity of the degradation effects on soil N cycling parameters. We then explored the RRs of these parameters with various climate, vegetation and edaphic factors that potentially drive the variations. Results showed that the RRs of soil N cycling parameters remained stable along most of the examined factors but nearly all declined with increasing their respective background N status (i.e., the N cycling parameters in non-degraded plots) (Supplementary Fig. 1). In most cases, the degradation effects shifted from positive to negative as the corresponding background N cycling parameters increase, regardless of degradation levels (Fig. 3).
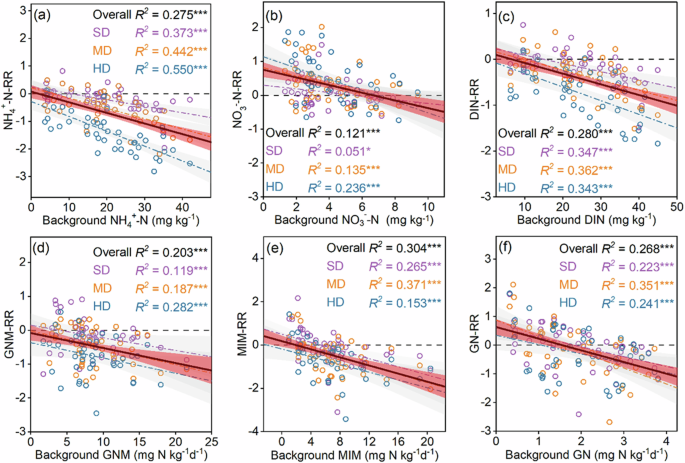
a Ammonium nitrogen (NH4+-N); (b) nitrate nitrogen (NO3–-N); (c) dissolved inorganic nitrogen (DIN); (d) gross nitrogen mineralization (GNM); (e) microbial immobilization (MIM); (f) gross nitrification (GN). The degradation effect was quantified by the response ratio (RR), which was computed as the natural logarithm of the ratio of degradation plots to non-degradation plots. Background values denote the nitrogen cycling parameters in non-degraded plots. Solid lines and dashed lines indicate trend lines across all and each degradation levels, respectively. ND non-degradation, SD slight degradation, MD moderate degradation, HD heavy degradation.
Drivers of the context-dependent degradation effect on soil N cycling parameters
Considering that soil available N contents are essentially determined by the N transformation processes, thereafter we focused on the factors associated with soil N transformation rates. To identify the main drivers of the context-dependent effects of grassland degradation on N transformation rates, we explored the relationships between the RRs of N transformation rates and RRs of a couple of potential drivers. We found that the degradation-induced changes in microbial attributes were the main drivers of GNM and GN rates in moderate and heavy degradation stages, while the two processes were correlated with none of the explanatory variables for slight degradation level. The MIM-RR was significantly associated with GNM-RR for all degradation levels (Fig. 4). Besides above, the MIM-RR was related to Sand-RR and DIN-RR in moderate degradation stage, and GN-RR was correlated with Sand-RR in moderate heavy stage (Fig. 4). Nevertheless, further analysis showed that only RRs of GNM and microbial attributes declined with the background N transformation rates for different N degradation levels (Supplementary Fig. 2).
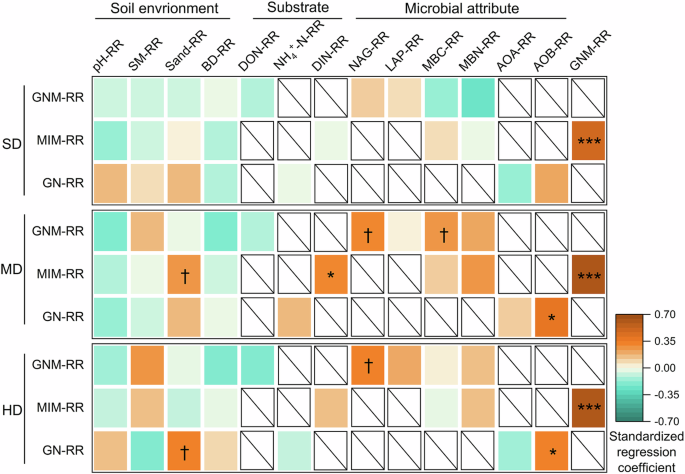
The degradation effect was quantified by the response ratio (RR), which was computed as the natural logarithm of the ratio of degradation plots to non-degradation plots. n = 45. †, P < 0.1; *, P < 0.05. **, P < 0.01. The blank box with a diagonal line indicates that the response variable has not direct correlation with the explanatory variable based on ecological principles. GNM gross nitrogen mineralization, MIM microbial immobilization, GN gross nitrification, SM soil moisture, BD bulk density, DON dissolved organic nitrogen, DIN dissolved inorganic nitrogen, NAG β−1,4-N-acetyl-glucosaminidase, LAP leucine aminopeptidase, MBC microbial biomass carbon, MBN microbial biomass nitrogen, AOA ammonia-oxidizing archaea, AOB ammonia-oxidizing bacteria, SD slight degradation, MD moderate degradation, HD heavy degradation.
Discussion
Using a standardized survey from 45 degradation sequences among 15 sites, we present large-scale measurements of a number of soil cycling parameters (i.e., soil available N contents and related microbial N transformation rates) across a broad range of the degraded grasslands on the Tibetan Plateau. In alpine meadow and swamp meadow, soil NH4+-N content declined progressively as grassland degradation aggravates, while in alpine steppe, a declining but not significant trend was observed (Fig. 2a). The changes in soil NH4+-N content are largely determined by N mineralization process19. The degradation-induced reduction of GNM rate was mainly associated with changes in soil properties and extracellular enzyme activity. To be specific, there were significantly positive correlations of GNM-RR with RRs of soil moisture, microbial biomass carbon (MBC), β-1,4-N-acetylglucosaminidase (NAG) and leucine aminopeptidase (LAP) activities, but negative correlations with pH and bulk density (Supplementary Fig. 3a). As grassland degradation intensified, soils become more alkaline (as indicated by increasing pH; Supplementary Fig. 3b), drier (as indicated by decreasing soil moisture; Supplementary Fig. 3c) and less anaerobic (as indicated by rising bulk density; Supplementary Fig. 3d) in alpine meadow and swamp meadow. All above changes demonstrate that soil environment becomes more adverse to microbial growth and their activities (as revealed by reducing microbial attributes; Supplementary Fig. 3e–h) which directly link to soil organic N mineralization process20,21, thus leading to a declining trend of GNM rate from non-degradation to heavy degraded stages.
Along the degradation gradient, soil NO3–-N content increased but the related GN rate remained unchanged in alpine meadow and swamp meadow (Fig. 2b, f). In such a context, we may speculate that the increase in NO3–-N were attributed to the inhibited denitrification process upon grassland degradation, which would repress the conversion of nitrate into N2O or N2 gases, ultimately leading to an accumulation of NO3–-N in the soils7. Denitrification rate is largely determined by soil hydrological conditions, with a decreasing denitrification rate as soils become more aerobic22. The decreased soil moisture with intensified degradation demonstrated the more aerobic soils (Supplementary Fig. 3c), thus leading to a reduced denitrification rate in our study sites. The non-significant changes in GN rate upon degradation may be explained by the counterbalance between declined substrate (i.e., NH4+-N) and increased nitrifying microorganisms (i.e., AOA and AOB). There was a decreasing trend of soil NH4+-N content (Fig. 2a) but an up-regulation of ammonia-oxidizing archaea (AOA) and ammonia-oxidizing bacteria (AOB) genes (Supplementary Fig. 3i, j) along the degradation gradient. The opposite directions between the two drivers would cancel each other out and then resulted in a neutral response of the GN rate to grassland degradation. Nonetheless, the GN rate declined whereas soil NO3–-N content remained stable in alpine steppe. Since we did not observe significant changes in the measured drivers (Supplementary Fig. 3), some unconsidered factors may explain the reduction of GN rate, such as the role of fungi.
Among the study sites, there was a large spatial variation in the degradation effects, which mainly relied on soil background N status (i.e., the N cycling parameters in non-degraded plots). When background N status was low, grassland degradation generally elevated soil inorganic N contents and N transformation rates; however, the degradation effect shifted from positive to negative as the background N-cycling parameters increase. Although changes in soil environments, substrates and microbial properties could potentially drive this context-dependent degradation effect, our study showed that soil microbial properties exert the most important role in the degraded alpine grasslands. This is particularly obvious in moderate and heavy degradation levels. An interesting question is why soil microbes exhibited a context-dependent response to grassland degradation? We speculate that such a phenomenon is likely associated with the extent of microbial N limitation upon grassland degradation. Under low background N status, soil microbes suffer stronger N limitation and thus degradation would accelerate soil N cycling23, leading a positive degradation effect, and vice versa for the high N background N status. In support of our speculation, we found that the carbon-nitrogen imbalance between microorganisms and resources (RDOC:TDN/BC:N), an indicator of soil microbial N limitation24, declined with increasing background GNM (Supplementary Fig. 4). Since a higher RDOC:TDN/BC:N reflects a greater microbial N limitation, our finding demonstrates a stronger N limitation of soil microbes at the sites where background GNM was low, thus leading to a positive degradation effect on soil N cycling.
Although our study provides insights for evaluating soil N dynamics under the ongoing grassland degradation, there are still limitations of our results. First, there are many microbial groups that could mediate soil N transformation processes, but our study only related GNM to NAG and LAP considering that the two enzymes are regulating chitin and peptidoglycan degradation and proteolysis, respectively23. Similarly, we associated GN with AOA and AOB, because the two microbial groups are deemed to mediate the first and rate-limiting step of nitrification25. The N-acquisition enzymes (NAG and LAP) and nitrifying communities have been widely used to explain organic N mineralization (AOA and AOB) and nitrification, respectively12,26,27; however, additional microbial functional groups, such as fungal communities and other N-cycling functional gene abundance and extracellular enzymes, were not considered. These ignored microbial properties may potentially interpret in the context-dependent degradation effect on GNM and GN, particularly for the slight degradation level. Second, there are numerous key processes in soil N cycle6,7, while our study only measured GNM, MIM and GN processes that are important for soil available N balance8. However, other microbial N-cycling processes (e.g., biological N fixation, denitrification and dissimilatory nitrate reduction to ammonium, etc.) which are also of importance for bioavailable N production and consumption, were unfortunately not investigated. Overall, more N cycling processes and the related microbial properties need to be considered for the future research, in order to deepen our understanding of the key processes in N cycling under anthropogenic disturbance.
In conclusion, this study investigated how grassland degradation influences multiple soil N cycling processes based on a network of standardized survey from 45 degradation sequences in the Tibetan alpine grasslands, which would enhance the process-level understanding of soil N dynamics under frequent anthropogenic disturbance. Although grassland degradation is previously considered to reduce soil N availability and related N transformation rates, we showed that its effects exhibited spatial variations: grassland degradation decreased soil N cycling variables when their corresponding background status was high but increased them when the respective background status was low. This context-dependent degradation effect was mainly mediated by changes in soil microbial properties (Fig. 5). Our findings suggest that application of nutrient-based restoration needs to consider soil background N status. That is to say, addition of N fertilizers may promote grassland restoration in those regions where their soil background status was high, owing to the degradation-induced reduction of N availability; however, in the areas with low soil N status, since degradation has minimal effect or even elevates soil N-cycling processes, other restoration strategies e.g., plant- and microbial-based restoration measures18 are suggested to be considered in priority.
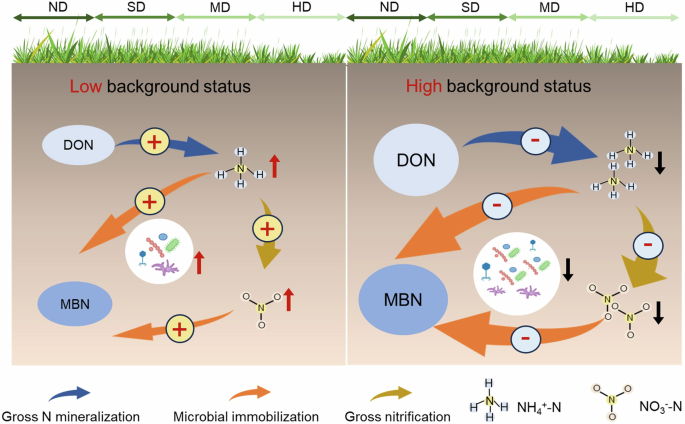
Background nitrogen status denote the nitrogen cycling parameters in non-degraded plots. Under low background nitrogen status, soil microbes suffer stronger nitrogen limitation and thus degradation would accelerate soil nitrogen cycling, leading a positive degradation effect; however, the degradation effects shifted from positive to negative as the background nitrogen cycling parameters increase. DON dissolved organic nitrogen, MBN microbial biomass nitrogen, NH4+-N ammonium nitrogen, NO3–-N nitrate nitrogen, ND non-degradation, SD slight degradation, MD moderate degradation, HD heavy degradation.
Materials and methods
Site description and field survey
We performed a comprehensive field survey in the “Three-River Source” region, a representative region that has been impacted by widespread grassland degradation9,28,29. The sampling sites span a wide environmental gradient, with longitude of 94.99°E to 101.52°E and latitude of 32.91°N to 35.70°N. The average altitude of the study area exceeds 4000 m a.s.l. The mean annual temperature (MAT) varies from –3.66 °C to 2.94 °C. The mean annual precipitation (MAP) ranges from 489.06 to 957.42 mm. Alpine steppe, alpine meadow and swamp meadow are the main vegetation types on the Plateau. The dominant species consist mainly of Stipa purpurea, Carex moorcroftii and Koeleria cristata for alpine steppe, Kobesia humilis, Kobresia pygmaea and Kobresia parva for alpine meadow, and Kobresia tibetica for swamp meadow30. See Supplementary Table 2 and Supplementary Table 3 for more details of the site information.
Using a standardized sampling design, we collected soil samples from various degradation levels across 15 sites (see Fig. 1a) during the growing season (between July and August) in 2021. All the sampling sites were located at the transitional zones between non-degradation and various degradation levels to ensure equal environmental conditions. The extents of degradation were classified as four successive stages: non-degradation, slight degradation, moderate degradation and heavy degradation (see Fig. 1b for the reprehensive landscapes of different degradation stages). Given that different grassland types (i.e., alpine steppes, alpine meadows and alpine swamp meadows) have different vegetation coverage and are dominated by different plant species in the non-degraded areas (Supplementary Table 3), we have referred to previous studies31 and also considered our own actual situation to formulate the criteria for distinguishing the degradation levels for alpine steppes, alpine meadows and alpine swamp meadows separately, based on two indicators of plant coverage and proportion of edible plants (see Supplementary Table 4), which has also been adopted in the previous literature31. The distance between each two degradation levels was 50-100 m to minimize spatial heterogeneity of biotic and abiotic factors.
Pseudo-replication is a common problem in space-for-time substitution experiments32. Here, we adopt a unique sampling design to minimize this shortcoming. Specifically, in each site, we set three degradation sequences which were taken as the true replicate. Each two degradation sequences were ~500 m apart. Within each degradation sequence and for each degradation stage, we randomly selected three 1 × 1 m plots (within a 30 × 30 m area) which were the pseudo-replications but used to represent the specific degradation stage. There were 12 plots in total (3 plots × 4 degradation states) for each degradation sequence. Within each plot, we recorded the name of each plant species and the coverage of individual species. Then, aboveground plants were cut with scissors and dried to a consistent weight and then weighed. After plant harvest, 9 soil cores (0–10 cm depth) were sampled using a soil drill in a Nine-square Grid. See Supplementary Fig. 5 for a schematic diagram of the detailed sampling design. The collected soils were homogenized for each plot and then sieved (<2 mm). Root samples were dried and weighed, and the sieved soils were transported under cold chain conditions to the laboratory for further analyses. Given the high cost for analyses of soil N transformation rates and microbial functional genes-related nitrification (those are, ammonia-oxidizing archaea and bacteria), we mixed soil samples from the three pseudo-replications within each degradation sequence for analyses of these variables; for other variables, the three pseudo-replication samples were analyzed separately to increase the representativeness of the treatments, but averaged across the three pseudo-replications to correspond with the soil N transformation processes during statistical analyses.
Determination of soil N transformation rates
We employed the 15N pool dilution method to evaluate soil N transformation rates, including gross N mineralization (GNM), microbial immobilization (MIM) and gross nitrification (GN)26. Briefly, an aliquot of fresh soil was divided into four equal subsoil samples. All the four subsoil samples were adjusted to reach 60% of their field capacity because our study attempted to analyze the potential N transformation rates in the optimum moisture conditions. This procedure has also been widely used in previous studies that measured soil N transformation processes33,34,35,36. To test whether adjusting field water holding capacity would influence our results, we explored the relationship of soil water contents between field condition and 60% field water holding capacity, and observed a significant correlation between them (Supplementary Fig. 6). In such a case, we may expect the similar spatial variations in soil N transformation rates between 60% field water holding capacity and real field conditions. The soil samples were then incubated at 15 °C for 1 day37. This incubation temperature was chosen because it was close to the maximum month air temperature among the 15 study sites. After incubation, 15N labeling was carried out for the four subsoil samples: two samples were added with (15NH4)2SO4 solution (15N abundance of 30 atom%) and the other two were treated with K15NO3 solution (15N abundance of 30 atom%). After labeling, each labeling sample was separated into two portions; one portion was extracted immediately using a KCl (2 mol L-1) solution (T0), and the other portion remained in dark for a day, after which they were extracted by the same procedure (T1). The NH4+-N and NO3–-N contents and 15N abundance of NH4+-N and NO3–-N were analyzed for all soil extracts.
The traditional diffusion technique was adopted to analyze 15N abundance of NH4+-N and NO3–-N38. Specifically, three glass beads were placed in a bottle, and then 30 ml of soil leachate was transferred into the bottle. For the 15N abundance of NH4+-N, the glass fiber filter paper that was affixed to the hook within the bottle was moistened with a precise volume of 10 μl of a 1 mol L–1 oxalic acid solution. Subsequently, 0.4 g of magnesium oxide were added to the bottle. The flask was stirred at a low speed in a constant temperature, and the filter paper was collected after 24 h. With regard to the 15N abundance of NO3–-N, the soil extract was shaken for 48 h to remove the residual NH4+-N by adding 0.4 g of magnesium oxide. The filter paper was then replaced by a new acidic filter paper, and 0.4 g of Devarda’s alloy was added to the mixture. During this process, the NO3–-N was collected in the form of NH3 by the new acidic filter paper. The N-containing filter papers were dried in a drying apparatus for 48 h. The 15N abundance was analyzed using an isotope ratio mass spectrometer (IRMS 20-22, SerCon). The rates of gross N mineralization, microbial immobilization and gross nitrification were calculated following the procedures in Mao et al.26.
Soil physiochemical analyses
We measured a number of edaphic properties that potentially influence soil N cycling processes. Bulk density and moisture content were obtained by oven-drying a constant volume (100 cm3) of fresh soils at 105 °C for 1 day. Soil texture, including clay, silt and sand contents, was analyzed with a particle size analyzer (Malvern Masterizer, 2000) after removal of the carbonates and organic matter39. Soil pH was measured in a soil solution (1:2.5 soil to water ratio) using a pH electrode (PB-10, Sartorius)40. For the NO3–-N and NH4+-N contents, 10 g of fresh soils were weighed and extracted with 50 ml of KCl solution (1 mol L–1)41. The soil extracts were then analyzed using a flow injection analyzer (Autoanalyzer 3 SEAL, Bran and Luebbe). The sum of NO3–-N and NH4+-N was the dissolved inorganic N (DIN). The same extracts were used for total dissolved N (TDN) analysis with a Multi N/C 3100 TOC/TNb analyzer (Analytik Jena). The difference between TDN and DIN is taken as dissolved organic N (DON)42.
Soil microbial carbon and nitrogen analyses
We applied the chloroform fumigation method to quantify microbial biomass carbon (MBC) and nitrogen (MBN)43. In short, duplicates of top soil samples (~10 g) were placed in 125 ml bottles and underwent a 7-day pre-incubation at 15 oC. Subsequently, one soil sample served as the unfumigated control, another sample was fumigated for 24 h. Both were extracted with K2SO4 solution (0.5 mol L–1) and then quantified with a Multi N/C 3100 TOC/TNb analyzer (Analytik Jena). Finally, the MBC and MBN was calculated by subtracting the unfumigated values from the fumigated ones, with conversion coefficients of 0.45 and 0.5444,45, respectively.
Assays of enzymatic activity related to soil N transformation process
Two extracellular enzymes (β-1,4-N-acetylglucosaminidase, NAG and leucine aminopeptidase, LAP), related to soil gross N mineralization process, were quantified following the procedure summarized by Saiya-Cork et al.46. To be specific, soil samples (~2.75 g) was mixed with 91 ml of 50 mmol L–1 sodium acetate solution to form a soil suspension. Then, 150 μl of soil supernatant was taken and mixed with 50 μl of 200 μmol L–1 substrate solution in a 96-well plate. The substrates for NAG and LAP were 4-methylumbelliferone-N-acetyl-β-D-glucosaminide and L-leucine-7-amino-4-methylcoumarin, respectively47. Simultaneously, 150 μl of soil supernatant and 50 μl of standards (4-MUB for NAG and 7-amino-4-methylcoumarin for LAP) with various concentrations (0, 1, 2.5, 5, 10, 25 μmol L–1) were used to establish standard curve. The plates were incubated in darkness at 15 °C for 3 h. Fluorescence intensity of the sample was quantified using a multi-functional plate reader (Synergy HIMF, BAKER, USA) with 365 nm excitation and 450 nm emission.
Analyses of soil nitrogen-cycling functional genes
The abundances of amoA genes related to gross nitrification process was quantified, including ammonia-oxidizing archaea (AOA) and ammonia-oxidizing bacteria (AOB)48. We first extracted the DNA from 0.25 g soil using a power soil DNA isolation kit (MOBio Labotatories). The gene copy numbers were evaluated using a QuantStudio™ 5 polymerase chain reaction (PCR) system (Applied Biosystems). We choose reaction systems of 10 µl: 2.5 µl free water, 5 µl of 2xqPCRmix, 0.25 µl of each primer (10 µM) and 2 µl DNA. The procedures to quantify the abundance of AOA and AOB are shown in Table S5. The calibration curves (r² > 0.9) were constructed via ten-time sequential dilution of functional gene-containing plasmids.
Climatic data acquisition
The MAT and MAP data were downloaded from the National Tibetan Plateau / Third Pole Environment Data Center (http://data.tpdc.ac.cn). The ten-year average data (2012-2021) were calculated for the statistical analyses.
Statistical analyses
All statistical analyses were performed in R software (version 4.2.3)49. First, the differences of soil N cycling parameters among degradation levels were compared using linear mixed-effects models. The “degradation level” was considered as a fixed effect and “site” was regarded as a random factor. The mixed-effects models were conducted using the lme4 package50.
Second, the response ratio (RR), which was calculated as the natural log-transformed ratio between degraded plots and non-degraded plots in the same degradation sequences for each site, was adopted to assess the degradation effects on soil N cycling parameters51. The trends of RRs of N cycling parameters with biotic and abiotic drivers, including MAT, MAP, aboveground and belowground biomass, coverage of sedges, grasses and forbs, soil pH, soil moisture, sand content, bulk density and background N status (i.e., the N cycling parameters in non-degraded plots), were explored using the linear mixed-effects models with “site” as a random effect. The strength and direction of the relationships were quantified based on the standardized regression coefficients.
Third, to mechanistically interpret the spatial variations of the degradation effects on soil N cycling parameters, we explored the relationships between degradation-induced changes in soil N cycling parameters (i.e., RRs of the N cycling parameters) and changes in a number of biotic and abiotic drivers (i.e., RRs of the driving factors), including soil environments (pH, soil moisture, sand content and bulk density), substrates (DON, DIN and NH4+-N) and microbial attributes (MBC, MBN, NAG, LAP, AOA and AOB) using the linear mixed-effects models with “site” as a random effect.
Reporting summary
Further information on research design is available in the Nature Portfolio Reporting Summary linked to this article.


Responses