The biogeochemical response of the north-western Black Sea to the Kakhovka Dam breach

Introduction
Over recent years, there has been increasing awareness of the connection between society and its changing behaviours and practices within the terrestrial environment and the downstream impacts on the quality of the coastal and marine environment1,2,3. In addition to the well-known impacts from urbanisation, industrial and agricultural activities, warfare is another factor that can pose significant direct (e.g., oil spill, chemical pollutions, infrastructure destruction, flooding) and indirect (e.g., suspension of management and research) negative impacts to the quality of inland-sea and coastal waters4,5. All stages of war, including the preparation, actual armed conflict and post-war activities, can lead to the deterioration of water quality, water scarcity and biodiversity loss, resulting in shifts in aquatic ecosystem functioning with consequences for human health and wellbeing6,7,8.
The health of the North-Western Black Sea (NWBS) is dominated by the inflow from the Danube, Dniester, Southern Bug and Dnipro rivers9. The drainage basins of these river systems provide the main riverine inputs to the NWBS and are the principal source of anthropogenic pollution into NWBS, characterised by waste from industrial expansion, urbanisation and agricultural intensification10,11. The excessive loading of nutrients led to eutrophication manifesting in phytoplankton blooms and expanded hypoxia and anoxia zones in the water10,12. This was further compounded by the introduction of alien species resulting in change of species diversity and massive mortality of marine organisms, and overfishing leading to reduced fish stocks12,13,14. Those collectively led to the deterioration of the ecosystem particularly in the NWBS shelf area in the end of 1980s and early 1990s10. The stressors were compounded by the almost enclosed physiography of the Black Sea, the heavily stratified nature and anoxic condition, and the limited water exchange with the Mediterranean Sea15,16. These characteristics results in the Black Sea ecosystem being extremely vulnerable to anthropogenic activities10,14. The Kakhovka Dam, built between 1950 and 1956, was the last reservoir on the Dnipro River cascade and the second largest reservoir in Ukraine providing important ecosystem services, including the provision of drinking water, industrial water and irrigation water for more than five million people, hydroelectricity, nuclear plant cooling, fisheries, transportation and recreation17,18,19. The downstream floodplains, marshes, water bodies and islands are also important spawning grounds for fishes, and habitats for rare species19,20.
At around 2:50 am local time (UTC+3) on 6 June 2023, the Kakhovka dam was blown up in the Russia-Ukraine conflict. The water level in Kakhovka Reservoir was around 17.5 m above sea level before explosion, and around 90% of the reservoir was drained after dam breach. The loss of water in the reservoir led to drinking water shortage for up to 1 million people, impacted about 1.5 million hectares agricultural land, accompanied by disruption of electricity and gas supplies17,20. The breach of dam led to ecological disasters to about 40 species and subspecies of fish, the loss of fish resources from the reservoir is estimated to be around 20,000 tons as a result of the loss of spawning grounds19. Moreover, the breach of Kakhovka dam flooded about 630 km2 of land downstream and the water level at the Kherson hydrological station increased from 0.31 m to 5.68 m above sea level on the 8 June17,18. The area flooded included parts of four cities and several dozen villages along the two banks of the river downstream18, impacting about 2000 hectares agricultural land, 80 settlements in Kherson and Mykolaiv Oblasts, and about 38,000 people only on the south side of the river17,20. It was estimated that there were 1087 potential pollution sources from the flooding zone21, and more than 1 million m3 disaster waste was generated from the flooded buildings17. Pollutants such as sewage, industrial wastewater, agricultural nutrients and pesticides, corpses of dead animals, petroleum and hydrocarbons were washed away from the flooded areas and eventually flowed into NWBS21. High concentrations of copper (Cu), zinc (Zn) and arsenic (As), and oil products, chlorinated organic compounds were recorded in Dnipro River, Dnipro-Bug Estuary and Black Sea18. It is therefore imperative to evaluate and understand these impacts to support any environment recovery plans. While previous studies were mainly focused on the impacts on the Kakhovka Reservoir and its fisheries, Dnipro River and terrestrial flooded zones19,21, the environmental impact of the dam breach on the NWBS has, as yet, to be explored.
The ongoing active fighting on both banks of the Dnipro River and Dnipro-Bug Estuary precluded the collection of samples and in situ data in these regions. Furthermore, the ban for civilian vessels accessing the NWBS and restrictions of activities along the Odesa coast restricted any conventional monitoring or assessment of the impact of dam breach on the NWBS water environment. In such circumstances, the analysis of satellite images and numerical modelling provide the only reliable approach to understand the likely impact of dam breach on the NWBS waters. This study uses satellite data, numerical modelling, and limited in situ monitoring data, to collectively reveal the impacts of Kakhovka Dam breach on the water quality properties including total suspended solids concentration (TSS), chlorophyll-a concentration (Chl-a), Secchi disk depth (SDD), and nutrients in NWBS.
Results
Spatial movement of the TSS plume from dam breach
We used hydrological modelling to simulate the flow of water from Kakhovka Dam to the NWBS after dam breach to the end of June 2023. Sentinel-3 Ocean and Land Colour Instrument (OLCI) satellite images were used to quantify the change of water quality in the NWBS after dam breach. By overlaying the water flow velocity, direction and resulting salinity changes from model outputs with the water quality variations from satellite observation, we are able to simultaneously validate the model outputs and track the spatiotemporal impacts from the Kakhovka Dam breach on the NWBS. The plume, where TSS was higher than neighbouring waters, was extracted from satellite imagery to quantify the location and spatial coverage of the impacted areas. Following the emergence of the small plume area with high TSS at the beginning of June in the north of NWBS, the subsequent route of the plume crisscrossed the NWBS, expanding in area with decreasing TSS towards the middle-end of June in the centre-south region of NWBS. The plume finally decreased in both area and TSS at the beginning of July in the southern portion of the NWBS (Fig. 1). The TSS plume was dominated by mineral suspension and organic matters derived from the reservoir, and material entrained in the flood waters from the areas inundated by flooding during the first few days following the dam breach. The plume shifted to more organic matters since 15 June because of severe algal blooms in the NWBS triggered by high concentration of nutrients associated with the flood waters. The average Chl-a and TSS ratio in plume area increased from 0.6 on 9 June to the maximum of 1.8 on 16 June. This change resulted in a change in water colour in plume area from brown/grey to green. The colour of water sample collected in Odesa coastal waters changed from relatively clear on 7 June to green on 20 June, and photos of algal blooms taken from Odesa coast demonstrated this shift (Supplementary Figs. 1–3).

Circles represent the locations of the TSS plume centre after the dam breach, between 9 June and 2 July 2023. The size of each circle indicates the area of the TSS plume, while the colour of the circle reflects the mean TSS in the plume area. The colour of the map represents the maximum change in TSS (in times) after the dam breach, compared to the mean value in the week before the breach.
In detail, sediment from the reservoir and flooded area downstream of Dnipro River, arriving at the Dnipro-Bug Estuary and a small part of northern NWBS on 7 June. The sediments travelled westward via gradient currents and reached Odesa coast on 9 June covering the whole Dnipro-Bug Estuary and northern NWBS with a high average TSS of 39.7 g m−3 (Figs. 1 and 2b). During the first week after dam breach, the NWBS was dominated by hydraulic currents, and easterly and north-easterly winds at night, which resulted in the expansion of the sediment plume south-westward along the Odesa coast. Sediments deposited with time, and phytoplankton growth started to be observable from satellite image in TSS plume area on 10 June. The algal bloom became severe and was witnessed at the Odesa coast on 14 June (Supplementary Fig. 3), and first observed by satellite from 15 June until the end of June (Supplementary Fig. 2). The TSS plume covered an area of 2456 km2 and reached the central NWBS with a reduced mean TSS of 14.5 g m−3 on 15 June, high TSS was observed in the sea adjacent to the Dniester Estuary, and extremely high TSS concentrations appeared between Odesa and Tendra Bay reaching 144.5 g m−3 because of heavy algal blooms (dark red in Fig. 2c). The TSS plume remained in the northern and central NWBS between 15 and 21 June, during which the southern and eastern NWBS were not clearly impacted. From the 21 June, when hydraulic currents from Dnipro-Bug Estuary weakened and the impact of wind currents forced the direction of currents in the north coast of NWBS, from a prevailing westward to an eastward direction (in the direction of Dnipro-Bug Estuary). The currents in the east coast of the NWBS changed southward, which resulted in an eddy current in the northern-central NWBS, maintaining the TSS plume in the northern-central NWBS. From 23 June, the west wind prevailed in the NWBS and the wind-induced currents changed to eastward, resulting in an eastward movement of the TSS plume covering an area of 4316 km2 (Figs. 1 and 2d). The TSS plume kept moving eastward and reached to the east most location off the Tendra spit on 25 June with a reduced TSS to below 10 g m−3, with an area greater than 4,000 km2. The south-westward currents pushed the TSS plume into the southern NWBS on 27 June (Figs. 1 and 2e), and by 30 June, the TSS reduced to below 6 g m−3 (Fig. 2f). Following the 30 June, the TSS plume moved south-eastward. The last detectable TSS plume was on 2 July with a reduced area (1413 km2) and mean TSS (3.6 g m−3), around 10% of its peak value on 9 June. The TSS plume was no longer visible from the 5 July. Daily TSS maps is provided in Supplementary Movie.
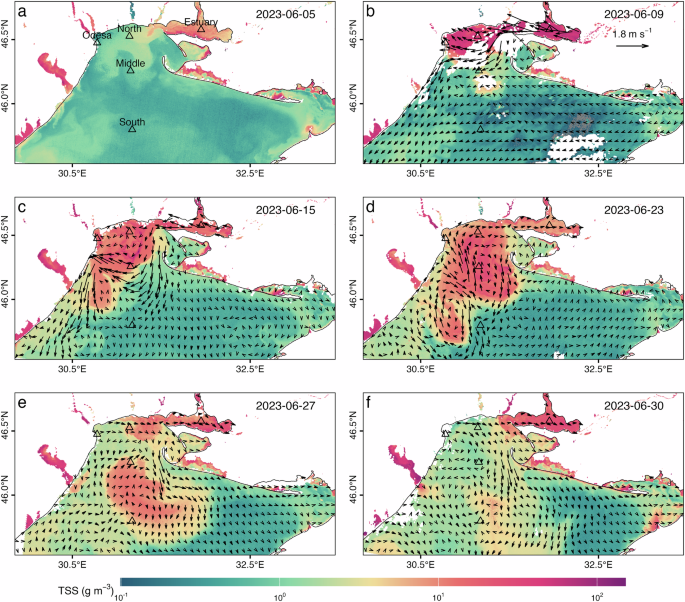
a Mean TSS in the week before the Kakhovka Dam breach (30 May to 5 June 2023), triangles indicate the locations of the Odesa coast (Odesa), the centre of the Dnipro-Bug Estuary (Estuary), northern NWBS (North), central NWBS (Middle) and southern NWBS (South). b–f TSS variations after the dam breach, with values indicated by colour, and current variations, with directions indicated by arrows and magnitudes indicated by the length of the arrows.
We calculated the magnitude of the impact on TSS, Chl-a and SDD values by dividing the values observed following the dam breach (6 June to 5 July) by the mean values observed before the breach (30 May to 5 June). The impacts of the breach on water quality variables in the NWBS showed clear spatial heterogeneities, the nature of which was also variable dependant. For TSS, 57% of the NWBS area experienced levels greater than 5 times the mean TSS values prior to the dam breach (Fig. 3a). Two areas experienced more than 100 times pre dam breach values: the north coastal waters off Fontanka with TSS changing from typical values of 0.5 g m−3 to over 55 g m−3 following the breach; the area impacted by the severe algal bloom in the central NWBS observed changes in TSS from 0.6 g m−3 before dam breach to 65 g m−3 after dam breach (Figs. 1 and 3a, b). For Chl-a, around 66% of the NWBS area experienced levels 5 times greater than the mean value prior to the dam breach. The greatest magnitude of change was observed in the south of NWBS reaching 90 times the pre-dam breach values, peaking at 13 mg m−3 (Fig. 3c, d). Similar observations were also observed for the SDD, with about 75% of the NWBS experiencing a reduction in SDD to half the values observed prior to the dam breach. Significant changes were observed in the north coastal waters from a SDD of 7 m before dam breach to 0.4 m following the breach. For the waters in the NWBS close to the Tendra spit, the intense algal blooms reduced the SDD from 9 m to 0.3 m following the dam breach (Fig. 3e, f). The mean and maximum water quality values in the week before dam breach and during the month following the breach, are provided in Supplementary Figs. 4–6.
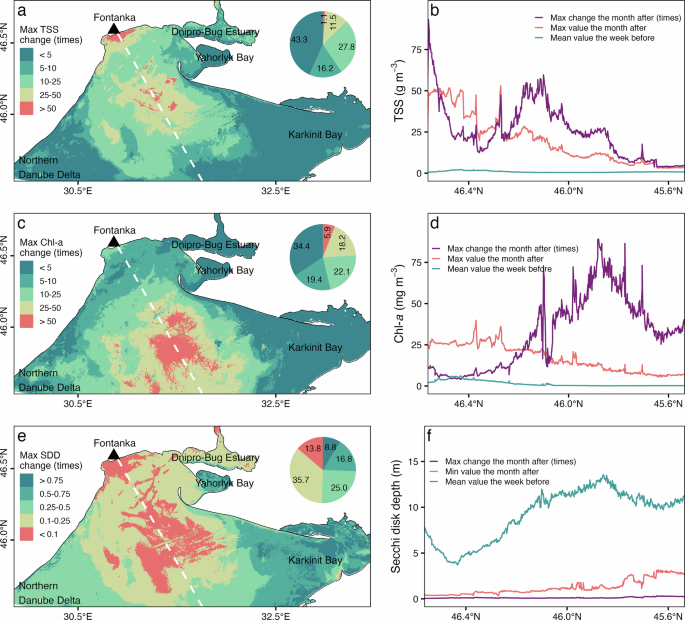
a Spatial distribution of maximum TSS changes, b profiles of the mean TSS in the week before the dam breach, the maximum TSS between 6 June and 5 July 2023, and the maximum change in TSS (in times). c spatial distribution of maximum Chl-a changes, d profiles of the mean Chl-a in the week before the dam breach, the maximum Chl-a between 6 June and 5 July 2023, and the maximum change in Chl-a (in times). e spatial distribution of maximum SDD changes, f profiles of the mean SDD in the week before the dam breach, the minimum SDD between 6 June and 5 July 2023, and the maximum change in SDD (in times). The location of the profiles in b, d, f is indicated by the white dashed line in a, c, e, respectively.
Temporal variations of water quality variables
We investigated how water quality variables changed with time in the NWBS from dam breach to the 5 July 2023. The values were compared in four areas: the centre of Dnipro-Bug Estuary (hereafter Estuary), the centre of northern NWBS (hereafter North), the centre of central NWBS (hereafter Middle) and the centre of southern NWBS (hereafter South) (see triangles in Fig. 2). Higher values of Chl-a and TSS, and lower SDD were observed in the NWBS after dam breach, being observed first in the North followed by the Middle and South of the NWBS. The highest values of TSS were observed in the Estuary and North NWBS on 9 June 2023, with a value of 53.7 g m−3 and 44.9 g m−3 respectively (Fig. 4a). TSS eventually fell to a minimum of 7.2 g m−3 at Estuary on 23 June, and decreased below 2.0 g m−3 at North on 29 June. TSS started to increase on 15 June in the Middle of the NWBS and peaked on 23 June with 20.5 g m−3, and fell back to pre-dam breach levels (1.0 g m−3) on 2 July. In the South, TSS showed a peak of 6.4 g m−3 on 29 June, and sustained a value of around 1.5 g m−3 until end of July, which was about 4 times as pre-dam breach levels (0.4 g m−3).
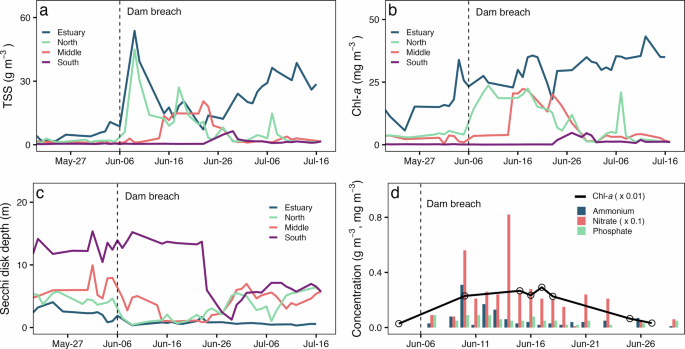
a Changes in total suspended solids concentration (TSS) at four sites: Estuary, North, Middle and South. b changes in chlorophyll-a concentration (Chl-a) at four sites: Estuary, North, Middle and South. c Changes in Secchi disk depth (SDD) at four sites: Estuary, North, Middle and South. d Changes in nutrients and satellite-observed Chl-a in Odesa coastal waters (Langeron). The locations of Estuary, North, Middle, South, and Odesa are marked in Fig. 2.
Chl-a changes occurred over a similar timeline but with different impacts to TSS. Compared with the other three sites, Chl-a concentrations within the Estuary were higher and continued to increase over the study period (Fig. 4b). The highest Chl-a value in the North was 23.7 mg m−3, occurring on the 10 June, decreasing to 3.4 mg m−3 on 29 June, which was similar to pre-breach concentrations (4.5 mg m−3). A similar peak concentration of Chl-a (22.3 mg m−3) also appeared later on 17 June in the Middle of the NWBS. In the South, the Chl-a concentration peaked at 4.8 mg m−3 on 27 June. Chl-a in the Middle site decreased to 1.4 mg m−3 on 30 June, similar to pre-dam breach (2.1 mg m−3). However, Chl-a in the South was sustained at a higher level (1.4 mg m−3) than pre-dam breach (0.2 mg m−3) until end of July, indicating a longer-term impact from the dam breach to the wider Black Sea area.
SDD decreased to a minimum value of 0.3 m and 0.4 m in the Estuary and North respectively on 9 June (Fig. 4c). These values recovered to pre-dam breach SDD (5.6 m) by the 29 June in the North, whilst the SDD in the Estuary only recovered slightly and remained at around 0.6 m. In the Middle, SDD decreased to below 1.0 m from the 15 June and reached to a minimum of 0.9 m on 23 June. The SDD recovered in the Middle from 25 June and returned to pre-dam breach levels (6.0 m) on 30 June. SDD in the South decreased on 24 June and reached to a minimum of 1.3 m on 29 June, and recovered to around 6.5 m over the study period compared to 12.5 m before the dam breach.
In situ measurements of nutrients in the Odesa coastal sea waters showed a significant increase following the dam breach, and demonstrated a similar trend over time to the Chl-a trends observed from the satellite data (Fig. 4d). Over the first days following the plume reached the Odesa coast, high concentrations of ammonium were observed, which is the initial form of mineral nitrogen resulting from the mineralisation of organic matter from, e.g., sewage systems of settlements, cesspools, livestock farms, etc. This high concentration of nutrients contributed to a rapid algae bloom. The nitrate concentration reached a first peak on 10 June and a maximum on 14 June, and remained high until 23 June. The phosphate concentrations were high from 10 to 12 June, and started to decrease since then.
These temporal variations of water quality variables resulted primarily from hydraulic currents before 14 June especially in the Estuary and North of the NWBS, and from wind-induced circulation in the sea after 14 June.
Discussion
Our investigation shows, for the first time, the consequences of weaponising the Kakhovka Dam, beyond the direct devastation downstream, directly impacting the water environment and causing significant sediment plumes and severe algal blooms in the NWBS. In early 2022, there were other rivers and dams weaponised during the Russia-Ukraine war. For example, the dam in the mouth of the Irpin River in Ukraine was destroyed to protect the city of Kyiv22,23,24. Similar activities and impacts have also been reported during the World Wars I and II, the Korean War and the Gulf War, where dams or levees were attacked or sabotaged to stop troops advancing. These acts of aggression inevitably led to flooding, followed by water shortages, downstream destruction of farmlands, villages and cities with wide ranging environment consequences5,25,26,27.
The flushing by large volumes of fast-flowing fresh water from Kakhovka Reservoir, and the observed deterioration in water quality after dam breach in the NWBS may have impacted important habitats and ecologically protected areas from the Dnipro-Bug Estuary out to the NWBS. These protected areas include: (1) the Dniprovsko-Buzkyi Lyman (estuary) (712 km2) and the Biloberezhzhia Sviatoslava National Nature Park (coastal) (352 km2) (Fig. 5a), were both impacted directly by the dam burst, resulting in a dramatic increase in TSS and simultaneous decreases in SDD and salinity28 (Supplementary Figs. 4 and 6); (2) the Black Sea Biosphere Reserve (1158 km2) and the Zernov Phyllophora Field Zakaznyk (4036 km2) (Fig. 5a), where the severe algal blooms appeared and the Chl-a changed significantly following the dam breach (Fig. 3c, Supplementary Fig. 5). The increasing Chl-a concentration resulted from the phytoplankton bloom, which can in turn alter the oxygen level in the water29. Investigations in Odesa Bay have shown that the biological oxygen consumption (measured as BOD5) increased to nearly 3 mg L−1 on 21 June, 2023 after dam breach compared to < 1 mg L−1 before dam breach30. High TSS with reduced SDD will reduce light penetration into the water column because of the high absorption by particles, which in turn can influence the rate of phytoplankton photosynthesis and water temperature31,32. Reduced UV radiation may have also weakened the UV’s effect in reducing viral infection and parasites in aquatic organisms33,34. As a transport medium, sediments may have brought bacteria, especially pathogenic and antibiotic-resistant bacteria, from the wastes in flooded areas and dead animals entering the NWBS threating the health of aquatic organisms30. As a result of the large amount of freshwater entering NWBS from Kakhovka Reservoir, salinity in the northern part of the NWBS also decreased28.
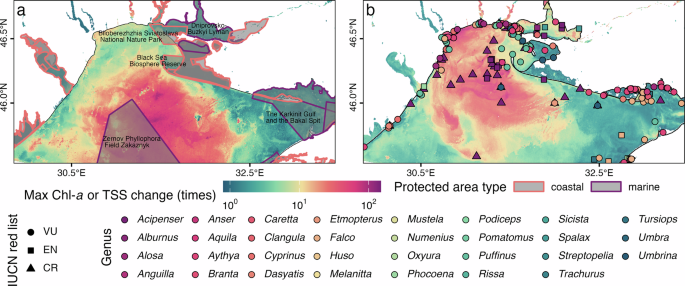
a Marine and coastal protected areas in the NWBS, overlaid with the map of maximum chlorophyll-a concentration (Chl-a) changes in the month after the dam breach, compared to the week before the breach. Protected area data were sourced from the World Database on Protected Areas (WDPA). b Observed occurrences of genera on the IUCN Red List in the NWBS between 1905 and 2024, overlaid with the map of maximum total suspended solids concentration (TSS) changes in the month after the dam breach, compared to the week before the breach. Triangles represent critically endangered (CR) genera, squares represent endangered (EN) genera, circles represent vulnerable (VU) genera. Biodiversity occurrence data were sourced from the Global Biodiversity Information Facility (GBIF).
These drastic changes to the quality of the water environment may also have impacted various species, with consequences for ecosystem functions. It may be anticipated that aquatic organisms might migrate to other areas of the Black Sea or across water layers. These events may have contributed to the death or even extinction for not only aquatic organisms but also other animals (e.g., minks, birds) that depend on the Black Sea coastal environment. By checking the Global Biodiversity Information Facility (GBIF) database, we found a high biodiversity in the NWBS water and coastal environment. Eight observed animals including fish (Acipenser gueldenstaedtii, Acipenser nudiventris, Acipenser stellatus, Acipenser sturio, Anguilla Anguilla, Huso huso), bird (Numenius tenuirostris) and mink (Mustela lutreola) are categorised as critically endangered in the IUCN Red List. Seven observed further species of fish (Acipenser ruthenus, Alburnus sarmaticus), bird (Falco cherrug, Oxyura leucocephala), porpoise (Phocoena phocoena) and dolphin (Tursiops truncatus), and mole (Spalax arenarius), are on the endangered list. A further 21 animals are on the vulnerable species (Fig. 5b). Among them, the most impacted aquatic animals might be the genus of Acipenser, Anguilla and Huso, which are critically endangered and live in the NWBS water where dramatical sediment changes were observed after dam breach (dark red triangles in Fig. 5b).
The high TSS we observed in NWBS after the dam breach indicates a high loading of sediments and water from Kakhovka reservoir, Dnipro River and the flooded area. These sediments, including flushed clays, silts and fine sands, may bring high concentration of nutrients to the NWBS. The in situ monitoring data confirmed the pulse of elevated nutrient concentrations that is likely to have triggered heavy algal blooms in the Odesa coast after dam breach (Figs. 4d and 7d, Supplementary Fig. 3). Analysis of bacterioplankton communities for water samples taken from coastal water near Odesa on 13 and 14 June 2023 revealed the prevalence of cyanobacteria, further confirming the extent of the eutrophication event following the dam breach30. They can also possibly pose significant alternations to the seabed habitats along the Dnipro-Bug Estuary to the shallow NWBS. The NWBS hosts 46% of the seabed habitat types in the Black Sea (Supplementary Fig. 7), shallow circalittoral and infralittoral muddy habitats in the northern NWBS and Dnipro-Bug Estuary might have been largely destroyed by the high rate of water flushing after the dam breach. This was demonstrated by the modelling results which indicated that the freshwater input reached up to 10–15 m depth and interacted with the sea bed in the shallower reaches of the NWBS35. Furthermore, the original seabed habitats are likely to have been impacted by fresh deposits of contaminated fine sediment. Importantly, sediments in Kakhovka Reservoir may include high concentration of heavy metals from more than 60 years’ deposition, because the reservoir is located in a catchment characterised by heavy industry and agriculture. Field surveys before the dam breach in the Dnipro cascade water bodies have shown that Kakhovka Reservoir and Dnipro-Bug Estuary were the most polluted36,37. High concentrations of heavy metals including Fe, Mn, Cu, Zn, Cr and Cd in the surface layer (0–5 cm) of the bottom sediments in Kakhovka Reservoir and Dnipro-Bug Estuary were reported. These were attributed to mine wastewaters, metallurgical and chemical factories in the catchment. Investigation of water samples from the Dnipro River, Dnipro-Bug Estuary and Odesa coast after dam breach have confirmed that the presence of high concentration of heavy metals and some of them (e.g., Zn) have exceeded the environmental quality standard (EQS) values30,38. It is therefore reasonable that a high quantity of heavy metals was flushed away from the sediments in Kakhovka Reservoir and Dnipro-Bug Estuary entering the NWBS after the dam breach by the high-speed water flow. Unlike nutrients, heavy metals are not degradable, which may therefore bioaccumulate in fish through the digestive tract, or crossing biological membranes such as gills and muscle, presenting threats to the health of aquatic animals and potentially human beings39,40,41.
The on-going war and resulting inaccessibility to the NWBS, have prohibited field investigations to assess the impacts of the dam breach. Here, we mainly present the short-term impact in the upper layers of the water observed from optical satellite data. In addition to our observations, further impacts might be anticipated, but are unlikely observable from optical satellite images. They are likely to be present in the deeper layer or at the sediment water interface, and may not be immediately obvious or observed. For example, a lot of allochthonous and autochthonous detritus depositing on the sea floor may subsequently result in hypoxia or anoxia in deeper waters, eradicating benthic organisms. The circulation within the Black Sea is likely to have redistributed pollutants across the whole Black Sea. As the Black Sea is almost an enclosed water body with a long water residence time (a few hundred years or more)15,16, pollutants that have entered the Black Sea are likely to persist for protracted periods of time. Future investigation is needed to assess the impact of the complex cocktail of debris and pollutants, such as analysing heavy metals in surface layer of sediments in the NWBS, investigating phytoplankton and zooplankton groups and biodiversity in the NWBS, examining the health of fishes, and extending the investigation to other parts in Black Sea, to assess the wider impacts on the aquatic ecosystem in Black Sea and in the longer term. Despite these complexities, the findings presented here provide a framework to prioritise future investigations to explore the longer-term impact of this catastrophic event.
Methods
Modelling
The spatiotemporal dispersion of polluted water from the Dnipro-Bug Estuary to the NWBS was modelled using the hydrodynamic module D-Flow Flexible Mesh42. The unstructured model grid consists of 23,128 points (22,494 model cells), has a curvilinear topology and variable size of calculation cells and covers the whole Black and Azov Seas. In the vertical plane, the model has 7 levels in the curvilinear σ coordinate system of variable thickness of layers progressively increasing from the water surface to the sea floor. The model was run for the dates from 1 to 30 June 2023. The integration time step is dynamically defined by the model using the Courant–Friedrichs–Lewy condition within a user-specified interval. In our case, the initial time step in the model was assumed to be 1 s, and the maximum time step was 30 s.
The upper boundary of the model grid was open with zonal and meridional winds and sea level pressure. The atmospheric variables at the points of a regular 0.25° grid at 3-h intervals were obtained from the archive of forecasts by the GFS model through the NOMADS web service. On the open lateral border of the model grid at the mouth of Dnipro River, the water level was varied according to the observations at the Kherson hydrological station. River water temperature was obtained from the measurements at the Kyiv hydrological station, and the mineral particle concentration of river water was assumed to be equal to 2 mg dm−3. The initial temperature and salinity of sea water and sea level were assumed to be heterogeneous fields with a horizontal step of 1/40° obtained from the reanalysis data of Copernicus Monitoring Environment Marine Service (CMEMS)43. More details of the modelling can be found in refs. 28,35.
In situ data collection
The ongoing war precluded the collection of a full in situ dataset from NWBS to validate the methods for estimating water quality properties. We used in situ total suspended solids concentration (TSS), chlorophyll-a concentration (Chl-a) and Secchi disk depth (SDD) data pairs collected from 39 locations in Romanian coastal waters in the Black Sea next to our study area from two research cruises in May and September 2023 (hereafter In situ Dataset I). These Romanian sites were used to validate the water quality variables estimated from satellite images. Water samples were taken from sea surface and filtered through 25-mm diameter 0.7-μm pore size filters to measure Chl-a, and 47-mm diameter 0.7-μm pore size filters to measure TSS. Chl-a was determined using the high-performance liquid chromatography (HPLC) method. TSS was determined using the gravimetric method. SDD was measured using a 30-cm diameter white disk. Details of the protocol used for measuring Chl-a, TSS and SDD are provided in ref. 44.
We compiled in situ TSS (N = 50) measured in waters close to Nova Dofinivka village, Langeron beach and Zolotyi Bereh Beach in Odesa, Ukraine on 7–29 June 2023 to further validate the accuracy of satellite-derived TSS (hereafter In situ Dataset II). We also collected in situ nutrient data including nitrate, ammonium and phosphate measured from the water close to Langeron Beach, Odesa on 7–29 June 2023 to investigate variations in nutrient concentration after dam breach and its relationship with satellite-derived Chl-a. These in situ TSS and nutrients data were measured by the State Ecological Inspection of the Northwest Black Sea Region and published by the Department of Environment and Natural Resources of Odesa Regional State Administration, Ukraine45. In addition, we obtained in situ Chl-a (N = 15) measured in waters close to the Yacht Club, Velykyi Fontan and Malyi Fontan in Odesa, Ukraine between 7 June and 26 July to validate the accuracy of satellite-derived Chl-a (hereafter In situ Dataset III). In situ Chl-a data were provided by the Ukrainian Scientific Centre of Ecology of the Sea.
Satellite image processing
Sentinel-3 Ocean and Land Colour Instrument (OLCI) Level-1 satellite images with a spatial resolution of 300 m covering the NWBS between May and September 2023 were downloaded from Copernicus Data Space Ecosystem (https://dataspace.copernicus.eu) to retrieve water quality variables. The C2RCC atmospheric correction method from the Sentinel Application Platform (SNAP 9.0) was applied to all downloaded satellite images to remove the impacts from atmosphere and obtain the remote sensing reflectance (Rrs). Clouds and cloud shadows were detected and masked out for all satellite images using the Idepix module in SNAP. Land was masked out by using the normalised difference water index (NDWI)46 calculated from OLCI images with a threshold of 0.1. TSS was then retrieved from satellite Rrs using the semi-analytical algorithm from ref. 47. Chl-a was retrieved from Rrs using an optical water type classification-based approach from ref. 48. SDD was retrieved from Rrs using the semi-analytical algorithm from ref. 49. The median TSS, Chl-a and SDD estimates in a 3×3-pixel window of in situ sampling location were extracted from satellite images and compared to the in situ measured TSS, Chl-a and SDD from In situ Dataset I to validate the models for retrieving water quality variables. Results demonstrated that these methods can reliably provide accurate estimates with the median absolute percentage error (MAPE) of 25.3% for TSS, 35.1% for Chl-a, and 9.2% for SDD (Fig. 6).
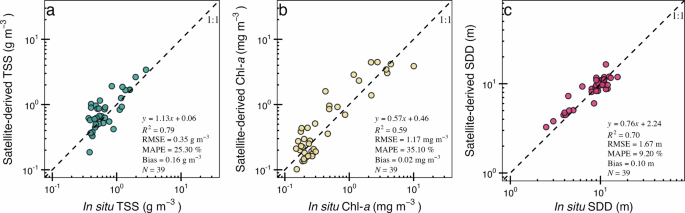
a Comparison between satellite-derived TSS and in situ measured TSS. b Comparison between satellite-derived Chl-a and in situ measured Chl-a. c Comparison between satellite-derived SDD and in situ measured SDD. The regression analysis, root mean square error (RMSE), median absolute percentage error (MAPE) and bias for each plot were calculated using untransformed values.
The median TSS and Chl-a estimates in a 3 × 3-pixel window from satellite images were extracted from 1 km off the coast of the three sampling locations (Langeron, Nova Dofinivka, Zolotyi Bereh beaches in Odesa, Ukraine) for In situ Dataset II, and the three sampling locations (Yacht Club, Velykyi Fontan and Malyi Fontan) for In situ Dataset III, and compared with in situ TSS and Chl-a. This approach avoided any potential influences from adjacent land and shallow water. The satellite-derived TSS and Chl-a agreed well with in situ values measured on the same day and same location (Fig. 7a, c). The changing trend of satellite-derived TSS and Chl-a timeseries also overlaid very well with in situ data timeseries, both of them showed higher values after dam breach (Fig. 7b, d).
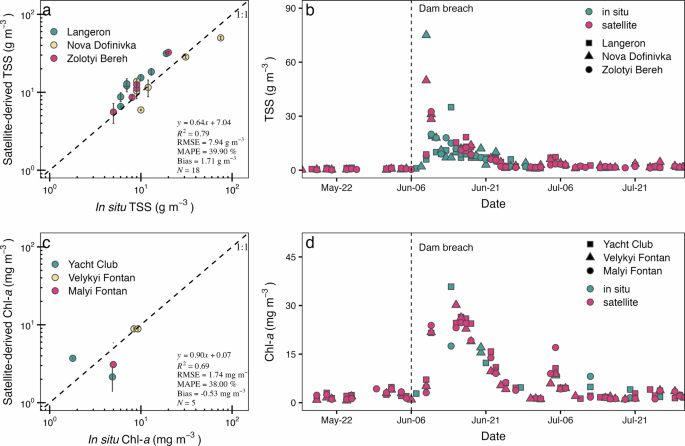
a Comparison between satellite-derived TSS and in situ TSS measured on the same day as the satellite overpass. b Comparison between satellite-derived TSS timeseries and in situ measured TSS timeseries. c Comparison between satellite-derived Chl-a and in situ Chl-a measured on the same day as the satellite overpass. d Comparison between satellite-derived Chl-a timeseries and in situ measured Chl-a timeseries. The vertical solid line in a and c indicates the standard deviation of values within the 3 × 3-pixel window from the satellite image. The regression analysis, root mean square error (RMSE), median absolute percentage error (MAPE) and bias for plots a and c were calculated using untransformed values.
The median TSS, Chl-a and SDD in a 3×3-pixel window of four locations: the centre of Dnipro-Bug Estuary (Estuary, 46.577° N, 31.948° E), the centre of the northern NWBS (North, 46.526° N, 31.142°E), the centre of central NWBS (Middle, 46.256°N, 31.155°E), and the centre of southern NWBS (South, 45.798° N, 31.173° E), were extracted from all processed satellite images to generate water quality timeseries in May-July 2023. These time series were used to analyse the impacts of the dam breach at different locations in the NWBS, and the temporal variations of water quality properties in the NWBS.
TSS plumes were detected from the satellite-derived TSS maps between 6 June and 5 July in the NWBS using a K-means classification method from the “raster” package in R. The area of plumes and the mean TSS in the TSS plume area were then calculated from the detected plumes. To quantify the impacts of dam breach on water environment in the NWBS, we calculated the maximum changes for each of the water quality variables. For each pixel in the NWBS, TSS and Chl-a maximum changes (units: times) were calculated as the maximum values between 6 June and 5 July 2023 dividing by the mean values from the week prior to the dam breach, i.e., 30 May to 5 June 2023. SDD maximum changes were calculated as the minimum SDD values between 6 June and 5 July 2023 dividing by the mean values from the week prior to the dam breach.


Responses