V̇O2peak estimation in people with overweight and obesity before and after a 14-week lifestyle intervention
Introduction
Epidemiologic evidence strongly supports that cardiorespiratory fitness (i.e. V̇O2peak) is a powerful and independent predictor of morbidity and all-cause mortality beyond traditional risk factors [1,2,3,4]. Despite the well-established evidence and the 2016 scientific statement from the American Heart Association that V̇O2peak is a vital sign, V̇O2peak remains an underrated measure in both clinical and public health settings [5]. Directly measured pulmonary gas exchange rates during graded exercise testing until exhaustion (CPET) is the gold standard method for the determination of V̇O2peak [1]. The feasibility and use of the gold standard method is limited due to cost, time, exhausting exercise, and discomfort [5,6,7]. Non-exercise (N-Ex) V̇O2peak estimation equations constitute a feasible alternative with good applicability as a morbidity and all-cause mortality risk prediction tool [6,7,8]. However, N-Ex estimated V̇O2peak (eV̇O2peak) shows moderate accuracy when compared to V̇O2peak measured directly [9] and lacks accuracy in detection of V̇O2peak change over time [10]. This is even more pronounced when applied in subjects with a low V̇O2peak [9], a high BMI [11], or athletes [12], probably due to a weaker association between generally used determinants of V̇O2peak (age, sex, weight, and height), highlighting the need for better models within these populations. The N-Ex V̇O2peak estimation equations that include physical activity (PA) often perform better than those without, as PA is a major modifiable contributor to changes in V̇O2peak [1]. Physical activity is mostly self-reported as objectively measured PA limits the onsite feasibility of the eV̇O2peak, which is a limitation of the equations. Seismocardiography (SCG) measures precordial vibrations that originate from cardiac movement using an accelerometer, and the SCG wave-formed signal corresponds to the events in the cardiac cycle [13,14,15]. SCG thus provides an objective measure of cardiac function, which has been associated with exercise capacity [16, 17]. Time intervals and amplitudes in the SCG signal correlate with V̇O2peak [18] and a N-Ex V̇O2peak estimation equation using SCG at rest in combination with known anthropometric determinants of V̇O2peak has been developed (SCG eV̇O2peak) [18] and validated in healthy subjects [19, 20]. This study aimed to assess the accuracy and applicability of the established SCG V̇O2peak equation in a population with overweight and obesity before and after a 14-week lifestyle intervention by comparison between the obtained SCG eV̇O2peak value and the directly measured V̇O2peak value from a graded exercise test. Furthermore, the accuracy of the SCG eV̇O2peak was compared with two other established N-Ex V̇O2peak estimation equations.
Materials and methods
Study outline
This explorative study was part of another study investigating the proof of concept of a biological age model following a 14-week lifestyle intervention in people with overweight and obesity (unpublished). The study was carried out in the spring of 2022 (n = 46) and 2023 (n = 27) at “Ubberup Højskole” (UBH) in Denmark. UBH is a privately run Folk high school that offers a 14-week course on healthy living and lifestyle changes, where students live and voluntarily participate in daily lectures and activities at the school. The school typically enrolls around 70–80 students per course and most of the students have overweight or obesity. The study inclusion criteria were age above 18 years and a body mass index between 25 and 50 kg·m–2. The exclusion criteria were previous or current cardiovascular disease, pregnancy, and conditions preventing the performance of an exercise test to exhaustion. Participants received oral and written information about the study and the associated risks before written consent was obtained. This was an explorative study and not a confirmatory study of a well-defined hypothesis, therefore a sample size calculation was not conducted. The plan was to include as many participants as possible. The study adhered to the principles of the Helsinki Declaration and was approved by the Science Ethical Committee of the Greater Region of Copenhagen, Denmark (2022: H-19073643) and (2023: H-23012857). The intervention of the study is registered at ClinicalTrials.gov (NCT04279366).
Lifestyle intervention
The course provides lectures on physical activity, health and nutrition, personal development, creative expression, and social studies and amounts to between 16 and 21 h of education per week. Furthermore, different physical activities, such as volleyball, swimming, cycling, walking, etc. are organized and provided daily. Food is also provided by the school with 4–6 daily meals and a particular emphasis is placed on healthy good-tasting food that is inspiring and stimulating to all the senses. It is recommended by the school that 50% of the plate should be vegetables, 25% starchy food, and 25% protein-containing foods. The students are provided with the opportunity to follow an individual diet, which guides them in portion size and structured eating times. It is the student’s own choice and responsibility to follow lectures, participate in activities, and/or follow the food guidance during the 14-week course.
Overall experimental design
Testing was performed over three consecutive days in the first week and the last week of the 14-week course at UBH. Participants arrived in groups of five every 1.5 h from 07.00 to 11.30 following an overnight fast for measurement of anthropometry, body composition with bioimpedance (Tanita MC-780MA P, Tanita Corporation, Tokyo, Japan), blood pressure in supine position in triplicates separated by two minutes (Boso Medicus Control, BOSCH + SOHN GmbH u. Co. KG, Jungingen, Germany), estimation of V̇O2peak using SCG and completion of the International Physical Activity Questionnaire (IPAQ) short form for assessment of self-reported physical activity. Data from the body composition and blood pressure measurements will be presented as part of the biological age study (unpublished). The participants then arrived in the same groups of five on the same day for exercise testing occurring between 12.30 and 17.00 h.
Estimation of V̇O2peak using Seismocardiography
The SCG V̇O2peak estimation procedures were performed as previously described [20]. Non-invasive cardiac vibrations on the sternum were recorded at supine rest with a small medical device (Seismofit®, VentriJect Aps, Hellerup, Denmark) containing a three-axis digital output accelerometer. The Seismofit device was placed with double adhesive tape on the sternum two centimeters proximal to the processus Xiphoideus. The Seismofit device is connected to a smartphone app with a cloud-based solution for SCG signal processing and algorithm-derived eV̇O2peak using before-entered age, sex, weight, and height of the participant in the app. The entire measurement lasts approximately three minutes (40-second SCG recording, 2 min data transferring and signal processing). The app then provides the estimated V̇O2peak score together with a resting heart rate, however, the recorded SCG signal is not available. The 4.6 version of the SCG V̇O2peak estimation model was used in this study (Schmidt et al., major revision in NPJ Cardiovascular Health 2024). Schmidt et al. will describe the development of this model version and it is presented in Table 2. When the influence of the SCG in the V̇O2peak model in the 4.6 database is assessed by comparing a regression model using only age, sex, weight, and height as variables with the model including SCG, the overall total explained variance increase from 0.65 to 0.76% in the model with SCG and the standard error of estimate (SEE), and mean absolute percentage error (MAPE) decrease from 6.1 ml·min–1·kg–1 to 5.0 ml·min–1·kg–1 and from 11.8% to 8.9%, respectively.
Estimation of V̇O2peak using other non-exercise equations
Two other non-exercise V̇O2peak equations were chosen to compare the performance of the SCG V̇O2peak estimation model (Table 2). The equation by Schembre and Riebe [21] was used because this equation includes self-reported activity level obtained from IPAQ which was also obtained in the present study as a part of the biological age design. The equation by Myers et al. [22] was used as this is considered the best reference equation that uses the same demographic variables used in the SCG equation. In addition, the regression model without SCG and only demographics from the 4.6 database (No SCG eV̇O2peak) was applied to investigate the influence of SCG within the model in this population.
V̇O2peak exercise testing
A graded exercise test protocol for determination of V̇O2peak was performed on a stationary cycle ergometer (Monark 839E, Monark Exercise AB, Vansbro, Sweden) with pulmonary gas exchange rates measured continuously using a mixing chamber and online equipment (Quark CPET, Cosmed, Rome, Italy). Pulmonary gas exchange measurements were obtained using 30-s running average with sampling every 10-s automatically by the software (Omnia, Cosmed, Rome, Italy). Two identical setups of cycle ergometers and online equipment were used simultaneously to keep up with the flow of participants. The applied exercise protocol was a 5-min warm-up at 30 W for women and 50 W for men, followed by increments of 20 W and 25 W every minute until voluntary exhaustion for women and men, respectively. Three experienced physiologists performed the testing and evaluation if the participant was at voluntary exhaustion. The participants were verbally familiarised with the test beforehand and encouraged throughout the entire test to exert their absolute best. The V̇O2peak was determined as the highest V̇O2 measured during 30 consecutive seconds. According to often-used test validity criteria, 69% of baseline and 65% of follow-up tests showed a VO2-plateau, defined as less than 2.1 ml·min–1·kg–1 with increasing workload. Only three baseline tests and three follow-up tests did not meet a VO2-plateau or at least two out of three secondary criteria (respiratory exchange ratio >1.1, within 10 bpm of age-predicted maximal heart rate, and 18≥ on the Borg 6–20 rate of perceived exertion scale) but these are included in the data analysis. The cycle ergometers and online equipment were calibrated according to the manufacturer’s instructions using a compressed gas mixture (5% CO2 and 16% O2) for the gas analyzers and a 3 L calibration syringe for the digital flowmeter in the mixing chamber setup, in the morning and after every other test. Participants were measured with the same equipment at baseline and at the follow-up test.
Statistics
Data were normally distributed and presented as means ± 95% confidence intervals (CI) unless otherwise stated. The agreement and estimation error between measured and estimated V̇O2peak were analyzed using Bland-Altman plot (BA-plot) with 95% limits of agreement (LoA) [23], Standard Error of Estimate (SEE), and Mean Absolute Percentage Error (MAPE). Pearson product-moment correlation coefficient (Pearson’s r) was used to evaluate the relationship between V̇O2peak and eV̇O2peak. SEE was calculated using: ({SEE}=surd sum frac{{left(Y-{Y}^{{prime} }right)}^{2}}{n-2}), with Y representing V̇O2peak and Y’ representing eV̇O2peak values. To evaluate the applicability of the eV̇O2peak equations, the agreement in classifying participants into V̇O2peak tertile groups was assessed at baseline and follow-up by Cohen’s κ coefficients and the 95% CI and interpreted as previously described [24]. The participants were divided into V̇O2peak tertiles based on age and sex using the Fitness Registry and the Importance of Exercise National Database (FRIEND) [25] and classified as having “lower” V̇O2peak if they were below the 33rd percentile, “mean” V̇O2peak if they were between the 33rd and 66th percentile, and “higher” V̇O2peak if they were above the 66th percentile. For participants completing the intervention, differences between baseline and follow-up were analyzed with a student’s paired t-test, except for V̇O2peak (absolute and relative) which was also analyzed across methods (eV̇O2peak and V̇O2peak) by two-way ANOVA repeated measures. Results from the two-way ANOVA are presented as mean difference and [95% CI of difference], with the intervention: follow-up (B)—baseline (A), method: measured (1)—estimated (2), interaction; (B1-A1)—(B2-A2). A significance level of α = 0.05 was applied. The performance of the eV̇O2peak equations in the detection of changes in V̇O2peak was based on Pearson’s r and BA-plot between changes. Absolute eV̇O2peak was found by multiplying the body mass of the participant to the estimate. Statistical analyses were performed, and figures were constructed in GraphPad Prism 10.1.1 (Software Inc., Boston, Massachusetts, USA) and Microsoft Excel (Microsoft Corporation, Redmond, Washington, USA).
Results
The characteristics of the participants at baseline and the changes at follow-up are presented in Table 1.
Agreement and estimation error of estimated V̇O2peak at baseline
Compared with measured V̇O2peak a negligible bias with a considerable 95% LoA was found for V̇O2peak estimated with the SCG equation and the Myers et al. [22] equation (Fig. 1a, b, respectively), and both equations showed moderate estimation errors (Table 2). The eV̇O2peak using Schembre and Riebe [21] showed a significant bias with a considerable 95% LoA (Fig. 1c) and large estimation errors (Table 2).
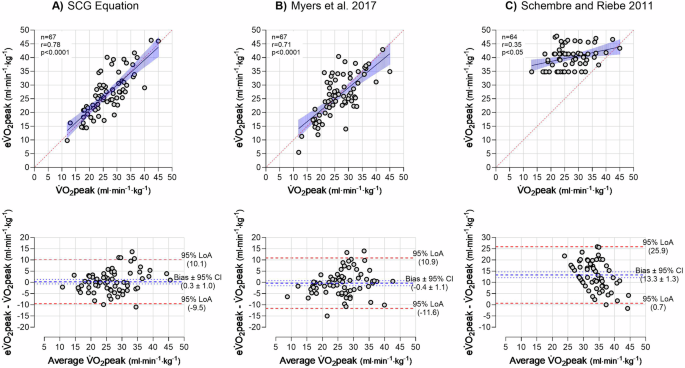
A V̇O2peak estimated with the SCG equation. B V̇O2peak estimated with the Myers et al. equation [22]. C V̇O2peak estimated with the Schembre and Riebe 2011 equation [20]. V̇O2peak peak oxygen consumption; eV̇O2peak estimated V̇O2peak; SCG seismocardiography; LoA limits of agreement; CI confidence interval. n = 67.
Changes in measured and estimated V̇O2peak at follow-up
Measured V̇O2peak increased by 12% and the SCG eV̇O2peak by 9% at follow-up with no difference between methods (Intervention: 2.9 ml·min–1·kg–1 [2.2 to 3.7], Method: 0.2 ml·min–1·kg–1 [–1.2 to 1.5], Interaction: 0.8 ml·min–1·kg–1 [–0.2 to 1.7]). An interaction effect was observed for the equation by Myers et al. (1.5 ml·min–1·kg–1 [0.7 to 2.3]) with a post hoc Šidák’s multiple comparisons test showing a 7% increase in eV̇O2peak (1.8 ml·min-1·kg-1 [1.1 to 2.5]) but a difference between methods at follow-up (2.1 ml·min–1·kg–1 [1.4–2.8]) and not at baseline (0.6 ml·min–1·kg–1 [–0.05 to 1.3]). The eV̇O2peak for Schembre and Riebe increased by 7% with a difference between methods and no interaction (Intervention: 3.0 ml·min-1·kg-1 [2.4 to 3.7], Method: –12.8 ml·min–1·kg–1 [–14.7 to –10.9], Interaction: 0.5 ml·min–1·kg–1 [–0.8 to 1.8]). Modest positive correlations and 95% LoA were observed between changes of V̇O2peak and eV̇O2peak values for the SCG equation and the equation by Myers et al. (Fig. 2A, B), whereas no correlation and large 95% LoA were observed for the equation by Schembre and Riebe (Fig. 2C). Body mass was reduced by 6% at follow-up (–6.6 kg [–8.0 to –5.2]). Absolute V̇O2peak increased by 175 ml·min–1 [97 to 253] and eV̇O2peak increased by 93 ml·min–1 [17 to 169] for the SCG equation and was unchanged for the equations by Myers et al. (18 ml·min–1 [–5 to 42]) and Schembre and Riebe (23 ml·min–1 [–91 to 137]). There was no difference between absolute V̇O2peak and SCG eV̇O2peak (Intervention: 134 ml·min–1 [76–192], Method: 27 ml·min–1 [–125 to 179], Interaction: 82 ml·min–1 [–25 to 189]). There was no correlation between changes in absolute V̇O2peak and SCG eV̇O2peak (r = 0.10, p = 0.402).
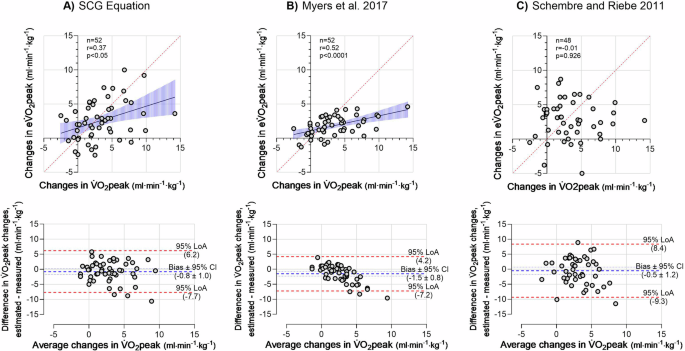
A V̇O2peak estimated with the SCG equation. B V̇O2peak estimated with the Myers et al. 2017 equation [22]. C V̇O2peak estimated with the Schembre and Riebe 2011 equation [20]. V̇O2peak peak oxygen consumption; eV̇O2peak estimated V̇O2peak; SCG seismocardiography; LoA limits of agreement; CI confidence interval. n = 52.
Performance of the eV̇O2peak Equations
At baseline, 81% of all participants were categorized into the correct V̇O2peak tertile group with SCG eV̇O2peak showing a substantial agreement between methods (Table 3). For the equation by Myers et al., there was a moderate agreement with 72% correctly categorized, and for Schembre and Riebe there was no agreement with 15% correctly categorized (Table 3). The agreement for correct V̇O2peak categorizations at follow-up was moderate (73%), fair (58%), and slight (25%) for SCG, Myers et al., and Schembre and Riebe, respectively (Table 3). Nine participants changed the V̇O2peak tertile group, six from “lower” to “mean” and three from “mean” to “higher”. The SCG V̇O2peak estimation equation correctly estimated seven of these nine participants with group changes (five “lower” to “mean” and two “mean” to “higher”), and Myers et al. correctly estimated three from “lower” to “mean” and Schembre and Riebe one from “mean” to “higher”.
Discussion
This study provides novel insight into the accuracy and applicability of eV̇O2peak at rest using the SCG method before and after a lifestyle intervention in a healthy population with overweight and obesity. The SCG eV̇O2peak is accurate in determining V̇O2peak on a group level, although a considerable 95% LoA is present, and it can detect V̇O2peak changes following a lifestyle intervention. Compared with the eV̇O2peak by the equations by Myers et al. and Schembre and Riebe the authors consider the SCG V̇O2peak estimation equation to be superior.
Agreement in V̇O2peak estimation
What is a good and acceptable method agreement for V̇O2peak determination? A degree of error of more than one metabolic equivalent (1 MET ~ 3.5 ml·min–1·kg–1) could impact risk classification and treatment, as one MET improvement reduces mortality [1, 26]. However, obtaining an estimation error within 3.5 ml·min-1·kg-1 is a tough criterion when considering the intra-individual variation within the gold standard measure, typically is reported around 5% [27]. A recent study has cross-validated 28 N-Ex V̇O2peak estimation equations within a single cohort (n = 2529) to determine which equations were the most accurate [9]. All equations showed significant correlations with R2 ranging between 0.25 to 0.70 and SEE between 4.1 and 6.2 ml·min–1·kg–1 [9]. Interestingly, eV̇O2peak was significantly different from V̇O2peak in 27 out of the 28 equations with LoA ranging between ±10.4 and ±15.4 ml·min–1·kg–1 [9]. This certainly addresses the limitations when using V̇O2peak estimation equations. In addition, an unfortunate and further limitation of V̇O2peak estimation equations is a weaker agreement among individuals with lower V̇O2peak, where the associated risk of mortality is higher. This is supported by the finding that only 47% of the participants were correctly classified into the lowest tertile on average for the 28 equations [9]. In comparison to both the performance in the abovementioned cross-validation and the application of two of these equations within this study, the agreement of the SCG eV̇O2peak is better based on an R2 of 0.61, SEE of 5.0 ml·min-1·kg-1, no difference between methods, LoA ranging 9.8 ml·min–1·kg–1, and 81% of the participants correctly classified into V̇O2peak groups with a Cohen’s κ of 0.62. V̇O2peak estimation equations that include physical activity are often performing better, due to physical activity being a major modifiable contributor to changes in V̇O2peak [1]. However, the equation by Schembre and Riebe largely overestimated V̇O2peak in the present study, clearly emphasizing the limitation of self-reported physical activity [28], which is perhaps also more pronounced in individuals with body mass index >25 kg·m–2 [29]. Objectively measured physical activity is preferred compared to self-reported, but it also limits the onsite applicability of eV̇O2peak. The SCG provides a measure of resting intrinsic cardiac performance with onsite applicability. Compared with the Myers et al. equation, the SCG equation only showed a slightly better agreement and correct V̇O2peak group categorization, which was attributed to better performance in individuals with higher V̇O2peak values. This could indicate that the SCG can capture some of the variation in V̇O2peak that is not explained by age, sex, and weight. Together, these results favor the application of the SCG eV̇O2peak for the determination of V̇O2peak in a healthy population with overweight and obesity when the gold standard method is not feasible.
Detection of change in V̇O2peak
V̇O2peak equations that estimate group changes accurately can be useful in a research setting, however, applicability within the clinical setting requires accurate estimation of the individual changes [9]. V̇O2peak estimation equations without physical activity in general have a poor ability to detect changes over a “short” time, due to age and anthropometry normally remaining relatively unchanged. This is not surprising given the importance of physical activity for changes in V̇O2peak [1], which, widely accepted, is due to central adaptation through a change in cardiac output (i.e. change in stroke volume contributed by a change in the diastolic filling, Frank-Starling Law). In this study, an average reduction in body mass was present, which together with age (seven participants chronologically aged one year) allowed the equation by Myers et al. to detect a change in eV̇O2peak. However, when eV̇O2peak was expressed as an absolute eV̇O2peak, no difference was observed with the Myers et al. equation, whereas absolute eV̇O2peak still increased with the SCG equation, even though body mass is also a factor within that equation. This variation can either be attributed to the added SCG within the equation or because the body mass does not have the same weighting within the equation. It is, therefore, difficult to explain what is driving this observed discrepancy. The fact that there was no correlation between changes in absolute SCG eV̇O2peak and V̇O2peak indicates that the SCG method is not sensitive enough to detect actual changes in V̇O2peak independently of body weight following the intervention and that the demographic components in the model still contribute to a great extent. For the Schembre and Riebe equation, body mass is not integrated and the reported vigorous physical activity, therefore, drives the improved eV̇O2peak. However, there was no correlation in V̇O2peak changes, no agreement in classifying the correct V̇O2peak category, and no improvement when expressed in absolute eV̇O2peak thereby indicating a poor agreement in detecting the individual changes and group changes independently of a body mass change. The SCG V̇O2peak equation performed better in detecting the change between the “lower”, “mean”, and “higher” V̇O2peak categories than the other equations, emphasizing better agreement with this method.
Perspectives
The present findings support the use of the SCG eV̇O2peak when conducting both cross-sectional and longitudinal studies in large cohorts with body mass index >25 kg·m-2, where the gold standard directly measured V̇O2peak is not possible. The SCG methodology would be interesting to evaluate in a population with heart disease, where the cardiac function is limiting V̇O2peak, and thus other N-Ex V̇O2peak estimation equations are not appropriate.
Limitations
The explorative nature of the study has limitations, however, it provides a foundation for more controlled and conclusive studies in the future. A limitation is the lack of control for hydration status and subcutaneous tissue thickness, which might be interfering factors in the assessment of V̇O2peak with the methods. The lack of SCG information when performing the estimation is a profound limitation and limits the possibility of assessing the actual influence of the SCG in the V̇O2peak equation in this cohort. The relatively large number of missed participants at follow-up (22%) is a limitation. Another limitation is the use of the equation by Schembre and Reibe, but there are no other N-Ex V̇O2peak estimation equations available that use IPAQ estimated PA and have a good overall agreement. Finally, the researchers were not blinded by the SCG eV̇O2peak and this could potentially influence how the V̇O2peak test was conducted. However, the criteria of the V̇O2peak test were assessed, and an equal distribution of data around the line of identity would suggest that a fair V̇O2peak assessment has been performed.
Conclusion
The SCG equation is accurate for the estimation of V̇O2peak in a healthy population with overweight and obesity, and the method is appropriate for detecting group changes in both relative and absolute V̇O2peak following a 14-week lifestyle intervention. Furthermore, the method is able to detect individual changes in V̇O2peak but not independently of body mass changes. Yet, the applicability is still limited by the relatively large variation in LoA and SEE.

Responses