Coevolution between marine Aeromonas and phages reveals temporal trade-off patterns of phage resistance and host population fitness
Introduction
Marine microbes are the most diverse organisms, driving nutrient cycling and influencing ecosystem function [1]. Diverse viruses potentially shape the diversity of bacterial communities, which are key players in shaping the evolution and ecology of marine ecosystems [2]. A phage, a bacterial virus, serves as a tractable biological model to study host-symbiont dynamics in microbial communities [3]. Bacteria-phage coevolution is a highly dynamic process of a mutual selection between infection and resistance, resulting in genetic differentiation and maintenance of biodiversity [4]. Overall, bacteria-phage interactions are important in shaping the diversity, stability, and function of microbial communities.
To understand bacterial population dynamics, experimental evolutionary models are used to investigate how environmental and genetic features shape bacteria-phage interactions in nature [5]. Bacterial phenotypic and genotypic variations were observed in many experimental coevolutionary studies. Bacteria resisted phages by altering their surface structures such as lipopolysaccharide (LPS), extracellular polymeric substance (EPS), and flagella [6]. The bacteria displayed decreased adaptations such as virulence, growth rate, and fitness [7, 8]. Meaghan et al. found that phage-resistant bacteria had reduced growth rates, virulence, and biofilms during a 12-day coevolution of Pseudomonas aeruginosa and its phage [7]. Fernando et al. revealed that the phage-resistant Acinetobacter baumannii were re-sensitized to human complement and beta-lactam antibiotics and exhibited diminished fitness in vivo due to changes in capsular polysaccharides [9]. The resistance costs, including reduced virulence and increased antibiotic susceptibility, contributed to phage therapy and the alleviation of pathogen damage to humans and livestock [10, 11]. In short, these evolution-induced mutations have many inescapable consequences, including costs of phage resistance, change in mutation rate, altered bacteria social behavior, and niche competition [12,13,14,15].
Bacteria have evolved multiple complex defense systems, such as the clustered regularly interspaced short palindromic repeats (CRISPR)/Cas system and the cyclic-oligonucleotide-based anti-phage signaling (CBASS) system, to resist phages without adsorption inhibition during long-term coevolution in nature [16, 17]. In marine ecosystems, some signal-sensing systems, such as quorum sensing, also influence phage infection and lysogenic decisions by enabling them to recognize complex signals from the environment [18,19,20]. However, phages have evolved several anti-defense systems such as hydroxymethylcytosine modification, internal protein I, and antirestriction protein [16]. Both bacterial and viral defenses were influenced by evolutionary dynamics via genomic alterations or mobile genetic elements [21]. In the ecosystem, coevolution between bacteria and phage is influenced by multiple factors including bacterial communities and environmental signals, ultimately leading to diversity in the phage host range [22]. In short, the phage resistance diversity resulted from phage competition and was impacted by multiple drivers in ecology.
There is a basic consensus that bacteria-phage coevolution is a selection between infection and resistance, which was described as arms race and fluctuating selection dynamics [23]. In terms of bacteria, various genes drive phage resistance evolution and result in a cost of resistance [6,7,8]. However, there was limited understanding of how much different genes contributed to phage resistance and how the resistance costs changed dynamically. We hypothesized that at the early stages of coevolution, phage resistance was derived by different types of genes, while low-cost mutations gradually dominated subsequently and a steady state developed. In a previous study, the Myoviridae phage was isolated to infect the common marine pathogen Aeromonas salmonicida, but bacteria gradually developed resistance to the phage several days after infection [24]. In this study, focusing on marine ecosystems, we intended to explore what were different phage resistance patterns and how they drove adaptive changes in bacteria on time scales. To address these questions, marine Aeromonas was co-cultured with its phages for 180 days. We identified three types of phage resistance genes and found that two-component system (TCS) mutants incompletely resisted phages by inhibiting phage gene transcription. The mutation frequency and fitness were measured every 30 days to track the dynamics of phenotypic and genotypic processes in bacterial populations. Overall, tracking experimental evolution for an extended period revealed the temporal patterns of phage resistance and the dynamics of bacterial communities.
Materials and methods
Bacterial strains and bacteriophages
The WT and gene deletion strains used in this study are shown in Table S1 and the mutant strains are listed in Tables S3 and S5. All A. salmonicida strains were cultured in tryptic soy broth (TSB) medium with shaking at 22 °C for 24 h. E. coli strains were cultured in Lysogeny broth (LB) at 37 °C. When appropriate, the medium was supplemented with ampicillin (Amp, 100 μg/ml), chloramphenicol (Cm, 25 μg/ml), and kanamycin (Kan, 25 μg/ml). The phage vB_AsM_ZHF (ZHF) was isolated from the environment in the previous study and was hosted by A. salmonicida JNG [24]. The phage was amplified in the TSB medium containing 1% A. salmonicida JNG at 22 °C for 8 h. During coevolution, A. salmonicida was co-cultured in 2216E medium at 22 °C to simulate the marine environment.
Experimental coevolution design
We first performed experimental coevolution to identify the mutated genes (Fig. 1A), as previously described with modifications [8]. A single colony of A. salmonicida JNG and a single plaque of the phage ZHF were inoculated into the 2216E medium. The mixture was co-cultured with shaking at 22 °C and transferred to a new medium every day. Samples were taken on day 90 after co-culture for isolation of phage-resistant bacteria and SNP analysis.

A Flowchart for screening phage resistance genes. A. salmonicida JNG and phage ZHF were co-cultured in 2216E medium at 22°C and inoculated daily into fresh medium for 90 days. The colonies of the phage resistance strains were isolated on the plate. The mutant genes were screened through whole genome re-sequencing (WGRS). B The efficiency of plating (EOP) on mutant gene deletion strains. Each point represents an independent replicate, and the short line represents the mean (n = 3). The long line represents the wild-type (WT) strain as a control. ND means no plaque was detected. Student’s t-test was used to determine the statistical significance compared to the WT strain (**p ≤ 0.01). C Mutated genes are classified into three categories based on their function. The shortening, mutation, and insertion of proteins are labeled on the graph. Red represents PS synthase, green represents OMP, and blue represents TCS proteins.
A longer experimental coevolution was performed with some modifications (Fig. 3A). A single bacterial colony and a single phage plaque were inoculated into 2216E medium and cultured with shaking at 22 °C. Coevolutionary cultures were replicated in triplicate and transferred into fresh 2216E medium daily. At each transfer, three cultures were mixed in equal proportions and the mixture was inoculated at 1% into the medium with three replicates. The WT bacteria and phages (107 CFU or PFU) were added to the culture broth to mimic the dominant ecological niche. The coevolution lasted for 180 days, and samples were taken every 30 days for subsequent experiments.
Isolation of phage-resistant bacteria and evolved phage with phage sensitivity assays
Sampled co-cultures were centrifuged at 8000 × g for 5 min and resuspended in phosphate-buffered saline (PBS). This process was repeated three times. The supernatant was collected and filtered using 0.22 μm nitrocellulose membranes. The supernatant was then stored at 4 °C for isolation of the evolved phages. The single colony isolation was screened through the plate streaking method using the resuspensions. One hundred colonies were randomly picked and inoculated in TSB medium at 22 °C overnight. The spot test was used to determine the phage sensitivity of the bacteria and discarded the strains without phage resistance [25]. Fifty phage-resistant strains were randomly selected at each sampling time for subsequent experiments.
Co-culture filtrate on day 90 of the initial coevolution experiment was used for the isolation of evolved phages. Evolved phages were isolated with MB 1-19 as hosts using the double-layer agar plate method [26]. Plaques were picked into PBS and the phage strains were purified on a double-layer agar plate three times. The spot test was used to determine the infectivity of evolved phages against MB 1-19 [25]. Five evolved phages (RP 1-5) with different host ranges were selected for subsequent experiments.
Whole genome re-sequencing and SNP analysis
Bacterial and phage DNA was extracted from pure cultures using the TIANamp Bacteria DNA Kit and TIANamp Virus DNA/RNA Kit (Tiangen, Beijing, China), respectively. Sequencing libraries were constructed using the TruSeq DNA sample preparation kit (Illumina, San Diego, CA, USA). Paired-end sequencing was carried out using the NovaSeq platform (Illumina). SNPs and insertion-deletions (InDels) were detected and annotated with GATK [27] and ANNOVAR [28]. SNPs were identified at a minimum variant frequency of 90% and minimum coverage of 50. Bacterial genes were also annotated using the virulence factor database (VFDB) [29]. The genomes of A. salmonicida JNG (CP122987-CP122989) and phage ZHF (MW584871) served as reference genomes for the mutant bacteria and phages, respectively.
Construction of deletion strains
A. salmonicida JNG was used to construct the deletion strains, which were constructed using sacB-based allelic exchange vectors, as described previously [30]. We first amplified the upstream and downstream fragments of the deletions through PCR. Next, the suicide vector pDMK was linearized with XbaI. Both upstream and downstream fragments were ligated to the linearized vector and transferred to SM10 λpir. The plasmid was then transferred from SM10 to A. salmonicida JNG by conjugation. The single crossover strains were screened on the TSA plate containing Amp and Cm. The strains were then cultured in a TSB medium containing 12% (w/v) L-sucrose to screen for the double crossover strains. The deletion mutants were then verified by PCR. The primers are shown in Table S2.
Phage titer and efficiency of plating
The EOP was measured as described previously [31]. Phages were diluted in a 10-fold gradient using Super Micro buffer (SM buffer: 200 mM NaCl, 16 mM MgSO4, 0.1 M Tris-HCl, and 0.02% gelatin, pH 7.5). Phage titers were determined with different bacteria as hosts using a double-layer plate method [26]. Each group was performed in triplicate. The WT strain served as a control. EOP was calculated as follows: EOP = phage titer on gene deletion strain/phage titer on control strain.
Determination of mutation frequency
Fifty phage-resistant bacteria sampled at each time were used to calculate the gene mutation frequency. Mutations in 11 phage resistance genes were determined by PCR using primers labeled as ‘gene_OUT-F/R’ (Table S2). Gene mutations were identified through alignment with genes of the WT stains. The mutation frequency of a gene was calculated as the number of clones with mutations in this gene divided by the total number of clones. The mutation frequency of a type of gene was calculated as the number of clones with mutations in either one or more genes of this type divided by the total number of clones.
Growth rate measurement
Bacteria were activated on TSA plates and inoculated into a TSB medium. Bacteria were diluted to 109 CFU/ml with PBS and inoculated at 1% into 200 μl TSB medium in well plates and cultured with shaking at 22 °C for 72 h. The OD600 was monitored every 30 min using a Bioscreen plate reader (Bioscreen C; OY Growth Curves, Turku, Finland). Each treatment was performed in triplicate.
Bacterial virulence assays
The turbot mortality challenge by the bacteria was used to determine bacterial virulence and the challenge experiment was performed as described previously [24]. In brief, turbot (35.0 ± 5.0 g) were purchased from a farm (Tianyuan, China) and placed in the aquaculture system at 16 to 18 °C without feed for a week. The water was exchanged with fresh seawater every 2 days. Each turbot was challenged with bacteria at a dose of 105 CFU/fish by intramuscular (i.m.) injection. For the virulence of the bacterial population, the 50 strains isolated at each time point were mixed in equal amounts (dose of 2 × 10³ CFU/fish per strain) and the mixture was injected into the turbot. Each group consisted of 30 turbot and the mortality was calculated daily.
Competition experiments
Competition experiments between the WT and deletion strains were performed as described previously with modification [32]. The vector pDMK deleting the kanamycin resistance gene or chloramphenicol resistance gene was transferred into the WT or deletion strains respectively by conjugation. The WT and deletion strains were simultaneously inoculated at 1% into 2216E medium and incubated for 24 h at 22 °C. Next, the initial bacteria (C0) and co-incubated bacteria (Ct) were both counted on the plate. The bacterial culture was centrifuged at 8000 × g for 5 min and resuspended in PBS. This process was repeated three times. The resuspension was then diluted with PBS in a 10-fold gradient. The WT or deletion strains were plated on TSA containing Cm or Kan, respectively, and the number of colonies was counted after 48 h of cultivation. Each group was performed in triplicate. The relative fitness (W) was calculated as follows: W = [In (Ct-del / C0-del)] / [In (Ct-WT / C0-WT)], where Ct-WT and C0-WT were the initial and incubated CFUs of the WT strains respectively, and where Ct-del and C0-del were the initial and incubated CFUs of the deletion strains respectively.
Phage adsorption assays
The phage adsorption efficiency was measured similarly to those in previous studies [20]. The bacteria were diluted to 1 × 10⁸ CFU/ml with PBS. The phage was added at a concentration of 1 × 10⁴ CFU/ml and incubated with shaking at 28 °C for 20 min. The mixture was then centrifuged at 8000 × g and the phage titer of the supernatant was determined by the double-layer agar method. Each group was performed in triplicate. The phage adsorption efficiency was calculated as follows: Adsorbed phage (%) = [(initial phage titer – phage titer in the supernatant)/(initial phage titer)] × 100.
Transcriptome sequencing
The WT strain, ΔafpR, ΔbfmS1, and ΔbfmS2 were active on TSA and cultured in TSB at 22 °C for 12 h. The total RNA was extracted using the RNAprep Pure Bacteria Kit (Tiangen, Beijing, China) according to the manufacturer’s instructions. The bacterial rRNA was removed from the extracted RNA using the Ribo-Zero rRNA Removal Kit (Epicentre, Biotechnologies, Madison, WI, USA). The RNA-seq libraries were constructed using the VAHTS Stranded mRNA-seq Library Prep Kit for Illumina (Vazyme, Nanjing, China) and sequenced on an Illumina NovaSeq platform. The RNA-seq of each strain was performed in triplicate. The genome of A. salmonicida JNG (CP122987-CP122989) served as a reference genome. The raw data was filtered and analyzed as described previously [33]. Differentially expressed genes (DEGs) were identified using DESeq with |log2FoldChange | > 1 and false discovery rate (FDR) < 0.05 and the WT strain served as a control group. GO term enrichment and KEGG functional enrichment were analyzed by Blast2GO and KO-Based Annotation System (KOBAS) software [34, 35].
Real-time qPCR
Phage ZHF infected the WT strain, ΔafpR, ΔbfmS1, and ΔbfmS2 separately at an MOI of 0.1. The culture was then centrifuged at 8000 × g for 5 min and resuspended in PBS. This process was repeated three times. Next, the total RNA was extracted using the RNAprep Pure Bacteria Kit (Tiangen, Beijing, China) according to the manufacturer’s instructions. The gDNA was removed and the cDNA was then synthesized using the FastQuant RT Kit (Tiangen, Beijing, China). The transcription level was measured with the MonAmp Taqman qPCR Mix (Monad, Suzhou, China) using the ABI 7500 Real-Time Detection System (Applied Biosystems, Waltham, MA, USA). The qPCR value of target genes was normalized to the gene gyrB. The relative fold change was calculated as the normalized value of the uninfected group minus that of the deletion strain. The primers used for qPCR are listed in Table S2. Each group was performed in triplicate.
Statistical analysis
Figure generation and statistical analyses were performed with GraphPad Prism 9.0. The volcano plot was done in R (version 4.0.2) using the package ‘ggplot2’. DEGs in the volcano plot were identified |log2FoldChange | > 1 and FDR < 0.05. For real-time qPCR, Student’s t-test was used to determine the statistical significance of relative fold change between deletion strain and WT strain (*p ≤ 0.05 and **p ≤ 0.01). For bacterial virulence, the statistical significance of the survival curves was determined using a log-rank (Mantel-Cox) test (*p ≤ 0.05 and **p ≤ 0.01). For the other tests, a statistical comparison of mean values between two specific groups was carried out using the Student’s t-test. Replicates and statistical details can also be found in the methods and figure legends. The schematic diagram was created with BioRender.
Results
Mutations in LPS, OMP, and TCS genes promoted phage resistance
To investigate how bacteria resist phages, bacteria were first co-cultured with phages for 90 days and various phage-resistant mutants were isolated on the plate (Fig. 1A). Different single nucleotide polymorphisms (SNPs) were identified through whole genome re-sequencing (WGRS) analysis and are listed in Table S3. To determine the mutations causing phage resistance, gene deletion strains were constructed and the efficiency of plating (EOP) was measured. Eleven deletion strains were significantly reduced in EOP, indicating that these genes were associated with phage resistance (Fig. 1B). The deletion of genes 02065, 03190, 08275, and 12440 decreased the EOP by 1-2 orders of magnitude, considered to be incomplete resistance, while the other seven gene deletion strains were completely uninfectable by the phage.
To explore how mutations in these genes cause phage resistance, these genes were classified into three functional clusters: extracellular polysaccharide synthesis, outer membrane protein (OMP), and two-component system (TCS). Many of these genes were associated with bacterial virulence and their annotation in the Virulence Factor Database (VFDB) is listed in Table S4. These three protein types varied in different ways, including mutations, insertions, and deletions (Fig. 1C). In summary, the 11 phage resistance genes were identified and divided into three groups, where deletion of the TCS gene resulted in incomplete resistance, and deletion of the LPS and OMP genes mostly resulted in complete resistance.
LPS shortening and OMP mutations in bacteria were different patterns leading to complete phage resistance
In a previous study, mutations in the LPS and OMP genes inhibited phage adsorption leading to complete phage resistance [36, 37], similar to our results (Figure S1A and B). To explore the differences between them, we isolated various evolved phages from co-cultures and tested their sensitivity to phage-resistant bacteria. Five evolved phages showed different host ranges and SNPs in tail protein (Table S5).
In the cluster of the LPS, WaaQ, WaaF, and GalU were glycosyltransferases for the synthesis of LPS and their mutations shorten the LPS by different lengths [38,39,40,41]. Phage RP1 was able to infect the WaaQ mutants, but not the WaaF mutants, while both were infectable by phage RP2 (Fig. 2A). Bacteria may preferentially shorten fewer polysaccharides to resist phages through WaaQ mutations. When phage RP1 evolved to infect WaaQ mutants, the bacteria shortened more polysaccharides by WaaF mutations to further prevent phage infection (Fig. 2B). The results revealed that for the LPS genes, bacteria increasingly shorten the polysaccharides to resist WT and co-evolved phages without altering the sugar structure, leading to complete phage resistance.

A Host sensitivity of the evolved phages RP1 and RP2 against the LPS mutants (MB 1-5) and deletion strains (ΔwaaQ, ΔwaaF, and ΔgalU). B Bacteria resisted the wild-type (WT) and evolved phage through LPS shortening. WT phage (red) can infect WT bacteria but not ΔwaaQ with a shortened sugar chain. WT phage evolved to phage RP1 (blue) to infect ΔwaaQ, while the bacteria mutated their waaF, leading to a further shortened sugar chain to resist RP1. Phages further evolved into RP2 (green) to infect ΔwaaF. No evolved phages infecting ΔgalU have been isolated. C Host sensitivity of evolved phages RP3, RP4, and RP5 against OMP mutants (MB 6-10) and deletion strains (ΔagcP, ΔexeE, ΔT2SS, and ΔrrtA). D Bacteria resist different phages by varying their AgcP mutations. The precursors of AgcP (pre-AgcP) were processed by RrtA and secreted to the cell surface by the type II secretion system (T2SS). WT phages (red) adsorbed to AgcP for infection but not to mutant AgcP. MB6 and MB7 with different mutations were infectable by RP3 (blue) and RP4 (green), respectively. E The relative transcription level of phage ZHF and prophage gene when phage ZHF infect WT bacteria, ΔafpR, ΔbmfS1, and ΔbmfS2 for 2 h. The significant differences are shown in Figure S8. WT bacteria served as a control group for normalization. F Schematic diagram of the TCS regulating incomplete phage resistance. The deletion of afpR, bmfS1, bmfS2 down-regulated the expression of prophage and phage genes, resulting in a decrease in progeny phages.
In the cluster of the OMP, the product of gene 11270 was DUF3466 family protein containing a GlyGly-CTERM domain (named Aeromonas GlyGly-CTERM-containing Proteins [AgcP]) (Figure S2A). The AgcP was predicted to be outside the membrane (Figures S2B and C). Phages RP3 and RP4 were able to infect MB6 and MB7, respectively, but not the other OMP mutants including the ΔagcP (Fig. 2C). Mutations in AgcP of MB6 and MB7 may alter the protein properties of the adsorbed receptor, which determines whether the phage can infect. In addition, in previous studies, proteins containing the GlyGly-CTERM domain were expressed intracellularly, cleaved by rhombosortase at the inner membrane, and finally transported to the outer membrane by the type II secretion system (T2SS) [42, 43]. Mutations in the processing proteins (ExeE, T2SS, and RrtA) resulted in neither RP3, RP4 nor WT phages being infectable, presumably because no AgcP was available on the cell surface to be adsorbed (Fig. 2D). However, all OMP mutants were infectable by phage RP5, suggesting that phage RP5 had evolved to be independent of AgcP for infection. The results showed that diverse mutations in a single OMP gene provided adsorption receptors of multiple properties without deletion, leading to complete phage resistance.
In the cross-infectivity test, both RP1 and RP2 were infectious to all OMP mutants including MB 6-10 and OMP deletion strains, conversely, all LPS mutants including MB 1-5 and LPS deletion strains were unable to be infected by phage RP3-5 (Figure S4). The WT bacteria was sensitive to WT phage and RP 1-5, while the WT phage was only infectious to WT bacteria. The results imply that the LPS mutant is more resistant than the OMP mutant, while RP 1 and 2 have a wider host range, followed by RP 3-5. In summary, incrementally shortening of LPS and diverse mutations in OMP were different patterns leading to complete resistance to WT phage.
TCS mutants down-regulated phage transcription to reduce progeny phage
TCS mutant strains reduced the EOP of the phages but were still infectable, which is considered to be incomplete phage resistance. The titers of the phages amplified with the TCS deletion strains were significantly lower compared to that of the WT strain (Figure S3A). However, there was no significant difference in the phage adsorption efficiency, indicating that the TCS mutants did not resist phage by adsorption inhibition (Figure S3B). In the cluster of the TCS, the gene 08275 contained the F-box and intracellular signal transduction (FIST) domain. FIST is a new sensory input domain that transmits the signal to the next protein in the same operon [44, 45]. It is speculated that the products of 08275 are Aeromonas FIST-containing proteins that sense signals and transduce to PhoR (named AfpR) (Figure S2D). In addition, the products of genes 02065 and 12440 are both BfmS, belonging to the BfmR/BfmS TCS, and are distinguished as BfmS1 and BfmS2, respectively.
To explore how the three TCS deficient strains were incompletely resistant to phage, RNA-sequencing (RNA-seq) was used to measure the transcriptional differences between TCS deficient and WT strains. Gene Ontology (GO) enrichment and Kyoto Encyclopedia of Genes and Genomes (KEGG) enrichment results showed genes for viral processes were significantly down-regulated in ΔafpR, ΔbfmS1, and ΔbfmS2 (Figures S5 to 7). In fact, these genes were all sequential prophage genes in the bacterial genome. It was hypothesized that deletion of the TCS genes down-regulated the transcription of the phages and prophages, eventually leading to a reduction in progeny phages. We measured the transcription of some prophage and phage genes using RT-qPCR during phage infection of TCS deficient strains. The results showed that most genes were significantly down-regulated, indicating that gene expression of the phage was suppressed during infection (Fig. 2E and S8). Overall, the TCS mutants down-regulated phage transcription to reduce progeny phage, causing incomplete phage resistance (Fig. 2F).
Co-mutation in the LPS and OMP genes was a major mode of phage resistance during coevolution
To explore the dynamics of gene diversity, we designed an experimental coevolution with bacteria and phages for 6 months (Fig. 3A). The wild-type (WT) strain was added daily to simulate the dominant ecological niche. Co-cultures were sampled every 30 days and the mutation frequencies of the 11 resistance genes were monitored.
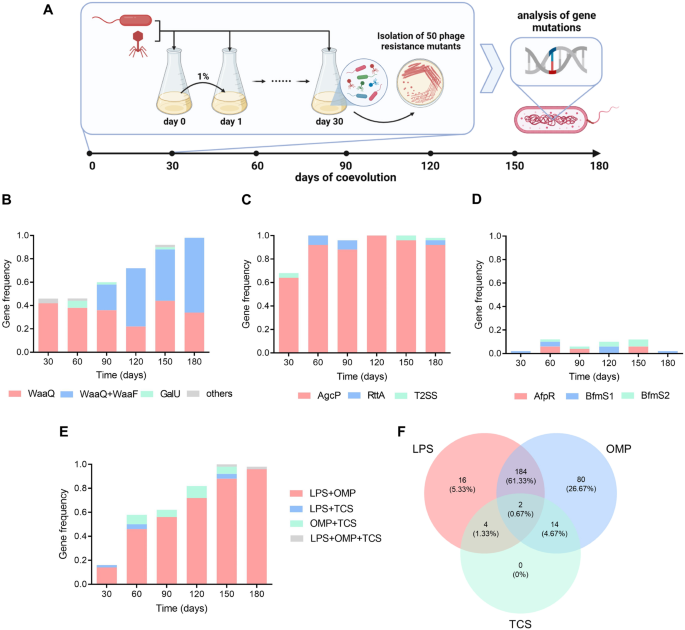
A Flowchart of the experimental coevolution and mutation analysis. Bacteria and phage were inoculated together into a 2216E medium and cultured with shaking at 22 °C. The mixture was inoculated at 1% into the fresh medium with the addition of wild-type (WT) bacteria and WT phage. The samples were taken every 30 days and 50 phage resistance mutants were isolated from each sample. Mutations in 11 resistance genes were determined by PCR. B–D Mutation frequency dynamics of a single gene belonging to lipopolysaccharide (LPS) B, outer membrane protein (OMP) C, and two-component system (TCS) D during coevolution. The color bars represent the mutation frequency of each phage resistance gene (n = 50). E The dynamics of multigene co-mutation in phage resistance mutants during coevolution. The color bars represent the mutation frequency of two or three types of genes (n = 50). F Venn diagram of mutation and co-mutation number in LPS, OMP, and TCS genes at six time points in total within 180 days (n = 300).
For LPS synthesis genes, the total mutation frequency increased gradually within 180 days (Fig. 3B). The genes waaQ and waaF were the dominant mutated genes, while galU, cpsJ, and pseB were mutated at less than 5% frequency. The gene waaQ was the first gene to be mutated, and the co-mutants of waaQ and waaF were detected from day 90, gradually becoming the major mutants over time. Additionally, no single mutant of waaF was detected. For the OMP, agcP mutants were the most common for 180 days among the three genes, while rrtA and exeE had less than a 10% mutation frequency (Fig. 3C). For the TCS, the total mutation frequency for the three genes was less than 12% at each time point, indicating that these mutants were not dominant during co-culture (Fig. 3D). Overall, during 180 days of coevolution, the mutation frequency of waaQ and waaF increased gradually and agcP mutants remained dominant, but mutation frequency of the TCS genes was consistently low.
To further understand the dynamics of multigene co-mutations, the co-mutants of the three gene types at each time point were recounted. The frequency of the co-mutations on day 30 was low (18%), and then gradually increased over time (Fig. 3E). Co-mutants in the LPS and OMP genes were most abundant within 180 days, followed by the agcP single mutants. In contrast, no TCS single mutant was obtained (Fig. 3F). In summary, the result showed that the co-mutation frequency of LPS and OMP increased gradually over time, which was the dominant mode of phage resistance in bacteria during evolution.
Low-cost mutations gradually dominated in phage-resistant bacterial populations during coevolution
To study the effects of these mutations on bacterial fitness, we measured the growth and virulence of phage-resistant mutants obtained during 180 days of coevolution. For bacterial growth, the growth rate of the bacterial population on day 30 was significantly lower than that of the WT strain, which was similar to its significantly lower growth rate on day 60 as compared to that on day 30 (Fig. 4A). However, no significant differences were found between the growth of the bacterial populations on days 90 to 180. For bacterial virulence, the virulence of bacterial populations that co-evolved for more than 60 days was significantly lower than that of the WT strain (Fig. 4B). No significant difference was seen between the virulence of the populations on days 90 to 180, but all were significantly higher than those on day 60. The result showed that both the growth and virulence of the bacterial populations declined gradually in the first 60 days, with insignificant changes thereafter (Fig. 4C).

A The growth of the phage-resistant bacteria population in tryptic soy broth (TSB) at each time point. Dorp represents the OD600 of the mutant strains at 72 h. The short line represents the mean OD600 (n = 50). Student’s t-test was used to determine the statistical significance (*p ≤ 0.05, **p ≤ 0.01). B The virulence of the phage-resistant bacteria population at each time point. Fifty mutant strains at each time point were mixed in equal amounts (dose of 2 × 10³ CFU/fish per strain and a total injection dose of 105 CFU/fish). The mixture was intramuscularly injected into the turbot (n = 30) and the mortality was counted within 7 days. Pairwise comparisons of the survival rate were determined using a log-rank (Mantel-Cox) test (*p ≤ 0.05 and **p ≤ 0.01). C Growth and virulence of phage-resistant mutant populations at each time point. Dorp represents the mean OD600 and mortality (n = 50). D Growth and virulence of phage resistance gene deletion strains. Growth and survival curves are shown in Figure S9. Dorp represents the mean of OD600 and mortality. The error bar represents the standard deviation of the OD600 at 72 h (n = 3). E Fitness of the phage resistance gene deletion strains relative to the wild-type (WT) strains. The dashed line represents the WT strain as a control. Each point is an individual bacterium (n = 6). The middle line represents the mean of each point. Student’s t-test was used to determine the statistical significance compared to the WT strain (*p ≤ 0.05, **p ≤ 0.01). Black represents the WT strain. Red represents the lipopolysaccharide (LPS) deletion strains. Green represents the outer membrane protein (OMP) deletion strains. Blue represents the two-component system (TCS) deletion strains.
The growth and virulence of the deletion strains were measured to evaluate the contribution of different genes (Fig. 4D and S9). Deletions of the waaQ, waaF, and agcP genes, the high mutation frequency seen during co-evolution, had a less negative impact on growth and virulence. The TCS deletion strains, ΔexeE, ΔT2SS, and ΔrrtA showed different levels of virulence with some reduction in growth. ΔgalU showed a dramatic decrease in growth and virulence. The competition experiments showed that ΔgalU, ΔrrtA, ΔafpR, ΔbfmS1, and ΔbfmS2 had significantly reduced competitiveness compared to the WT strain, showing a great cost of phage resistance (Fig. 4E). The results implied that mutations in phage resistance genes lead to varying reductions in growth and virulence and genes with less costly mutation are more likely to be retained during co-evolution.
Additionally, the RNA-seq of TCS deletion strains showed significant differences in aerobic metabolism (including TCA cycle, oxidative phosphorylation, and glycolysis), type III secretion system (T3SS), and iron transport system (Figures S5 to 7). An altered aerobic metabolism probably reduced the bacterial growth of the three TCS deficient strains (Figure S9C). The up-regulated expression of the iron transporter system in ΔafpR and ΔbfmS2 resulted in a significant reduction in their growth in iron-deficient media. (Figure S10). The down-regulated expression of the T3SS in ΔafpR and ΔbfmS2 led to significantly lower virulence than that of the WT strain (Figures S9F and S11). In summary, bacteria endured different costs to resist phages through genetic mutations, including reductions in growth, virulence, and competitiveness, which low-cost mutations gradually accumulated in the population with co-evolution.
Discussion
In marine microbial ecology, interactions between phages and their bacterial hosts drive the diversity of microbial communities. Bacteria resist evolving phages through various mutations over time. In this study, we designed a bacteria-phage coevolution experiment for 6 months to investigate phage resistance patterns and dynamic trade-offs (Fig. 5). The result showed mutations in the LPS genes (waaQ and waaF) and OMP gene (agcP) accumulated over time, and are two different patterns leading to complete phage resistance (Figs. 2B, D, and 3D). In addition, mutations in the TCS gene provide incomplete phage resistance by down-regulating the transcription of phage genes but do not enrich during coevolution (Figs. 2F and 3D). The virulence and growth of the bacterial populations gradually declined during coevolution, which was the resistance cost caused by mutations in some genes (Fig. 4). Taken together, our findings revealed different modes of phage resistance on a time scale and their fitness trade-offs during coevolution.
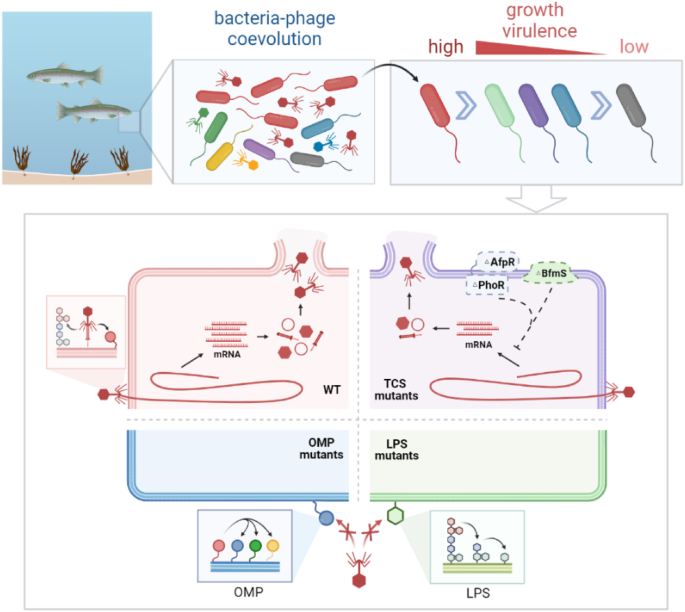
In marine ecosystems, the coevolution of bacteria and phages drives bacterial community diversity. During experimental coevolution, marine Aeromonas gradually evolved to resist phages through mutations in the lipopolysaccharide (LPS), outer membrane protein (OMP), and two-component system (TCS) genes, along with reduced growth and virulence. Phages adsorb to the LPS and OMP of wild-type (WT) bacteria (red) for infection. The TCS mutated strains (purple) inhibited the transcription of the phage gene, resulting in reduced progeny phages and incomplete phage resistance. LPS shortening (green) and OMP mutations (blue) led to complete phage resistance, which was the dominant variation during coevolution.
LPS and OMP are two common types of phage adsorption receptors, and their deletion provides complete resistance to phage infection. For the LPS, due to the difficulty of changing the chemical structure of monosaccharides, bacteria had to alter the length of their polysaccharides by mutating the glycosyltransferases to prevent phage adsorption (Fig. 2B). For the OMP, bacteria prevent phage adsorption through multisite mutations in the receptor, which is a convenient and low-cost strategy for bacteria to resist multiple evolved phages (Fig. 2D). Phage resistance from gene mutations would come at some cost, which probably determined whether these genes could be enriched in co-evolutionary. The growth and virulence of ΔwaaQ, ΔwaaF, and ΔagcP were minimally reduced, thus they were greatly enriched at minimal cost during coevolution (Figs. 3B, C and 4D). On the contrary, ΔgalU, ΔrrtA, and three TCS deletion strains showed a significant decline in competitiveness, which resulted in the failure to enrich during coevolution (Fig. 4E). GalU was a glycosyltransferase that regulated the LPS synthesis [40], and its deficiency significantly reduced growth and virulence (Fig. 4D). RrtA processed some proteins that were secreted through the T2SS [42], and its deficiency may alter T2SS regulation thereby affecting bacterial virulence. Although GalU mutants were the most resistant to phages among the three LPS genes (Fig. 2B), the mutation was not retained during coevolution probably because its resistance cost was too high. RrtA and ExeE mutants did not dominate during coevolution probably for similar reasons. It is speculated that a decline in fitness leads to a competitive disadvantage between bacteria even when resistant to phages, and minimally competitive bacteria were gradually phased out during coevolution.
For incomplete phage resistance, the effect of the TCS has been scarcely reported previously. Xuan et al. found that a mutation in RetS and GacS increased and decreased phage resistance, respectively, which demonstrated an association between the GacS/GacA TCS and phage resistance [46]. For the first time, our study found that TCS deficient strains reduced progeny phage by down-regulating phage transcription, leading to incomplete phage resistance (Fig. 2F). It was hypothesized that deletion of the TCS gene decreased the binding of RNA polymerase to the phage promoter, resulting in reduced transcription. Alternatively, regulatory proteins on the phage genome may bind to TCS effectors, leading to the repressed transcription of phage genes [47, 48]. In addition, our results showed that AfpR and BmfS2 responded to iron ions (Figure S10), speculating that environmental signals may regulate phage resistance along with altering bacterial fitness. It is of great significance to further explore the signaling pathway by which the TCS senses environmental signals and regulates phage gene transcription. Due to the importance of TCS in bacterial regulation, the deletion of TCS genes also had a negative impact on bacterial growth and virulence (Fig. 4D and S9-11). TCS mutants showed a lower survival advantage because of incomplete resistance to phage and additional resistance cost, resulting in low mutation frequency in this coevolution system (Fig. 3D). This study was conducted without any other evolutionary pressures, while the marine ecosystem was a more complex environment containing natural microbial community and environmental signals. We hypothesized that the introduction of other microbiomes would cause bacteria to evolve more competitively, and the addition of environmental signals probably caused phages to retain more TCS mutations, which required more experimental evidence.
In terms of bacterial populations, a previous study showed that during 400 generations of evolution, co-evolved bacteria had significantly lower fitness than bacteria that evolved without phages but were not significantly different from WT strains [8]. Other studies have shown significant reductions in the growth and virulence of bacterial populations that co-evolved with phages compared with ancestral bacteria [6, 7]. In this study, growth and virulence declined significantly during the first 60 days of coevolution, which were considered the costs of resistance (Fig. 4A–C). Phages in co-cultures were considered absolute predators, rendering non-resistant bacteria completely unviable. For survival, bacteria reduced their fitness to resist phages, which was considered an acceptable cost in the early stages of coevolution. Such evolution was consistent with arms race dynamics (ARD) which was driven by directional selection and favored the increased phage host range [49]. Subsequently, bacteria with a competitive advantage enriched in co-cultures when the bacteria were mostly resistant to the phage. Unless phages evolve, bacteria will resist them at a minimal cost. However, phages evolve at a slower rate than bacteria during coevolution [50], so bacteria may have enough time to recover their competitiveness. In this study, the virulence and growth of the bacterial population trend to be stable during days 90 to 180 (Fig. 4A–C). We hypothesized that this was consistent with fluctuating selection dynamics (FSD) which was considered evolution with no directional change and favored for stability [49]. It was suggested that ARD dominates in the initial stages of co-evolution, while FDS is more important in later stages [51], which was similar to this study. However, the introduction of new changes, such as evolved phages, other microbiomes, or environmental signals, may lead to a shift in the system from FDS to ARD, because bacteria tend to adapt to these changes. For example, once the phage evolves to infect resistant bacteria, the bacteria must mutate to survive whatever the cost. In short, bacteria had to resist phages as a priority for survival, while secondarily enhancing their competitiveness towards a dominant stable state.
In conclusion, the dynamics of bacterial mutations and resistance costs were monitored during the experimental coevolution. Our results found that trade-offs between phage resistance and fitness resulted in the dominant pattern of co-mutations in the LPS and OMP during coevolution. We first found that TCS deficient strains resisted phage incompletely by down-regulating phage gene transcription. Bacterial populations resisted phages at the cost of reduced growth and virulence, and low-cost mutations became dominant with coevolution. Our work revealed the dynamics of the bacteria community in resistance to phages, as well as their fitness trade-offs and resistance patterns during the coevolution of marine bacteria and phages.


Responses