Implications of lymphocyte kinetics after chimeric antigen receptor T cell therapy for multiple myeloma
To the Editor
Therapy for relapsed and refractory multiple myeloma (RRMM) has been revolutionized with the availability of chimeric antigen receptor T cell therapy (CAR-T) [1,2,3,4,5,6]. Currently idecabtagene vicleucel (Ide-Cel) [2, 3] and ciltacabtagene autoleucel (Cilta-cel) [4, 5], are approved by the Food and Drug Administration (FDA). Both products result in rapid and deep responses and improve overall survival in patients with RRMM. Lymphoid depletion (LD) chemotherapy prior to CAR-T administration results in profound lymphopenia that is often followed by a transient lymphocyte expansion. CAR-T cell expansion is associated with a response although it is currently not possible to directly monitor this in clinical practice. However a transient increase in the lymphocyte count is often seen after CAR-T infusion [7]. We have studied the kinetics of lymphocyte recovery during the first 4 weeks after CAR-T infusion and determined the impact of lymphocyte expansion on short and long term outcomes in RRMM.
We identified a cohort of 134 patients: 61 treated with Ide-cel and 73 who received Cilta-cel for their RRMM after the respective product was FDA approved. Their baseline demographic, clinical and laboratory characteristics before the start of LD chemotherapy are summarized in Table 1. Most patients had received at least 4 prior lines of therapy, many had high risk disease and 23.3% had extramedullary multiple myeloma (EMD). Additional details on methodology are provided in the Supplementary Material.
Cytokine release syndrome (CRS) developed in 48 patients (78.7%) after Ide-cel, and in 36 (49.3%) after Cilta-cel with a median time to onset of 1.14 days and 5.78 days (p = 3.19 × 10⁻¹⁰) respectively. ICANS developed in nine patients (14.8%) after ide-cel and in 6 (8.2%) after Cilta-cel, at a median of 4.4 days after Ide-cel and 8.9 days after Cilta-cel (p = 0.0016).
Patients who received Ide-cel had a median follow up of 18.8 months (1.54 to 37.8), while Cilta-cel patients had a median follow up of 12.1 months (0.48 to 27.1). Forty-nine patients achieved a CR or better response while 84 patients achieved a VGPR or better response. On day 28 post CAR-T, 47 of 55 patients who received Ide-cel were MRD negative at 10−5 level (85.2%), while 69 of 73 patients (97%) after Cilta-cel were MRD negative (χ2 = 4.5625, p = 0.033). At 3 month follow up, 28 of 33 (85%) Ide-cel patients were MRD negative and 45 of 46 (97%) Cilta-cel patients were MRD negative (χ2 = 3.71, p = 0.054).
We captured absolute lymphocyte count (ALC) for all patients in the first 28 days after CAR-T infusion (Supplementary Fig. 1). The ALC grew exponentially (Fig. 1A) in patients, reaching a peak usually by day 14. However, the kinetics of expansion were different for Ide-cel (Fig. 1B) and Cilta-cel (Fig. 1C). We fitted an exponential function to the pooled data for Ide-Cel and Cilta-cel separately, leaving the initial value L(0), as a free parameter to be determined by the fitting (Supplementary Material). The results of these fits are presented in Supplementary Table 1. The model returned a greater initial value (day of infusion) of ALC for Ide-cel compared to Cilta-cel (0.0467 × 10⁹/L and 0.0276 × 10⁹/L, respectively, p = 0.05), compatible with the lower dose of infused cells for Cilta-cel (≈ 75 × 106 CAR-T cells for a 75 kg person, versus 300–510 × 106 CAR-T cells for Ide-cel). The lymphocyte replication rate ((k)) was faster after Cilta-cel compared to Ide-cel (0.391/day versus 0.242/day respectively, p = 0.0346). The ALC doubling time (DT) was 1.774 days after Cilta-cel and 3.198 days after Ide-cel (p = 0.0138).The median maximum ALC value in the first 28 days after cell infusion was 0.655×10⁹/L (interquartile range, IQR: 0.27–1.57 × 10⁹/L) for Ide-cel and 2.45 x10⁹/L (IQR: 1.23–4.74 × 10⁹/L) for Cilta-cel (p < 0.0001) (Supplementary Fig. 1). The ALC peaked by day 11 (6–24 days) with Ide-cel and day 12 (6–26 days) with Cilta-cel (p = 0.145). The median area under curve (AUC) for ALC over the first 28 days in patients without any glucocorticosteroid exposure was 11.27 (range: 2.57–34.51 × 10⁹/L days) for Cilta-cel versus 4.44 (0.11–12.24 × 10⁹/L days) for Ide-cel (p = 0.000892) (Fig. 1D).
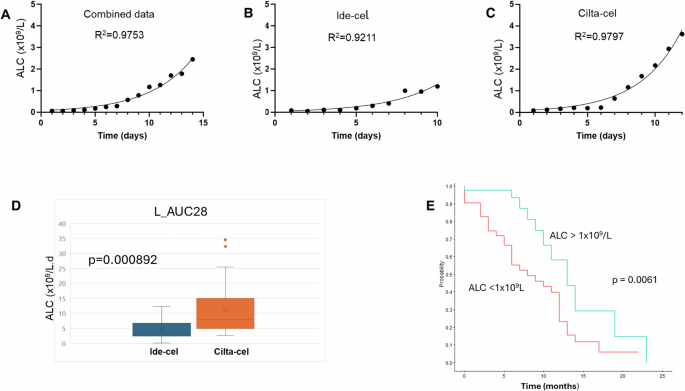
In (A), the median absolute lymphocyte count across the full cohort of patients (N = 133) is presented showing an exponential increase in the population. (B) ALC kinetics in patients treated with Ide-Cel while (C) shows ALC kinetics after Cilta-cel therapy. The kinetics are well described by an exponential function. (D) The area under curve of the ALC count in the first 28 days after CAR-T in patients who did not develop cytokine release syndrome and did not receive any glucocorticosteroids. The AUC is higher for Cilta-cel (p = 0.000892). E Progression free survival was superior in patients with an ALC > 1 × 10⁹/L after CAR-T therapy (p = 0.0061).
The maximum lymphocyte count (Lmax) correlated with the time to onset of CRS (ρ = 0.24, p = 0.028) but not with its duration, likely due to effective therapy of this complication. Similarly, Lmax strongly correlated with the time to onset of ICANS (ρ = 0.5856, p = 0.0218) but not with its duration (ρ = −0.501, p = 0.068).
The median PFS after CAR-T therapy for all patients was 11 months. Using a Cox model, ALC13 (HR = 0.45, p = 0.019) and ALC14 (HR = 0.33, p = 0.0092) impacted PFS (Supplementary Table 2). Similarly, the AUC for ALC from day 0 (i.e. the interval from day 0 to 14: AUC_L(14) (HR 0.88163, p = 0.0139); up to day 21: AUC_L(21) (HR 0.90938, p = 0.0111) and up to day 28: AUC_L(28) (HR 0.928324, p = 0.0132), all impacted PFS. An ALC > 1 × 10⁹/L within the first 28 days after CAR-T also influenced PFS (HR 0.39523, p = 0.0068) as also reported previously [7]. The maximum ALC post CAR-T (Lmax) was also associated with an improved PFS (HR 0.57831, p = 0.0008) as previously reported [7].
The median PFS for patients with an ALC > 1 × 10⁹/L was 13 months (10—not reached) and 8 months (6–12 months) for patients who did not meet this threshold (p = 0.0061) (Fig. 1E). Supplementary Table 2 summarizes the univariate analysis for PFS. The probability of achieving an ALC > 1 × 10⁹/L was higher in patients treated with Cilta-cel (79.5%) compared to Ide-cel (33.9%) (χ2 = 28.89, p < 0.00001).
With a median follow up of 1.54 years, the median OS has not been reached and estimated to be longer than 2.94 years. The parameters influencing OS were Lmax (HR 0.58, p = 0.0004), ALC(12) (HR = 0.39, p = 0.012), ALC(21) (HR = 0.91, p = 0.026), achieving an ALC > 1 × 10⁹/L (HR = 0.39, p = 0.013), the AUC_L between days 7 and 14 (AUC_L(7_14) (HR = 0.85, p = 0.0043) and the ALC DT (HR = 1.06, p = 0.0094). Serum ferritin as a continuous variable (HR = 9.36, p = 0.0094), and EMD (HR = 2.88, p = 0.006) influenced OS while high risk genetic abnormalities had no impact (HR = 1.33 [95% CI: 0.54–3.26], p = 0.53).
In a multivariate analysis for PFS, serum ferritin (HR 12.34, p < 0.01) and Lmax remained independent predictors of survival (HR 0.65, p = 0.0028), while the ALC > 1 × 10⁹/L lost significance (HR = 1.1, p = 0.84). With respect to OS, only the ALC(12) (HR = 0.198, p = 0.0032); AUC_L(7_14) (HR = 1.27, p = 0.05) and ALC DT (HR = 1.11, p = 0.0324) remained significant. The independence of ALC(12) and AUC_L(7_14) was surprising since these two are tightly correlated (Spearman’s ρ = 0.915, p < 0.0001). With sequential removal of parameters AUC_L(7–14) lost significance (p = 0.17), leaving only the ALC(12) (HR 0.42, p = 0.0275). Both ALC DT (1.07, p = 0.1) and ferritin (HR = 1.00, p = 0.28) lost their significance. The median ALC(12) for all patients was 0.99 × 10⁹/L (0.07–23.95). Therefore, we compared the impact of ALC(12) with ALC > 1 × 10⁹/L after CAR-T therapy on OS. ALC(12) remained significant (HR = 0.42, p = 0.05), while ALC > 1 × 10⁹/L lost its significance (HR = 0.83, p = 0.78). This suggests that both the ALC > 1 × 10⁹/L threshold and its timing are important. Finally we used the ALC > 1 × 10⁹/L and ferritin >400 ng/dl as nominal variables and evaluated their impact on OS. The ALC > 1 × 10⁹/L remained significant (HR = 0.38, p = 0.017), whereas the ferritin >400 ng/dl threshold lost its significance (HR = 0.87, p = 0.74). Patients who achieved an ALC > 1 × 10⁹/L have a median OS that is not yet reached compared to 2.94 years for patients who did not reach this threshold (p = 0.0743) (Supplementary Fig. 2). This is perhaps not surprising since ALC > 1 × 10⁹/L is associated with a higher incidence of MRD negative bone marrow at 1 month (63/64 versus 38/48, χ2 = 12.71, p = 0.0017), and 3 months (46/46 versus 28/34, χ2 = 11.72, p = 0.0028) post CAR-T.
Therapy with CAR-T has transformed the prognosis in RRMM but not all patients achieve durable responses. ALC kinetics correlate well with PFS and OS. It appears that an ALC of 1 × 10⁹/L within the first two weeks after CAR-T is critical to achieve durable responses. Although we did not look at T cell subsets, the ALC peaked by day 14 in almost all patients, similar to what Fischer et al. reported for CD3+ CAR-T cells after Ide-cel [8].
Our analysis was not intended to compare Ide-cel and Cilta-cel. However, phase 2 trials that led to the approval for Ide-cel and Cilta-cel showed a difference in PFS [3, 4]. It is possible that ALC kinetics in part explain differences in outcomes between these products. This work is limited by its retrospective nature and could be influenced by biases related to patient selection. Our studies complement others that have shown the importance of lymphocyte recovery after CAR-T and its impact on PFS and OS [7, 8]. An absolute lymphocyte count >1 × 10⁹/L is associated with a high probability of achieving an MRD negative state.


Responses