Genomic characterization of chronic lymphocytic leukemia in patients of African ancestry
Introduction
Chronic lymphocytic leukemia (CLL) is one of the most common adult leukemias in the United States [1]. The disease is defined by a mature clonal B-cell lymphocyte population ≥5 × 10⁹/L in the peripheral blood [2] and characterized by a high degree of variability in clinical course [3]. In addition to advanced age, other known risk factors for developing CLL include male gender, family history of lymphoproliferative disorders including CLL, inherited common variants, and European ancestry (EA) [4,5,6,7,8,9].
In the United States, the incidence rate of CLL among Whites is higher compared to Blacks, yet Black populations have a younger median age of disease onset compared to Whites [10,11,12,13,14]. In addition, differences among clinical characteristics and outcomes exist between self-reported Black and non-Black CLL patients. At time of diagnosis, preliminary reports in African Ancestry (AA) CLL patients showed higher frequency of adverse prognostic factors, including advanced Rai stage, increased β2 microglobulin levels, unmutated immunoglobulin heavy-chain variable region (u-IGHV) status, and del(17p) [11, 15, 16]. Moreover, these studies have found that AA CLL patients have shorter time to first treatment (TTT) and reduced overall survival (OS), and African American/Black ancestry has been shown to be an independent predictor of OS [8, 11, 13,14,15], with a 5-year relative survival of 62%, compared with 76% in non-Hispanic White [17]. Recent studies have found that the inferior survival among African American/Black ancestry was sustained even in the context of modern targeted agents [13, 14], although the disparity appears to be improving [14]. Nevertheless, the biological and/or socioeconomic features that elicit these differences remain poorly understood.
Over the past decade, the characterization of the CLL tumor genetics has been done through multiple sequencing studies [18,19,20,21,22]. The mutated CLL driver genes have been mostly grouped into Notch signaling, B-cell receptor signaling and differentiation, DNA damage repair and cell cycle control, chromatin modification, RNA and ribosomal processing, apoptosis, NF-κB signaling, and MAPK-ERK [18, 19, 21]. The total number of recurrently mutated CLL driver genes, as well as the number of altered signaling pathways, have been shown to impact CLL outcome [20, 23,24,25,26]. However, these studies have been performed mostly in patients with EA, and minority populations have been underrepresented [27]. Additionally, the importance of increasing the representation of AA populations in genomic studies was recently demonstrated with the discovery of AA-associated driver alterations and clinically actionable biomarkers across multiple cancer types [28]. Therefore, given the lack of genetic information in AA patients with CLL and a nonexistent understanding of the extent to which tumor genetics differs across ancestry among CLL patients, we screened the mutational status of 59 CLL driver genes and performed transcriptome studies in a cohort of CLL patients of genetic AA and compared it with an EA CLL cohort.
Methods
AA and EA CLL patient cohort
Blood was collected from individuals with CLL (N = 597). To define genetic ancestry, we used principal components analyses and genotype data from Illumina and Affymetrix arrays; 157 individuals with a median 81% of AA ancestry and 440 individuals with a median 99% of EA ancestry were included. The median time to blood collection from diagnosis was 1.76 years for the AA cohort and 0.03 years for the EA cohort. Baseline clinical characteristics, Rai stage, and IGHV-mutation status were abstracted from medical records. The CLL patient cohort was derived from multiple medical research centers located in different regions of the United States.
Peripheral blood mononuclear cells (PBMC) were obtained from all individuals. Extraction of DNA and RNA was performed either directly from PBMCs presenting a tumor cell population >80% or following the enrichment of CD5+/CD19+ clonal cells in cases with purity <80%. DNA and RNA were extracted using the Gentra Puregene Cell Kit and miRNeasy Mini Kit, respectively (Qiagen, Valencia, CA, USA).
Ethics approval and consent to participate
This study was approved by the Mayo Clinic Institutional Review Board (15-006439 and 10-005344). All participants provided written informed consent and all methods were performed in accordance with the relevant guidelines and regulations. The study was conducted in accordance with the Declaration of Helsinki.
Custom panel targeted DNA sequencing
The entire coding regions of 59 putative driver genes in CLL were sequenced using a customized SureSelect panel, as described previously [23, 26]. DNA samples were paired-end sequenced (150 bp reads) and run on the Illumina HiSeq 4000 sequencer. The median coverage depth per sample was 1474x, with >99% of the samples having a median coverage depth > 1000x per nucleotide, allowing the detection of mutations with variant allelic fraction (VAF) ≥ 1%. Somatic mutations were called using MuTect2 in tumor-only mode. Putative germline variants identified in the entire gnomAD dataset and within specific genetic ancestry groups in gnomAD or ESP6500 [29] public databases at a frequency higher than 0.01% (unless present in known CLL hotspots of the COSMIC [30] database), alternative variants with low coverage (<10 reads), and variant artifacts called due to sequencing strand bias were eliminated. The number of mutated genes per sample was then characterized by the presence of high impact (i.e., frameshift, nonsense, and splicing variants) and missense mutations in previously identified CLL hotspots (Supplementary Table 1).
Pipeline for RNA sequencing (MAP-RSeq)
mRNA sequencing was generated using a HiSeq 4000 sequencer for 36 AA CLL patients who were untreated at time of sample collection, 22 AA CLL patients whose samples were collected after treatment, and 292 EA untreated CLL patients. The raw RNA sequencing paired-end reads were processed through the Mayo RNA-Seq bioinformatics pipeline, MAP-RSeq version 3.1.4 [31]. MAP-RSeq employs STAR [32] to align reads to the reference human genome build hg38. Gene and exon expression quantification was performed using the Subread [33] package to obtain both raw and normalized (FPKM—Fragments Per Kilobase of transcript per Million mapped reads) reads. Finally, comprehensive analyses were run on the aligned reads to assess quality of the sequenced libraries. Batch correction for all RNA samples was performed by removing protein coding genes with low counts (i.e., mean and median thresholds below FPKM = 1), for each batch individually, resulting in 9934 protein coding genes. In addition, CombatSeq [34] was run using the annotated reported ancestry as a covariate, with CombatSeq corrected count values used for all downstream analyses. Differentially expressed genes were assessed using the bioinformatics package edgeR 2.6.2 [35] and defined by false discovery rate (FDR) < 0.01 and absolute log2 fold-change (Log2FC) ≥ 1 between groups. Unbiased pathway analysis to identify relevant biological processes was run on Metascape[36] and pathway visualization was performed with Pathview [37].
Telomere length quantification
Telomere length was initially measured through terminal restriction fragment length (TRF), and Southern blot hybridization was performed using the nonradioactive chemiluminescent TeloTTAGGG Telomere Length Assay (Roche Diagnostics, Penzberg, Germany), according to the manufacturer’s instructions. TRF is the gold standard of telomere length quantification; however, the high quantity of genomic DNA required for the assay (2 µg) limited its broad use to quantify all study samples. Therefore, we measured the average telomere length through quantitative-PCR (qPCR), which enabled the analysis of large sample sizes using low quantities of genomic DNA [38] and which was recently validated in a large CLL cohort [39]. Briefly, telomere and Beta-Globin (HBB) primers were used to amplify the telomere sequence and the single-copy gene, respectively, in each CLL sample (Supplementary Table 2). Each reaction was performed with 20 ng of DNA in a total volume of 20 µL in triplicate using the KAPA SYBR® FAST optimized for LightCycler®480 and analyzed on a LightCycler®480 (Roche Diagnostics, Mannheim, Germany). Absolute telomere lengths were then obtained by generating standard curves using synthetic oligonucleotide PCR standards for telomere and HBB, through serial dilution of each standard, as described previously [40] with minor modifications. Five samples with known telomere lengths through TRF analysis were included in every qPCR plate in order to perform a linear regression to account for variability between qPCR plates, as described previously [41]. The qPCR telomere lengths were validated with telomere lengths measured by TRF (n = 28; r = 0.85; p < 0.0001, Supplementary Fig. 1), and short and long telomeres were defined using the median telomere length as a cutoff.
Statistical analyses
Statistical comparisons were done using t-tests, ANOVA, chi-square tests, Pearson correlation coefficients, or non-parametric tests, where appropriate, using GraphPad Prism version 9.4.0. Univariable and multivariable linear regression was used to evaluate associations of telomere length with genetic ancestry; multivariable analyses were adjusted for IGHV mutational status, number of mutated genes per sample, and Rai stage.
Data sharing statement
All transcriptome data are available at GEO under accession number GSE246521. The remaining original data are available from the corresponding authors on reasonable request.
Results
Baseline study population characteristics
We sequenced 157 AA CLL patients and 440 EA CLL patients [23]. All but 42 AA CLL were untreated at time of sample collection. The following analyses were based on the untreated samples. The median age at diagnosis among the AA CLL and EA CLL were similar (61 years, Table 1) However, compared to EA CLL patients, AA CLL patients presented with lower Rai stage (p = 0.027) and higher frequency of unmutated IGHV (u-IGHV; 72% AA vs 51% EA, p < 0.0001; Table 1). Due to the known increased prevalence of somatic mutations in u-IGHV CLL compared to m-IGHV [18, 19], all analyses were performed in the AA (N = 115) and EA (N = 440) cohort as well as in the u-IGHV AA (N = 78) and u-IGHV EA (N = 218) CLL subsets. Lastly, we characterize the cohort of AA CLL patients whom had been previously treated at the time of sample collection (N = 42).
Genetic landscape of AA CLL
The most common mutated gene in EA CLL patients was NOTCH1 (16%), followed by SF3B1 (13%), TP53 (10%), NFKBIE (10%), ATM (8%), BIRC3 (7%), and XPO1 (7%) [23]. In the AA CLL patients, the most commonly mutated gene was also NOTCH1 (29%), followed by NFKBIE (17%), TP53 (17%), SF3B1 (16%), BIRC3 (11%), MGA (10%), EGR2 (9%), XPO1 (8%), MED12 (7%), and NXF1 (7%) (Fig. 1A, B Supplementary Table 3). The type and location of variants were similar in each cohort (Supplementary Fig. 2).

A Heatmap of mutated driver genes stratified by ancestry, treatment prior to sample collection, and IGHV status. The “Mutation Distribution” histogram represents the number of mutated genes per sample, with the type of mutation color-coded by known hotspot missense (yellow), frameshift (red), nonsense (purple), splice site (blue), and multiple mutations (green). B Frequency of mutated CLL driver genes compared between the AA (n = 115) and EA (n = 440) cohorts (black dot = p > 0.05; blue dot = p ≤ 0.05). C Frequency of mutated CLL driver genes compared between the u-IGHV AA (n = 78) and EA (n = 218) cohorts (black dot = p > 0.05; blue dot = p ≤ 0.05).
Overall, the number of mutated genes was higher in AA (median of 2, range 0–9) compared to EA CLL (median of 1, range 0–7; p = 0069;). However, when we subset to those CLL patients with u-IGHV status, the number of mutated genes was similar (median of 2 (0–6) in AA and to 2 (0–7) in EA CLL, p = 0.23 Supplementary Table 4). We observed higher mutation prevalence (i.e., >50% increase) in multiple driver genes, specifically BRCC3, NXF1, KMT2D, SYNE1, EGR2, FUBP1, EWSR1, MGA, TP53, and BIRC3 in u-IGHV AA CLL patients when compared to u-IGHV EA CLL patients (Fig. 1C).
DNA damage repair impairment and increased telomere erosion in AA CLL
Mutations in BRCC3 and TP53 have been associated with impaired DNA damage repair (DDR) and genomic instability [20, 42]. Therefore, we evaluated differential gene expression in the MSigDB [43,44,45] Hallmark gene set P53 Pathway, showing the unbiased clustering of AA CLL (Fig. 2A). Specifically, AA CLL patients presented a significant down-regulation of multiple genes associated with genome stability and cellular DNA damage response (including TP53 and BRCC3; FDR < 0.05). These findings persisted when subset the cohort to u-IGHV CLL patients.
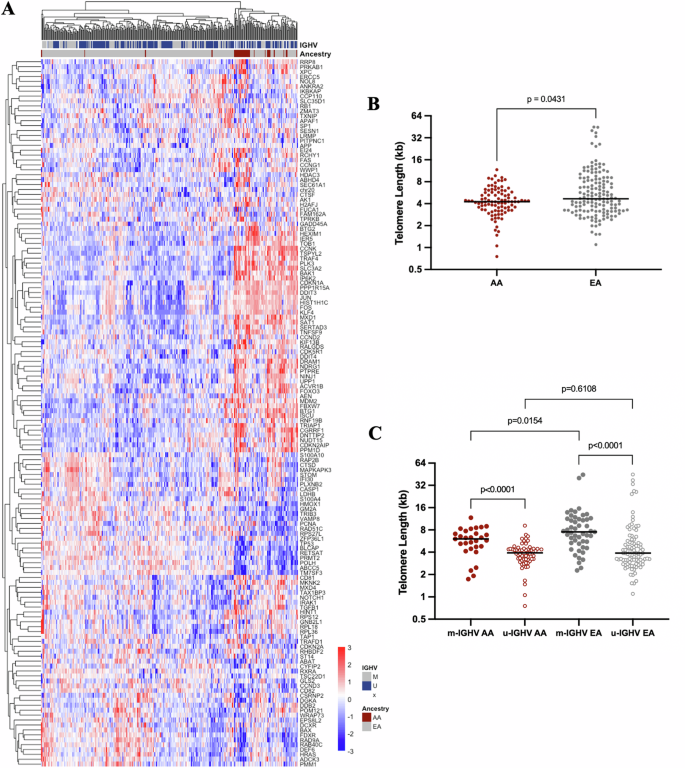
A Heatmap of the genes included in the P53 Pathway from the MSigDB Hallmark gene sets showing unbiased clustering of AA CLL. B Telomere length of AA (n = 95) and EA (n = 147) CLL samples measured by qPCR. C Telomere length of u-IGHV (n = 63) and m-IGHV (n = 29) CLL samples diagnosed in AA and u-IGHV (n = 94) and m-IGHV (n = 49) EA CLL samples.
To investigate differences in the telomere length between cohorts, we chose 95 AA CLL patients (median age at sample collection 63 years; range 34–91) and 147 EA CLL patients with frequency-matched based on age (median age at sample collection 63 years; range 31–86, Supplementary Fig. 3). Shorter telomere lengths were observed in the tumor cells of the AA CLL (median 4.25 kb; range 0.75–11.69) compared to EA CLL patients (median 4.68 kb; range 1.1–44.92; p = 0.0431; Fig. 2B). Importantly, the differences observed were restricted to the CLL tumor cells, as described previously [39], with no meaningful differences observed in telomere lengths of germline samples collected from AA and EA CLL patients (p = 0.80, data not shown). When stratifying by IGHV mutation status, shorter telomere length was observed in u-IGHV when compared to m-IGHV among both AA CLL (median 3.92 kb and 6.06, respectively; p < 0.0001) and EA CLL (median 3.89 kb and 7.53, respectively; p < 0.0001; Fig. 2C). We also note shorter telomere lengths in AA CLL compared to EA CLL among those with m-IGHV status (p = 0.0154), but not among those with u-IGHV (p = 0.6108; Fig. 2C).
The association of genetic ancestry on telomere erosion held in multivariable regression analysis, after accounting for Rai stage, IGHV status, and number of mutated CLL driver genes (n = 207; Table 2). Telomere length was 2.69 kb shorter among AA compared to EA (P = 0.0055). Similarly, those with u-IGHV had a significantly shorter telomere length compared to m-IGHV (P = 0.02). Previous studies have shown that the acquisition of different mutations (e.g., TP53 and ATM checkpoint variants) can be permissive to progressive cellular proliferation and critical telomere shortening [46]. However, most associations between telomere length and mutations of individual driver genes did not hold after adjusting for genetic ancestry, Rai stage, and IGHV status. We only found a significant increase in telomere length associated to XPO1 and IKZF3, although these results were limited by sample size (Supplementary Table 5).
NF-κB signaling pathway activation in AA CLL
Next, we performed an unbiased pathway enrichment analysis of differentially expressed genes. We identified the MSigDB [43,44,45] Hallmark gene set Tumor Necrosis Factor-alpha (TNFα) Signaling via the NF-κB pathway as the most enriched pathway in AA CLL compared to EA CLL (Fig. 3A). The NF-κB signaling pathway regulates immune response and inflammation, apoptosis and proliferation [47], and our gene expression analysis further demonstrated an overall enrichment of multiple additional pathways associated with immune response and inflammation in AA CLL. NF-κB pathway enrichment was identified when all cases were analyzed (Fig. 3B), as well as when the u-IGHV subset of patients was compared (Fig. 3C). Specifically, we observed an upregulation of key mediators of the canonical and non-canonical NF-κB pathway in AA CLL, including NFKB1, RELA, NFKB2, and RELB (FDR < 0.01; Supplementary Figs. 4, 5).

A Heatmap of the genes included in the TNFα signaling pathway via NF-κB from the MSigDB Hallmark gene sets showing unbiased clustering of AA CLL. B Bar graph of the results (−log10 p value) of functional enrichment analysis by Metascape comparing AA (n = 36) and EA (n = 292) CLL. C Bar graph of the results (−log10 p value) of the functional enrichment analysis by Metascape comparing u-IGHV AA (n = 31) and EA (n = 160) CLL.
Treated AA CLL samples
Lastly, we evaluated a cohort of AA CLL samples collected from patients previously treated prior to sample collection (N = 42). Prior treatment history of the treated AA CLL cohort was available for 33 patients and included 46% treated with chemotherapy regimens, 36% treated with chemoimmunotherapy, 15% with single-agent immunotherapy, and 3% with a novel agent associated with immunotherapy. Collectively, 60% of the treated AA CLL were male, median age at diagnosis was 52 years (range 25–79), Rai Stage at diagnosis was 0 in 56%, I-II in 33%, and III-IV in 11%, and 86% were u-IGHV.
Unsurprisingly, TP53 was identified as the most commonly mutated gene, found in 33% of cases. Then, NOTCH1 (24%), SF3B1 (24%), NFKBIE (17%), EGR2 (17%), BRAF (12%), MED12 (12%), MGA (12%), and XPO1 (12%). However, the overall transcriptional program between the treated AA CLL (n = 22) and the untreated AA CLL (n = 36) was very similar, with only one gene presenting an absolute log2FC higher than 1 (NKG7; log2FC = −1.031; p < 0.05). Finally, previous exposure to CLL treatment was associated to increased telomere erosion in an age and IGHV status frequency-matched comparison (Supplementary Fig. 6).
Discussion
Minorities have been consistently underrepresented in somatic sequencing studies, including CLL, and, to the best of our knowledge, this is first study describing the leukemic genetic and transcriptomic characteristics of AA CLL patients. Importantly, AA CLL was characterized by increased genomic complexity when compared to EA CLL, with increased prevalence of mutations in BRCC3, NOTCH1, NXF1, and NFKBIE. We also found enrichment of NF-κB signaling transcription and increased telomere erosion in AA CLL compared to EA CLL. Although our study was limited to 115 untreated AA CLL patients, our findings offer an inaugural overview of the genomic landscape in AA CLL and underscore the critical need to improve representation of AA patients in clinical trials, observational studies, and patient-reported outcome measures to better address the unique challenges faced by this population.
The findings identified in the present study indicate an augmented impaired DNA damage response (DDR) in AA CLL. DDR deficiencies accelerate the accumulation of chromosomal aberrations with progressive loss of genomic stability, recurrently identified in various cancers [48] and shown to negatively affect prognosis [20, 42]. Studies specifically evaluating the genomic alterations of many cancer types in the context of genomic ancestry reported higher genomic instability [49], homologous recombination deficiency, and aggressive molecular features in African Americans compared to European Americans [50]. However, these differences may be cancer type specific, highlighting the importance for increased inclusion of AA patients in future genomic studies [28].
Considering telomere dysfunction as a consequence of impaired DDR, we investigated telomere length in AA and EA CLL [51]. As expected, we found shorter telomere lengths among AA CLL compared to EA CLL patients, which was not limited to samples harboring TP53 and BRCC3 mutations. A recent study demonstrated highly variable telomere lengths in EA CLL, with shorter telomeres associated with a more aggressive CLL phenotype characterized by advanced Rai stage, u-IGHV, and TP53 and SF3B1 mutations. Additionally, shorter telomeres were also associated with higher genomic complexity, clonal evolution, and reduced progression free survival and overall survival [39]. The association between shorter telomeres in u-IGHV CLL has been previously documented, explained by the elongation of telomeres in the post-germinal center that occurs in m-IGHV CLL [39, 52]. Short telomeres also potentially generate a selective pressure for loss of cell-cycle checkpoint genes (including TP53 and ATM), becoming permissive to further cell proliferation and telomere shortening [53]. These alterations promote the continuation of the disordered processes, progressively accumulating genomic lesions [46]. Taken together, the impaired DDR, increased frequency of mutated genes, and shorter telomere lengths identified herein indicate higher genomic instability in AA CLL. Nevertheless, future studies should also evaluate the impact of lifestyle and environmental factors on telomere length.
The increased activation of the NF-κB signaling pathway, related to inflammation and proliferation, identified in AA CLL compared to EA CLL patients validates recent publications demonstrating an enrichment of immune- and inflammation-related genes and signaling pathways in tumor tissue-types from AA individuals [54,55,56,57,58]. Our results also corroborate findings of upregulation of NF-κB and inflammatory cytokines, including increased expression of IL6 in AA prostate cancer [59, 60]. Specifically, we suggest that tumor promoting inflammation plays an important role in AA CLL. Additional studies with larger sample sizes should be conducted to confirm the germline upregulation of the NF-κB signaling pathway in normal B-cells of AA patients, evaluating its potential impact in the tumorigenesis and progression of CLL.
Strengths of our study include the deep tumor sequencing of a comprehensive set of recurrently mutated CLL genes in a meaningful cohort of AA CLL patients compared to an EA CLL cohort. We also highlight the novelty of transcriptomic evaluation in our AA CLL cohort compared to EA CLL cohort. Limitations include the longer median time to sample acquisition from diagnosis in the AA cohort than the EA cohort, which may result in higher mutations in the AA cohort, and the sample size disparity between the two cohorts. We also note the sequencing of known CLL driver genes was determined by studies of an overwhelming majority of EA CLL patients. Future research efforts on whole genome sequencing of coding and non-coding DNA abnormalities are needed to comprehensively characterize the genomic landscape of AA CLL in an unbiased manner, as well as further characterize AA CLL in the context of the heterogeneous ancestry within Africa.
In summary, we have begun the characterization of the AA CLL genomic landscape, with evidence of higher genomic instability among AA CLL compared to EA CLL. Although the increased prevalence of driver mutations in the AA population is certainly driven by the higher frequency of u-IGHV cases [18, 19] and the longer median time to blood collection following diagnosis, we highlight the enrichment of crucial disease-related signaling pathways in our entire AA CLL cohort but also when evaluating solely the u-IGHV AA CLL individuals. Future studies are needed to evaluate whether the genomic and transcriptomic differences identified in this study of AA CLL impact clinical outcomes of these patients, providing novel insights into the racial/ethnic health disparities found in the disease. Further explorations of CLL in minority populations are necessary to better understand differences in the disease across populations, aiming towards the identification of novel vulnerabilities.

Responses