Finite element-based nonlinear dynamic optimization of nanomechanical resonators
Introduction
Design of mechanical structures that move or vibrate in a predictable and desirable manner is a central challenge in many engineering disciplines. This task becomes more complicated when these structures experience large-amplitude vibrations, since linear analysis methods fail and nonlinear effects need to be accounted for. This is particularly important at the nanoscale, where forces on the order of only a few pN can already yield a wealth of nonlinear dynamic phenomena worth exploiting1,2,3,4,5.
Although design optimization of micro and nanomechanical resonators in the linear regime is well-established6, the use of design optimization for engineering nonlinear resonances has received less attention7. This is because designers tend to avoid the nonlinear regime, and optimizing structures’ nonlinear dynamics is more complex, which requires extensive computational resources. As a result, available literature on nonlinear dynamic optimization is limited, although some recent advances have been made that combine analytical methods with gradient-based shape optimization, to optimize nonlinearities in micro beams8,9. For nonlinear modeling of more complex structures, several approaches have been developed based on nonlinear reduced order modeling (ROM) of finite element (FE) simulations10,11,12. A particularly attractive class known as STEP (STiffness Evaluation Procedure)13 can determine nonlinear coefficients of an arbitrary mechanical structure and can be implemented in virtually any commercial finite element method (FEM) package. This, for instance, has been recently shown by using COMSOL to model the nonlinear dynamics of high-stress Si3N4 string14 as well as graphene nanoresonators15. Since the number of degrees of freedom in the ROM is much smaller than that in the full FE model, the nonlinear dynamics of the structure can be simulated much more rapidly using numerical continuation packages16.
In this work, we present a route for nonlinear dynamic optimization that is based on an FE-based ROM. The methodology, which is a combination of Particle Swarm Optimization (PSO) with STEP13 (OPTSTEP), has several beneficial features. First of all, because it uses a derivative-free optimization routine for approaching the optimal design, it can be implemented and combined with FEM packages that are not able to obtain gradients easily. Secondly, the ROM parameters generated in OPTSTEP can facilitate explicitly expressing the optimization goals. Finally, as will be shown, the developed procedure allows using multiple objective functions to approximate a Pareto front, which can help designers in decision-making processes when having to balance performance trade-offs among different objectives. Considering the outstanding performance as ultrasensitive mechanical detectors and the mature fabrication procedure17,18, we select high-stress Si3N4 for the experimental validation of our methodology.
The manuscript is structured as follows. We first introduce and describe the general OPTSTEP methodology. Then we demonstrate the method on the specific challenge of the optimization of the support structure for a high-stress Si3N4 nano string, while taking the maximization of its Q-factor and nonlinear Duffing constant β as examples of linear and nonlinear objectives. By comparing the PSO results to the Q and β values that result from a brute-force simulation of a large number of designs that span the design space, we validate that OPTSTEP finds the optimum designs much faster with the same computational resources. Subsequently, we turn to the problem of dealing with multiple objective functions and focus on simultaneously maximizing both Q and β, demonstrated by a Pareto front. For validation, the results are compared to experimental measurements of fabricated devices. We conclude by demonstrating the potential of OPTSTEP for optimizing the performance of resonant sensors by using more complex objective functions that are relevant for engineering their response time, sensitivity, and power consumption.
OPTSTEP methodology
An overview of the OPTSTEP method is schematically shown in Fig. 1. In the current work, we use it for engineering a parameterized geometry. We use nanomechanical string resonators with compliant supports, which are shown in Fig. 1a, to demonstrate the methodology. We keep the length L and width w of the central string constant, while varying the width ws, length Ls and angle θ of the supports, as well as the thickness h of the device. It is noted that the OPTSTEP methodology might be used with a larger number of parameters, or even might be extended towards shape or topology optimization of nonlinear dynamic structures. However, such extension is out of the scope of the current work.
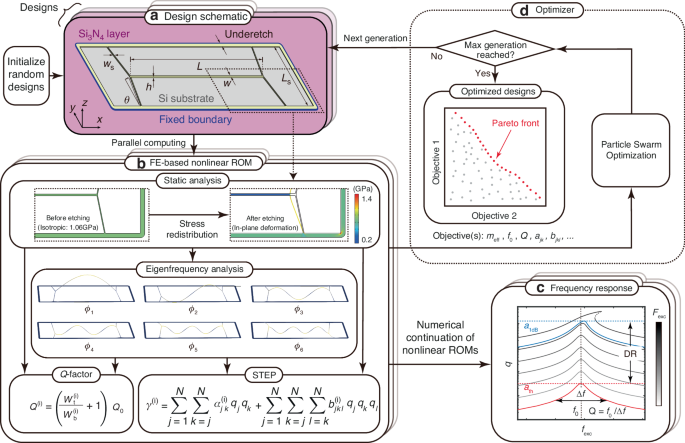
a A device geometry is chosen and parameterized by a set of design optimization variables. In this specific case a Si3N4 nanomechanical string resonator is chosen for demonstrating OPTSTEP. b All designs in one generation are simulated in parallel on a high-performance computing cluster. Static analysis is conducted to evaluate the stress redistribution and deformation after etching, followed by eigenfrequency analysis. Resonance frequencies, mode shapes, Q-factor and the ROM are obtained from the full FE model. c The ROM is simulated by numerical continuation. d Objective(s) selected from ROM are sent to an optimizer (PSO in this study) to generate design variables for the next generation
For a certain set of geometrical parameters, a ROM for the parameterized structure is generated using the STEP method13, which we implemented with shell elements in COMSOL14. Besides geometric parameters and boundary conditions (see Fig. 1a), the COMSOL simulation contains material parameters (see Methods), and the initial pre-stress distribution is calculated using a static analysis14. We conduct this static analysis assuming the material is isotropic and pre-stressed (σ0 = 1.06 GPa). We then calculate the stress redistribution during the sacrificial layer underetching process, whereby the high-stress Si3N4 layer releases from the silicon substrate. Note that in the present study we only consider θ ≥ 0, such that the central string is always in tension (in contrast to ref. 14). After the static analysis, an eigenfrequency analysis is performed to obtain the out-of-plane eigenmodes ϕi (see Fig. 1b). These eigenmodes, together with the redistributed stress field obtained from the static analysis, are then used to determine the effective mass meff, resonance frequency f0, and Q-factor. We can calculate Q-factors19,20 of the ith eigenmode Q(i) based on the stored tension energy ({W}_{{rm{t}}}^{(i)}) and bending energy ({W}_{{rm{b}}}^{(i)}):
where σxx, σyy and σxy is the stress in the Cartesian coordinate, Q0 is the intrinsic Q-factor of stress-free Si3N421.
As indicated in Fig. 1b the STEP method generates a set of coupled nonlinear differential equations13,14,15, where the effective nonlinear elastic force acting on the ith mode is given by the function γ(i) that depends on the quadratic aij, cubic bijk coupling coefficients, and the generalized coordinates qi. qi describes the instantaneous contribution of the corresponding mode shapes ϕi to the deflection of the structure.
Thus, the finite element model with several thousand or even millions of degrees of freedom (DOFs) is reduced to a condensed ROM, that can usually describe the nonlinear dynamics to a good approximation with less than ten degrees of freedom. We can visualize the resulting frequency response curves for different harmonic drive levels by numerical continuation16, as shown in Fig. 1c.
The resulting ROM parameters, including effective mass ({m}_{{rm{eff}}}^{(i)},Q)-factor, linear stiffness ({k}^{(i)}={m}_{{rm{eff}}}^{(i)}{(2pi {f}^{(i)})}^{2}) and nonlinear stiffness terms ajk, bjkl, are passed to the PSO optimizer (see Fig. 1d). The algorithm randomly generates many different initial designs by varying the geometric parameters, as shown in Fig. 1a. For each of these designs, known as a “particle” in PSO, a ROM is generated by STEP and the corresponding objective functions are computed accordingly and passed to the optimizer. The optimizer then generates a next generation of particles based on the designs from the current generation, the objective functions, and the constraints, with the aim of improving their design parameters to optimize the objectives (see Supplementary Note 1). The optimization loop will iterate until it reaches the predefined maximum generation. If multiple objective functions are selected to be optimized, there is an additional step that selects the nondominated particles according to Pareto dominance22. Because each particle is evaluated independently, PSO enables efficient parallel computing to evaluate all particles in one generation on a high-performance computing cluster.
OPTSTEP implementation and validation
Single-objective optimization with OPTSTEP
We implement the presented OPTSTEP methodology to optimize the support geometry of the string resonator shown in Fig. 1a. The motion of the fundamental mode of the resonator can be described with the following nonlinear equation of motion:
where q is the displacement at the string center, f0 is the resonance frequency, Q is the Q-factor, β = b111/meff is the mass-normalized Duffing constant, and ({F}_{{rm{exc}}}sin (2pi ft)) is the mass-normalized harmonic drive force. To demonstrate the single-objective optimization capability of OPTSTEP, we present results for two optimization objectives, respectively: maximizing the Q-factor (shown in Fig. 2a, c, d) or maximizing the mass-normalized Duffing constant β (shown in Fig. 2b, e, f) of the fundamental mode. We emphasize that a maximum Q or β does not necessarily result in the best performance for all applications of nanomechanical resonators. We choose these optimization objectives as examples to demonstrate that the OPTSTEP methodology can be used to find extreme values of a single objective function, that can be suitably chosen depending on the application requirements. As design parameters, we use the support parameters (Ls, ws, θ and h in Fig. 1a). The PSO algorithm can freely initialize and vary these variables between preset constraints 10 μm < Ls < 100 μm, 1 μm < ws < 7 μm, 0 rad < θ < 0.4 rad, and 40 nm < h < 340 nm.
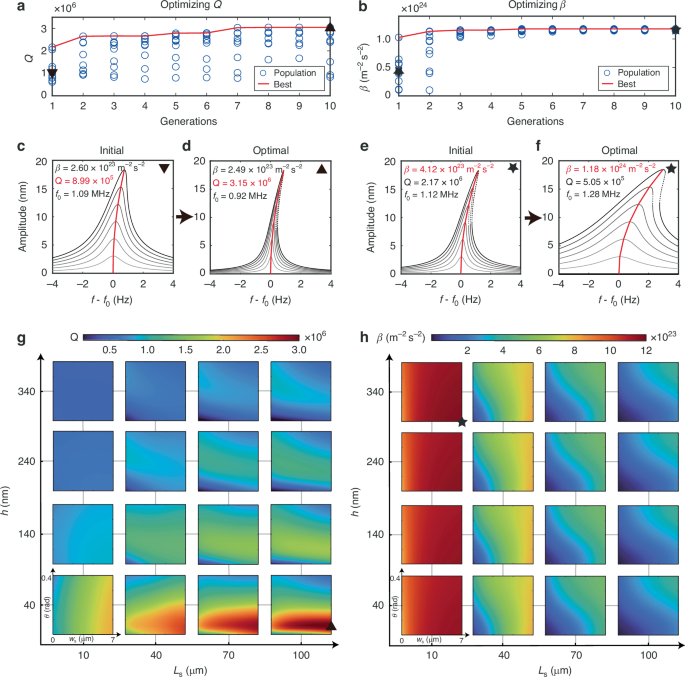
Four geometric parameters are selected as design variables in Fig. 1. ws and θ represent x and y axis, respectively, of each contour plot. PSO’s evolution shows the procedure of searching for maximum a Q and b β, where the red lines mark the global best design of each generation. Frequency response curves around the fundamental mode of (c, e) the designs with median performance in the initial generation and (d, f) the optimized designs, for Q maximization (c, d) and for β maximization (e, f), where the objectives and backbone curves are marked in red. The dotted lines are unstable solutions. The greyscale of response curves go from light to dark as the drive level increases. Contour plots show the parametric study for (g) Q-factor and (h) mass-normalized Duffing constant β. The optimized designs found by PSO are marked as an upward-pointing triangle and a star, while the downward-pointing ones represent the designs with average objective values in the initial generation
We initialize the PSO algorithm with 10 randomly generated particles, as indicated by the blue circles at the first generation in Fig. 2a, b. The Q and β values of the best performing particle per generation are highlighted by the red line, which converges towards an optimum. Simulated response curves at different drive levels of the initial design (median performance of the initialized particles) and the optimized design are shown in Fig. 2c, d for Q and Fig. 2e, f for β. It is obvious that the resonance peaks become narrower from Fig. 2c to Fig. 2d, indicative of an increase in Q-factor. From the backbone curves shown in Fig. 2e, f, we see that the resonance frequency of the optimized device shifts more at the same vibration amplitude, which suggests a larger, optimized value of β.
Numerical validation
In order to validate the PSO results, we compare them to a brute-force parametric study where we simulate a large number of designs that span the full design parameter space, and plot the resulting values of Q and β in the contour plots in Fig. 2g, h. Each of these subfigures consists of 16 small contour plots, each of which has a different combination of Ls and h, while along the axes the parameters ws and θ are varied. The red-colored regions in the plots contain the optimal values of Q and β, which are indicated by a triangle and a star. In Supplementary Table S1, we compare the optimized design parameters from the OPTSTEP method to the best devices from the parametric study. The close agreement between both approaches provides evidence that the OPTSTEP method is able to optimize both linear (Q) and nonlinear (β) parameters of the ROM. The results in Fig. 2a are obtained in 30 minutes using a high performance computing cluster, while the parametric study in Fig. 2g takes over 325 hours on the same cluster with the same amount of nodes. This illustrates the advantage in computation time that can be realized with OPTSTEP, although it is noted that these times strongly depends on the resolution of the parameter grid and other simulation parameters.
Experimental characterization
To compare the OPTSTEP method to experimental results, we also perform an experimental parametric study on 15 string resonators with varying support design parameters. For this, we fabricated a set of devices with 10 μm < Ls < 90 μm and 0 rad < θ < 0.2 rad, while keeping h = 340 nm and ws = 1.0 μm fixed. Figure 3a shows a Scanning Electron Microscope (SEM) image of an array of nanomechanical resonators with varying support designs made of high-stress Si3N4 (see “Methods” for more details). To characterize the nonlinear dynamics of the devices, as shown in Fig. 3b, we fix the chip to a piezo actuator that drives the resonator by an out-of-plane harmonic base actuation in the out-of-plane direction. We use a Zurich Instruments HF2LI lock-in amplifier, connected to an MSA400 Polytec Laser Doppler vibrometer, to measure the out-of-plane velocity at the center of the string resonator as a function of driving frequency (see Fig. 3c). We use a velocity decoder with a calibration factor of 200 mm/s/V. We perform all measurements in a vacuum chamber with a pressure below 2 × 10⁻⁶ mbar at room temperature.
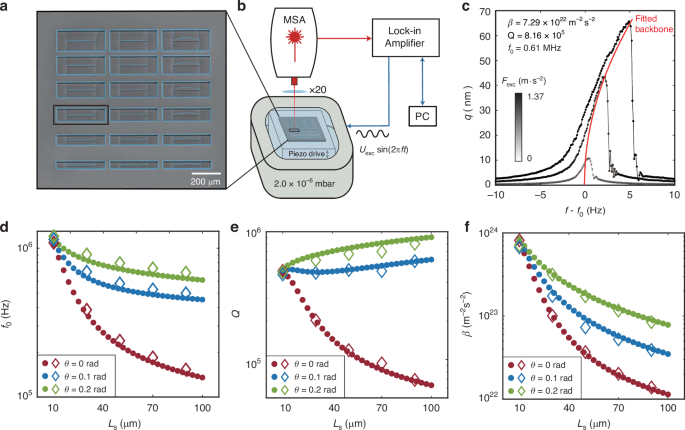
a Scanning Electron Microscope (SEM) image of an array of devices (colored in blue) with thickness h = 340 nm and different design variables. b Schematics of the measurement set-up, which includes a Micro System Analyzer (MSA) Laser Doppler Vibrometer (LDV) for motion detection and a piezo-actuator for driving the resonator. c Frequency response curves measured around the fundamental resonance frequency of the device with Ls = 90 μm, ws = 1 μm, θ = 0.20 rad. The red curve is the fitted backbone. d–f Measured (diamonds) and FE-simulated (dots) resonance frequencies, Q-factor and Duffing constant β for various values of the support length Ls and angle θ, for devices with ws = 1 μm and h = 340 nm. Error bars of measured results are smaller than the size of diamonds
Figure 3c shows the frequency response at the center of the string at various drive levels for a device with Ls = 90 μm, ws = 1 μm, θ = 0.20 rad and h = 340 nm. We estimate the linear resonator parameters of all devices by fitting the measured frequency response curves at various drive levels with the following harmonic oscillator function14 (see Supplementary Note 2):
where qd(f) is the measured amplitude, ({q}_{max ,{rm{l}}}) is set equal to the maximum measured amplitude ({q}_{max ,{rm{nl}}}) as the peak amplitude of the linear oscillator, and f is the drive frequency. To determine the nonlinear stiffness, we measure the resonator’s frequency response at increasing drive levels, construct the backbone curve, and use the relation between the nonlinear peak amplitude qmax,nl and the peak frequency ({f}_{max }) to fit and obtain the mass-normalized Duffing constant β using the following equation23,24:
To compensate for small drifts in f0 during the experiments, before fitting with Eq. (4), we plot the frequency response curves along the f − f0 axis14. The fitting procedure to obtain f0, Q and β using Eqs. (3) and (4) is explained in more detail in Supplementary Note 2.
In Fig. 3d–f, we compare the dynamical properties between FE-based ROMs (dots) and measurements on 15 string resonators (diamonds) as a function of Ls and θ. It is evident that the fundamental resonance frequency f0, Q-factor, and the mass-normalized Duffing constant β of the fabricated devices, are all well predicted by FE-based ROMs. It can also be seen that for short support lengths Ls the device performance is similar, whereas increasing Ls allows tuning f0, Q and β as we studied in more detail earlier14,19. In the next section we will compare these experimental results to multi-objective optimization as further validation of OPTSTEP.
Multi-objective optimization with OPTSTEP
For actual device design there are often multiple performance specifications that need to be met. It might sometimes be possible to condense these performance specifications into a single figure of merit, like the f0 × Q product for nanomechanical resonators. However, to make the best design decisions, it is preferred that the optimizer works with two (or more) objective functions like enhancing f0 and Q, simultaneously. To enable this, we implement OPTSTEP with a multi-objective particle swarm optimization (MOPSO), which is an extension of single-objective PSO. After multi-objective optimization, the nondominated particles in the swarm are used to determine an approximation of the Pareto front, which is the set of designs for which improving one of the objectives will always lead to a deterioration of the other objective(s). By performing MOPSO, we aim at finding the Pareto front in the design space for multiple objectives, that represents the boundary on which all optimized designs reside for the chosen variables. As the red dots show in Fig. 1d illustrate, the Pareto front represents the boundary between feasible and unfeasible combinations of objectives and thus allows the designer to make the best trade-off among different objectives.
To demonstrate that multi-objective optimization can be combined with OPTSTEP, we use it to simultaneously maximize Q and β. Devices with high quality factor and nonlinear stiffness can be of interest in cases where we are looking for designs that can drive a string into the nonlinear regime with a minimum driving force and power consumption.
The resulting Pareto fronts are shown in Fig. 4a. Since we are also interested in the effect of the constraints on the optimum solutions, we include Pareto fronts with: no constraint (purple), a thickness constraint of h = 340 nm (gray), and with thickness and support width constraint (multi-colored). These three Pareto fronts show that there is a clear trade-off between Q and β, with higher Q-factor leading to lower nonlinearity β. The experimental devices share the same constraints (ws = 1 μm and h = 340 nm) as the multi-colored Pareto and are plotted as the hollow diamonds with error bars in Fig. 4a (see Supplementary Table 2). We observe that all experimental points reside in the region on the left hand side of the Pareto front, confirming the area enclosed by the Pareto front indeed captures the feasible devices, and experimentally strengthening the confidence in the OPTSTEP approach for multi-objective designs. The color of the points links the points in the Q − β graph in Fig. 4a to the corresponding design parameters in Fig. 4b. In Fig. 4b the schematic support geometries are shown as insets for both maximum β (dark blue) and maximum Q (dark red). We choose some of the fabricated devices close to the Pareto front to show typical measured frequency response curves and microscopic images in Fig. 4c–f, which correspond to the star, triangle, circle and square data markers in Fig. 4a, b. Together with the microscopic images, it is apparent that with minor alterations in the support region, the response of the string resonators can be largely tuned. To further explore the effect of other design parameters numerically, we release the constraint on ws, keeping only h = 340 nm constrained, and conduct MOPSO (see the gray Pareto front). We can see from the comparison between the gray and multicolored fronts that the performance gain from changing ws is not very large. In contrast, if we further relax the constraint on h = 340 nm, which shares the same design space in Fig. 2g, h, we obtain the purple Pareto front. The thinner h pushes the Pareto front to have much higher Q. The long plateau at fixed β is mainly attributed to the increase in Q that results from the dependence of the intrinsic quality factor Q0 on h (see Methods). Besides validating the MOPSO approach by comparing with experimental data, we also use the data from the parametric study in Fig. 2 to extract and generate reference Pareto fronts that are shown as black solid, dotted, and dashed lines in Fig. 4a (see Supplementary Note 3), with constraints that match those from the MOPSO optimization.
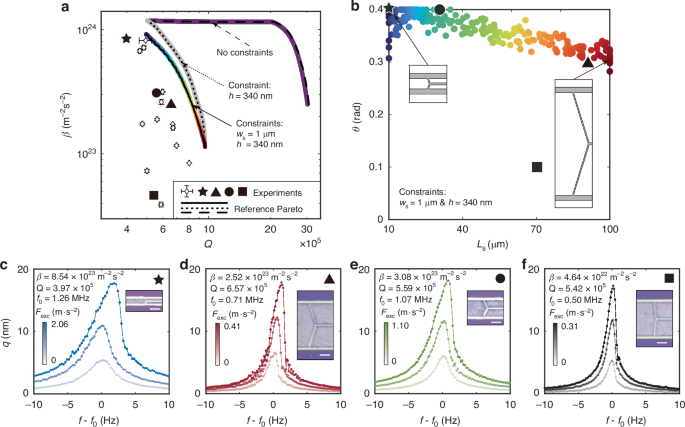
a Three Pareto fronts for different constraints (see main text) on design variables are shown in purple, gray and multi-colored dots. Measurements of devices that have the same design variables as the multi-colored Pareto front are shown by diamonds with error bars. The reference Pareto fronts (black solid, dotted and dashed lines) are generated by selecting the designs with maximum Q and β from the parametric study shown in Fig. 2g, h for the respective constraints (see Supplementary Note 3). b Each dot from the multi-colored Pareto front in (a) is plotted in the design space with the same color. The insets show the support design for a device with maximum Q and a device with maximum β. Measured frequency response curves for devices with maximum β (c), maximum Q (d), high Q & β (e), and low Q & β (f). Black symbols in the plots correspond with devices data points plotted in (a) and (b). The insets are images taken by Keyence digital microscope VHX-6000 and white scale bars are 20 μm
Discussion
The OPTSTEP methodology that is presented in this work enables the optimization of the nonlinear dynamic properties of resonant structures using standard FEM software, since it is based on the STEP and uses a derivative-free optimization method. The exclusive reliance on FEM outputs, without requiring information from the full mass and stiffness matrices, increases its generality and allows multi-physics optimization, including also e.g., electromagnetic or thermodynamic phenomena. We note that although derivative-free techniques like PSO are able to efficiently find near-optimal values of design parameters, optimality guarantees can typically not be given, and the techniques are therefore also called metaheuristic optimization techniques. Here, in order to validate the OPTSTEP methodology numerically and experimentally, we have focused on β and Q maximization of the fundamental mode of a string resonator by geometric support design. After having established the methodology, it is now of interest to apply it to explore performance parameters that are more relevant to applications. For example, as shown in Fig. 5, our methodology can directly be extended to optimize the power consumption P, sensitivity (the limit of detection expressed in Allan Deviation, assuming averaging time τ = 1s) σy and response time τr of resonant sensors25,26, since these figure-of-merits can be directly expressed in terms of meff, f0, Q and β (see Supplementary Note 4). In Fig. 5, 1000 nondominated particles are found by OPTSTEP to form a 3D surface that approaches the Pareto frontier with the objective of minimizing P, σy and τr simultaneously. The particles have the same design constraints as in the example in Fig. 2 and the purple Pareto front in Fig. 4a, which are 10 μm < Ls < 100 μm, 1 μm < ws < 7 μm, 0 rad < θ < 0.4 rad, and 40 nm < h < 340 nm. The competing design trade-offs between these three objective functions are obtained from OPTSTEP, and are visualized in Fig. 5 by showing four typical designs near the Pareto frontier. As demonstrated by the designs at the upper right corner of the Pareto frontier, we can conclude that the devices with shorter response time are more likely to have thicker supports, which lead to a higher resonance frequency f0 combined with a low Q, thus resulting in a smaller Q/f0 ratio. At the same time, these thicker supports also contribute to a larger onset of nonlinearity a1dB14, so the resonators are able to work at much larger amplitudes in the linear regime, which provides a better sensitivity σy. However, the larger a1dB and meff will require more energy to sustain the oscillation at resonance that causes higher power consumption P. In contrast, the devices with much lower power consumption P while maintaining comparably high sensitivity σy, which are shown at the lower left corner in Fig. 5, are equipped with more slender supports. With only a slight increase of support angle θ from 0, the low torsional stiffness of supports is maintained while the stress in the central string can be significantly increased19, leading to a higher Q, which can be confirmed by Fig. 2g. Consequently, when aiming at designing a resonant sensor with relatively low power consumption P, high sensitivity σy and short response time τr with compliant supports, a pair of slender and slightly angled supports, together with a medium thickness of Si3N4 layer is generally favored.
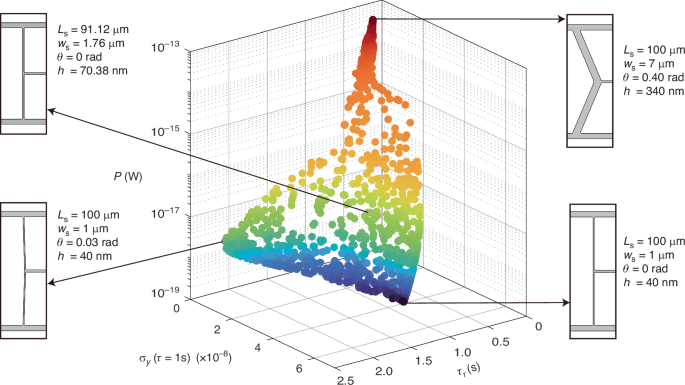
The insets show the geometries and design parameters of supports of four representative designs on the Pareto frontier. The gradual change of color from dark blue to dark red marks the increasing in power consumption P when operating the nanoresonator at the onset of nonlinearity a1dB to guarantee the maximum sensitivity
In other cases, like approaching the quantum regime with a nonlinear nanomechanical resonator27, it is beneficial to maximize Q and β simultaneously. The OPTSTEP methodology can also be used for more complex design problems that involve multiple modes5,8,14,28, for avoiding or taking advantage of mode coupling, for instance by optimizing nonlinear coupling coefficients (ajk and bjkl in Fig. 1b) and resonance frequency ratios. Since OPTSTEP generates the ROM parameters at each generation, it is particularly suited for dealing with cases where the device specifications can be expressed in terms of these parameters. Interesting challenges include increasing frequency stability by coherent energy transfer29,30, signal amplification31 and stochastic sensing4,32. Moreover, intriguing paths for further research involve inclusion of nonlinear damping or extension to full topology optimization6. Also the use of alternative optimization strategies, like binary particle swarm optimization (BPSO)33, that could generate radically new geometries, is an interesting direction.
Conclusions
To sum up, we presented a methodology (OPTSTEP) for optimizing the nonlinear dynamics of mechanical structures by combining an FE-based ROM method with a derivative-free optimization technique (PSO). We demonstrated and validated the methodology by optimizing the support design of high-stress Si3N4 nanomechanical resonators. The method was verified numerically by comparing its results to a brute-force parametric study, for both single- and multi-objective optimization. Experimental data on the Q-factor and Duffing nonlinearity were in correspondence with the OPTSTEP results. The capability of the method was also demonstrated by multi-objective optimization of the support for the nanomechanical resonator, targeting improvements in power consumption, sensitivity and response time in resonant sensing. We thus conclude that the method can be applied to a wide range of complex design challenges including nonlinear dynamics, and is expected to be compatible to most FE codes and derivative-free optimization routines. It holds the potential to facilitate and revolutionize the way (nano)dynamical systems are designed, thus pushing the ultimate performance limits of sensors, mechanisms and actuators for scientific, industrial, and consumer applications.
Methods
Sample fabrication
We produce our nanomechanical resonators using electron beam lithography and reactive ion etching techniques on high-stress Si3N4 layers, chosen for their reliability and precision in achieving design specifications20. These layers are deposited via low pressure chemical vapor deposition (LPCVD) onto a silicon substrate. Following this, the devices undergo suspension through a fluorine-based deep reactive ion underetching process. The mechanical properties of the high-stress Si3N4 are characterized in our previous works14, with an initial isotropic stress σ0 = 1.06 GPa, Young’s modulus E = 271 GPa, Poisson’s ratio ν = 0.23, mass density ρ = 3100 kg/m3. The intrinsic quality factor is a function of thickness h21, which is ({Q}_{0}^{-1}=2800{0}^{-1}+{left(6times 1{0}^{10}hright)}^{-1}).
Responses